Background and aims
Empirical studies of ice sliding began with the work of Reference HopkinsHopkins (1845, Reference Hopkins1849) who studied steady sliding velocities as a function of slope and who also discovered there was a limiting slope beyond which acceleration sets in. He also found that for a given slope the steady speed increased with load. These findings are basic features of ice sliding but his tests did not cover a range of roughnesses or examine the effects of normal stress and shear stress independently. Although the velocities were comparable to real glacier velocities, the normal and shear stresses were about two orders of magnitude too low.
Extensive studies of ice sliding were carried out by Reference Bowden and TaborBowden and Tabor (1950-64) but these did not cover the conditions of stress, roughness, and velocity appropriate to glaciers. Nevertheless, some useful friction properties of ice were obtained which do have some relevance to glacier sliding.
A series of tests of ice sliding, wear, and erosion was carried out by Reference Lister, Lister, Pendlington and ChorltonLister and others (1968). These studies however were not aimed at establishing an ice-sliding relation. Reference Barnes, Barnes, Tabor and WalkerBarnes and others (1971) studied coefficients of ice sliding friction over a wide range of velocities, from about 10−1 to 107m a−1, for different surface types at temperatures from 0 to —18.5°C. These results established several important facts, including the existence of a double-valued friction law for ice and the occurrence of the maximum coefficients of friction at velocities in the range 102 to 103m a−1. The marked increase in friction at lower temperatures was also clearly demonstrated. These results however did not differentiate clearly the effects of varying shear and normal stress independently, neither was a systematic study of the effect of roughness, especially for high roughnesses, carried out. A further limitation of techniques used in these tests was that the area of the ice contact was very small (80 mm2 or less) which made large-scale roughness difficult to assess.
A serious attempt was made by Reference Chadbourne, Chadbourne, Cole, Tootill and WalfordChadbourne and others (1975) to test ice-sliding theories with experiments to measure the sliding velocities as ice moved under load down various inclined rough surfaces. They noticed a number of important results: First, for constant shear stress the velocity decreased with normal stress. Secondly, for a constant normal load the velocity varied linearly with shear stress. Finally, it was noted that higher velocities appeared to result from the increasing water-film thickness caused by the frictional energy dissipation. All these results have been found to be important in the present study, but it should be noted that their normal stress was low (≈ 3 bar) and the roughness was on a small scale, but the amplitudes of asperities was larger than the expected water-film thickness
The inception of the present study was described briefly by Reference BuddBudd (1976). Our major aim is to examine the sliding properties of ice relevant to the basal sliding of ice masses. That is to say, an attempt is made to study shear stresses and normal stresses comparable to those under real glaciers for ice sliding over rock-type surfaces with a wide range of roughnesses. The main problem is that it is difficult to match the large scales of features under real glaciers, so that a range of scales needs to be studied to determine the effect of scale, as far as is practicable. For most real glaciers, typical normal stresses range from 5 to 50 bar, and shear stress from about 0.5 to 2 bar. Some large glaciers have higher normal stresses but rarely exceed two bars shear stress. Hence the measurements carried out so far have been designed to cover these ranges and to go beyond them where it is convenient to do so. Although some experiments in this programme have been for cold ice, most have been for ice at or near pressure-melting point; sliding in natural ice masses is probably much more important for pressure-melting conditions.
The velocities studied have been principally in the range from 1 to 105m a−1 which covers the range from normal, slowly moving glaciers to high-speed surging glaciers.
Experimental procedures
Types of rough slabs
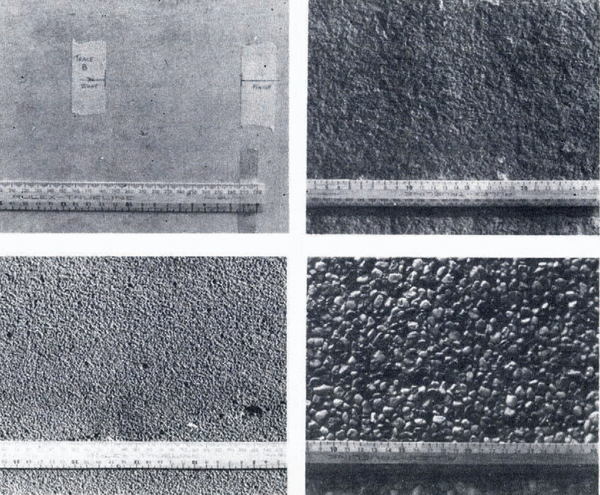
We found, as did Reference HopkinsHopkins (1849), that for high normal loads a smooth, polished marble surface offered negligible resistance to the sliding of melting ice. The smoothest cement surfaces of concrete slabs, however, were found to withstand shear stresses to 0.5 bar when the normal stress reached 20 bar. Hence, these were studied together with rougher slabs such as rough saw-cut granite, and an artificial slab made of pebbles embedded in concrete. An attempt was made with the rougher slabs to vary the wavelength and amplitude of the major asperities. Some of these slabs are illustrated in Figure 1. Linear one-dimensional elevation profiles were determined with profilometers using styli with radii from 0.025 to 0.25 mm. Some examples are given in Figure 2. Estimates of predominant wavelengths λ and amplitudes a for some typical cases are given in Table 1 together with derived values of λ/a, λ2/a, and λ3/a 2 which are relevant to some common sliding theories (Reference WeertmanWeertman, 1957. Reference Weertman1964; Reference LliboutryLliboutry, 1968, Reference Lliboutry1975; Reference NyeNye, 1969; Reference KambKamb, 1970). The sliding velocity for 0.3 bar shear, with 3.5 bar normal stress, as discussed below is also shown. Some sample “roughness” spectra calculated for three slabs are shown in Figure 3. The sizes of the slabs varied, but generally the surface of the slab was a rectangle with sides 0.5 to 1 m long.

Fig. 1. Photographs of four slabs used for the ice-sliding experiments: a (upper left) concrete slab (2) with a smooth cement finish; b (upper right) shale mudstone, with fine grain texture but rougher on the scale of about 10 mm; c (lower left) coarse-sawn volcanic rock, fine grained but with high roughness on the scale about 3 mm; d (lower right) pebble slab manufactured from closely packed smooth pebbles (about 5–10 mm) embedded in concrete. A scale rule marked in mm and cm is shown in each photograph.

Fig. 2. Slab profiles. Vertical elevation profiles are given for the slabs of Figure 1 plus a rough-sawn granite slab as obtained from a profilometer using a stylus tip with radius 0.25 mm. These are typical sample traces from much longer records taken from several lines along sliding directions. Each division on the vertical scale of this figure is equivalent to a distance of 0.5 mm. However, the vertical scale for the concrete slab is enlarged 20 times with respect to the others, and so each division for profile 5 is equivalent to 0.025 mm.
1, pebble; 2, coarse; 3, granite; 4, shale; 5, concrete (2).

Fig. 3. Some typical “roughness” power spectra are illustrated by plots of (a/λ)2 versus log λ where a and λ are the amplitudes and wavelengths of the Fourier components representing the line profiles of the slab surfaces.
Table I. Estimates of predominant wavelengths and amplitudes for the stone slabs

Sliding rigs
A number of different rigs were used in order to strike an acceptable balance between large normal loads and large contact areas. Three main types were as follows (see Fig. 4):
-
Single-block rig. A metal cover with sides 0.03 m high was placed over the top of a block of ice of approximate dimensions 0.1 × 0.1 × 0.05 m3 or 0.2 × 0.2 × 0.05 m3 to provide a platform with which to load the ice normally. An attachment point allowed the shear stress to be applied. With this system it was difficult to exceed a normal stress of three bar before load instability became a problem.
-
Table rig. In this case a large, rectangular table tray was constructed to a size of about 2 × 0.3 m2. Ice legs were placed so as to jut out from hollows in the table legs. A large plank was placed over the table and could be loaded with about two tonnes of lead. With a total ice-leg contact area of about 4000 mm2 this rig could produce a stress of about 50 bar. However, above 25 bar (roughly, the crushing strength of temperate ice) the unconfined legs did not last long enough for realistic tests. A confined ice-leg system was devised using “Teflon” (polytetrafluoroethylene) sleeves around the ice through which “Teflon” piston legs forced the ice out at the bottom into contact with the slab. With this system the full capacity of the rig could be utilized and tests have so far been carried out successfully up to 40 bar normal stress. A range of total contact areas from (1.3 to 7) × 103 mm2 are used.
-
Sledge rig. In this case two strips of ice 0.16 × 23 mm2 by 35 mm high were placed into parallel slots about 0.4 m apart in a solid rig which could then be loaded comfortably to about 0.35 tonne which gave a normal stress of about 5 bar. This system was used for making time-lapse movies of the sliding processes at the interface. It was also useful for studying ice flow over larger-scale irregularities than covered by the table-rig legs.

Fig. 4. Plan and profile sketches for the various sliding-rig configurations. The position of the ice is shown hatched. In each case the ice rests on the slab (in an ice–water bath) and is held by a metal frame on which a normal load is placed and a horizontal shear force is applied through a cable. For high loads with the table rig, “Teflon” sleeves around the ice were used, to prevent the ice collapsing, with the load being applied on the ice by “Teflon” pistons.
Apparatus configuration
The slabs were placed in ice–water baths and loaded with the ice rigs and weights for the normal load. Some experiments were carried out by tilting the slabs and measuring the angle to calculate the shear stress. These were found to give the same results as obtained by levelling the slabs and applying the shear direct through a horizontal cable from a load acting over a pulley. This latter system was generally used. For the table rig, two slabs and baths were used, with one each for the back and front pairs of legs to allow the full length of the slabs to be used. A large dial micrometer gauge could be set at the back of the rig to measure the displacement of the frame.
Limiting static shear
These types of tests are commonly used in engineering practice to determine the upper limit of the coefficient of friction μ s , which is defined as the ratio of shear stress, τ s to normal stress N required to induce acceleration from a stationary position,

The technique used here was to place the rig with the ice on slabs in ice–water baths and then to load them with lead in order to reach the required normal stress. Then, after some time to allow “seating” on the rough slabs, a horizontal shear stress was applied by means of a large spring balance which increased the force over a period of seconds until the rig started to move forward quickly. The maximum shear stress obtained is referred to here as the limiting static shear stress τ s . For large shear loads (≈ 100 kg) it was necessary to add weights to the shear line prior to applying the spring-balance force because shear stresses in excess of ten bars (400 kg for the table rig) were required.
Constant-applied-shear tests
For these experiments the rigs were loaded with the normally-acting load and allowed to seat. The shear load was then added by a system of weights on a cable over a pulley. The displacement of the rig was then measured as a function of time usually over a number of hours, depending on the velocity. For shear stresses small compared to the limiting static shear stress, steady velocities Vb resulted after some time. Acceleration tended to start for a limiting shear stress τ m which was in most cases considerably less than the limiting static shear stress τ S .
Constant applied velocity
The circular table system described by Reference BuddBudd (1976) was unsuitable for the very large load considered here. The geared drive was therefore modified to drive a winch system which pulled the rigs horizontally forward using cable and pulley. In this way, a wide range of velocities could be covered (1 to 105m a−1).
A large spring balance was inserted initially within the shear cable, but this was found to have too much displacement, which altered the velocity, so an engineering proving ring, which has a dial micrometer gauge to measure the force through small displacement, was used instead. The resultant shear stress was then monitored as a function of time.
Results
Limiting static shear stress
Only a summary of the major results is presented here. A detailed report is in preparation (Blundy, unpublished).
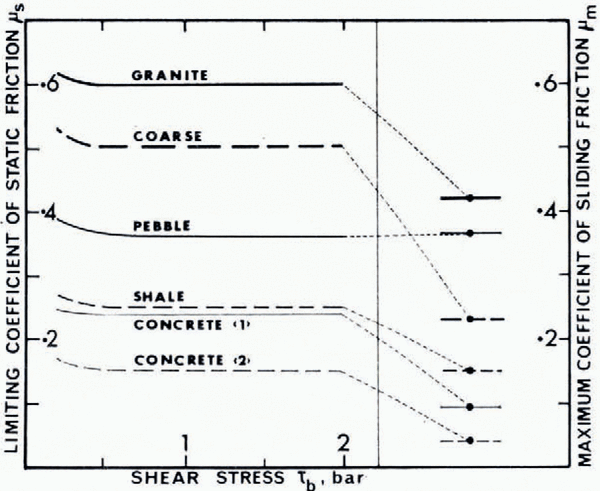
For a given rough slab the limiting static shear was found to be approximately proportional to the normal load. This establishes an effectively constant coefficient of limiting friction μs which is characteristic of each slab, as shown in Figure 5.

Fig. 5a Limiting static shear stress τs versus normal stress N for the different slabs is shown. The slopes of the straight lines define constant limiting coefficients of static friction μs.

Fig. 5b. The limiting coefficients of static friction for the various slabs shown to be constant with shear stress with values substantially higher (in all cases, except for the pebble slab) than the coefficients of limiting sliding friction obtained with the constant applied shear-stress tests.
These coefficients of static friction represent the maximum slope tan α for which temperate ice could be expected to remain in equilibrium on surfaces of these types. In many cases the limiting shear for acceleration in the constant-applied-load tests is less than τ s . The results shown here have also been found to apply for higher normal loads and for shear stresses up to eight bars, which approaches the limiting shear stress for temperate ice.
Constant-applied-shear stress
Following the limiting static shear tests a series of tests of the constant-applied-shear type were carried out for low normal loads up to five bar on slabs of different roughness. It was found that, for low shear stresses, steady velocities resulted which were proportional to the applied shear stress and inversely proportional to the normal load and the slab roughness (Fig. 6). Table 1 shows that the wide variation in velocities at a given stress is to be expected from an application of the simplest linear theory of Reference NyeNye (1969) for the predominant wavelengths present when regelation is neglected. Integrals over the whole roughness spectrum could also be used, but for such large variations in roughness from slab to slab, this makes little difference. For example, Reference NyeNye (1969) gives the following result for the viscous drag force F in the absence of regelation over a bed whose surface elevation z 0(x) (wavy in one dimension) has the spectrum |Z̄0(k)|2 for wave number k, as

where η is the ice viscosity, U is the sliding speed, and the bar denotes the Fourier transform. For a single sine wave of amplitude A and wave number k 0 the average drag shear stress, 〈τ xz 〉, is given by
It is necessary, however, to omit the very high frequencies for which (a/λ)2 may become very large. This is done to some extent for the analysis of the roughness by the profilometer through the choice of the stylus size, and in the sliding experiments by the lubrication of a water film with thickness of the order of one micrometre Reference Nye(Nye, 1973).

Fig. 6. Results of constant-applied-shear stress τb for normal stresses N = 3.5 bar (– – –) and 4.5 bar (—) using the concrete slab (1). A steady sliding velocity, Vb proportional to τb, resulted up to a maximum shear stress τm beyond which acceleration occurred. The transition tended to occur for approximately constant values of the product τmVb.
For all the slabs, acceleration became established for a limiting dynamic shear stress τ m which was generally well below τs. This was more apparent for the rough granite and coarse sawn slab than for the pebble slab.
Since the velocities increased most rapidly for the smooth slabs which also had the lower limiting shear stresses it meant that acceleration tended to set in for a fairly constant value of the product τ mVb , i.e. for acceleration
where c is a constant which, from these experiments, has the value 500 bar m a−1. This value is similar to that suggested by Reference BuddBudd (1975) for steady-state values separating surging from non-surging glaciers (which also corresponded to steady state). The value has a limiting value of ∝VZ where ∝ is the surface slope and Z the ice thickness.
Effect of normal load
For the high normal and shear stresses the linear relations with velocity no longer hold. The velocity tended to increase with the stress cubed and to decrease linearly with normal stress, i.e. for N > 5 bar

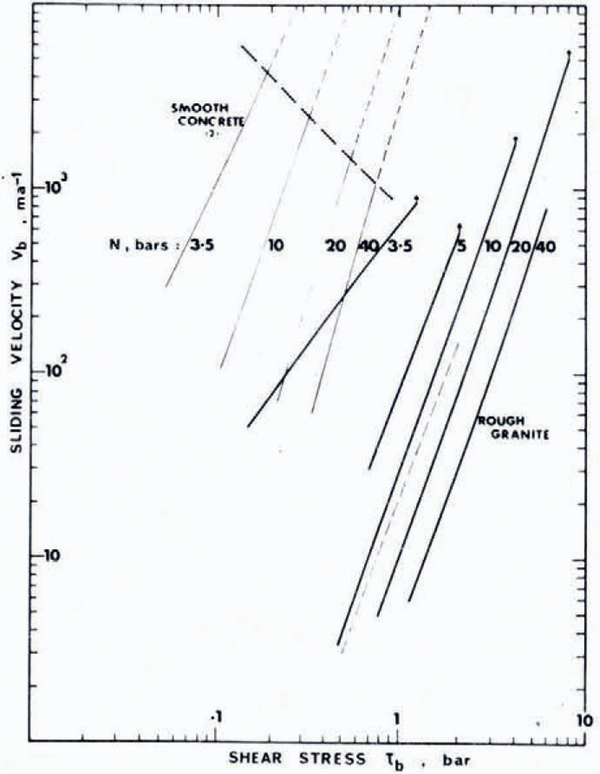
where k is a constant, dependent on roughness. The transition between the linear behaviour at low loads, and the cubic behaviour at high loads means that in the region of the transition the velocity drops much more rapidly with load. These features are illustrated in Figure 7 which shows the variation in velocity with shear stress and normal load for the smooth concrete and rough granite slabs. For the higher normal loads on the granite slab, the decrease in velocity for the onset of acceleration did not occur, and steady velocities occurred right up to a critical coefficient of friction of about 0.4. This result seems to be a consequence of an increasing collection of rock particles in the ice during the sliding as described below.

Fig. 7. Results of velocities Vbfor tests for constant-applied-shear stress τb for the smooth concrete and rough granite slabs for normal stresses N = 3.5 to 40 bar, as shown by plots of log Vb versus log τb. The thick dashed line indicates the onset of instability for which acceleration tended to set in whereas the thin dashed extensions to the lines indicate the velocities obtained prior to acceleration. For the granite slab the onset of acceleration was quite sharp and is indicated by the arrows at the ends of the lines.
The limiting shear stress was found to be a real limit by a technique using stroboscopic lighting, and photographing the displacement every 0.2 s. For the case of the ten bar normal stress on the rough granite, high acceleration set in beyond 4.2 bar. A slight increase in shear stress caused velocities of up to 2.8 × 10⁴ km a−1 by 0.4 s which represents a substantial acceleration for the large mass (400 kg).
The importance of normal load to viscous drag has not been incorporated in the common ice-sliding theories, but is well recognized in general sliding and lubrication studies Reference Bowden and Tabor(Bowden and Tabor, 1950–64). Reference LliboutryLliboutry (1964-65, Reference Lliboutry1968, Reference Lliboutry1975) has included an effect of relative normal load above the basal water pressure to give a resultant Coulomb-type friction law. Reference ReynaudReynaud (1973[a]) used this theory with success in connection with the cross-sectional flow of a glacier.
Constant-velocity tests
The work carried out so far with these tests has concentrated primarily on the development of techniques. The main problem encountered was that a steady shear stress was difficult to attain. Eventually this was overcome with the use of the proving rings, and a series of tests over various velocities and normal loads have been carried out.
Some examples of resultant shear stresses as a function of time are shown in Figure 8. At the beginning of each test there is a period during which the shear stress increases as the slack in the system is taken up and the rig begins to move. After this the shear stress tends to settle down gradually to a stable value. For example, with a normal load of 30 bar on a concrete slab there was found to be little change in shear stress from a velocity of six to ten kilometres per year. There is an increase of shear stress with normal load, but the relationship is not one of proportionality. This means the effective coefficient of sliding friction at constant velocity decreases with normal load. For example, with a velocity of ten kilometres per year the coefficients of friction for 10 bar was ≈ 0.09 and for 30 bar was ≈ 0.04. This was much the same at 13 km a−1.

Fig. 8. Results of some constant-applied-velocity tests for the smooth concrete slab (2), for normal stresses 10 and 30 bar, and velocities V = 6.3, 9.8, and 13.5 km a−1. After some time a steady shear stress results which tends to be constant with increasing high velocities. Although the shear stress is higher for the higher normal stress the coefficient of sliding friction μ is lower.
Erosion
It was noticed during the constant-shear tests at high loads on rough granite that particles of the rock had become embedded in the ice by the end of the experiment. This occurred in spite of a thorough surface cleaning prior to a test. Consequently, the particles were collected after the experiments and weighed, if they constituted a substantial amount. For low values of the normal stress, shear stress, or velocity, the amount of material was very small but this increased rapidly for higher values. The general results are shown in Table II.
Table II. Erosion from a rough granite slab by ice at the melting point

The data of Table II can be matched reasonably well by a relationship of the form
Since, from Equation (5),
the above relationship may be written
From the table the constant of proportionality is given from τ = 1 bar, N = 20 bar, and ɷ = 0.8 mm a−1.
Discussion
The primary aim of this paper is to present results, but a few comments on the implications for the sliding of real ice masses may be helpful.
1. The maximum slope for stable temperate real glaciers is about 35–40% (Reference KoechlinKoechlin, 1944; Reference BuddBudd, 1975). Since ice masses stay in place for long times it is the dynamic limiting shears and friction coefficients which are relevant. Of these only the pebble and granite slabs approach a sufficiently high friction coefficient.
2. Ice falls tend to set in for slopes greater than 40%, and sliding velocities tend to be high, that is, more than a few hundred metres per year, e.g. Mer de Glace (Reference ReynaudReynaud, 1973[b]) and Austerdalsbreen (Reference NyeNye, 1958).
3. The constant-load tests for the granite slab suggest low sliding speeds for thick glaciers with low shear stresses. Where buoyancy effects from basal water pressure are negligible, the normal stress N may be taken to be proportional to the ice thickness. If the ice thickness is Z and a cubic flow-law relation holds for the ice, then the total velocity V may be expressed as the sum of the deformational and sliding velocities as follows:
where c 1 and c 2 are constants.
For the granite slab we find c 2 ≈ 2.5 × 10³ m2 a−1 bar−3. From the analysis of Budd and Jenssen ([1975]), the following values may be taken for real glaciers:
From this, an expression for the sliding velocity as a proportion of the total velocity is obtained as
In particular ![]() . For temperate ice, if thicknesses are greater than this, internal deformation dominates, and for thinner ice, sliding dominates. For the above values, the ice thickness at the transition is about 173 m.
. For temperate ice, if thicknesses are greater than this, internal deformation dominates, and for thinner ice, sliding dominates. For the above values, the ice thickness at the transition is about 173 m.
4. The dependence of the sliding velocity on the third power of stress for high normal stress suggests that the controlling factor is ice deformation over the asperities rather than regelation. Reference WeertmanWeertman (1957) gives the following for the sliding velocity Vb which results from deformational drag with a power-law flow with exponent n as
where B is the flow-law constant, A is the height of the block obstructions, and λ is their spacing.
5. For a constant slope α the sliding rate would increase with thickness as
where ρ is the ice density and g the gravitational acceleration (again assuming no buoyancy effects).

6. The effective basal normal stress N ⋆ in real glaciers depends not only on the normal stress N due to the ice thickness but also on the buoyancy effect of the basal water pressure P (Reference LliboutryLliboutry, 1964–65, Reference Lliboutry1968, Reference Lliboutry1975; Reference WeertmanWeertman, 1972).
where ρw is the water density and h is the height above the base of the connected water table.
Measurements by Mueller and Iken (1973), Reference Boulton and VivianBoulton and Vivian (1973), Reference HodgeHodge (1976), and others indicate that the water table can be quite high (about 0.7Z), and can affect the sliding velocities, particularly in summer.
In the present experiments the normal stress should correspond to N ⋆. Since N ⋆ = 0 for h ≈ 0.9Z it is apparent from Figure 7 that a high water table could greatly increase sliding velocities. For example, with an ice thickness of Z ≈ 220 m (N ≈ 20 bar), if, with the water table Z⋆ ≈ 0.25Z (i.e. five bars), the velocity would increase from about 40 m a−1 to over 200 m a−1 for a shear stress of 1.5 bar. This could explain the large annual variations of some glacier velocities as, for example, recorded by Reference Boulton and VivianBoulton and Vivian (1973).
7. Fast-outlet polar glaciers often have their bases below sea-level. If the basal water is connected, again it is the effective normal stress, above the buoyancy stress, which is relevant as the normal stress. This could explain the low stresses and high velocities resulting for these glaciers.
8. A similar situation could apply to surging glaciers where the ice thickness, slope, shear stress, and basal water could build up together until the basal shear stress drops significantly below the down-slope stress in which case a thickening wave can move down-glacier with high sliding speed.
In the modelling of surges Equation (5) could be used for τb < τm (Z). For higher velocities the equation
could be used and the velocity derived from the longitudinal stress equation in a way analogous to the method adopted by Reference BuddBudd (1975). In this case, the condition of gross equilibrium would not have to be invoked.
Conclusions
The experiments carried out so far have determined ice-sliding velocities for the wide ranges of roughness, normal stress, and shear stress relevant to real glaciers. Although the contact areas were small and the roughness scales limited, a number of important results central to the foundations of a practical sliding theory were obtained.
First, a limiting shear stress exists, which is a function of roughness, normal stress, and velocity; beyond the stress limit, the ice accelerates. The sliding speed decreases with effective normal stress. The increase of sliding speed as the cube of shear stress as well as its decrease with increasing roughness suggests that the sliding for these experimental scales is more controlled by the ice deformation than regelation. The normal stress here can be expected to correspond to the normal ice stress in excess of buoyancy stresses in glaciers. Thus, increased buoyancy can increase sliding speed. Finally, it appears that the results presented here can provide the basis for a sliding theory which has relevance to the sliding of ordinary glaciers and also to ice falls, surging glaciers, and fast-outlet polar glaciers.
Discussion
J. Weertman: The accelerated sliding velocities that you observed are, I assume, a consequence of the fact that your bed spectrum is chopped off at large wavelengths. At the higher sliding velocities the ice rides on top of the bumps and the effective bed spectrum chops off the contribution of these wavelengths too. Thus no part of the spectrum can act as a brake to the sliding. The results of Barnes and others (1971) might be explained in the same way. Glacier beds are not likely to have a spectrum in which the large wavelength contributions are missing. Therefore, for glaciers the acceleration that you observe should normally be suppressed.
W. F. Budd: The ice can smooth the bed by filling the higher-frequency hollows with stagnant ice when the local shear-stress variations exceed the yield shear stress. Precisely the same effect should occur at the bed of glaciers over all scales. The viscous drag however for a sine wave of amplitude a and wavelength λ varies as a2/λ3 and so the amplitude of long waves would need to be very large to give comparable resistance. Nevertheless, if the local shear stress reaches the yield stress, then the ice would be expected to be sheared over in the hollows as with the smaller wavelengths.
B. Ladanyi: When an ice block slides over an irregular surface one component of the sliding resistance is due to the work done against the applied normal force when the system dilates during over-riding of asperities. This results in an increase in the total coefficient of friction at small stresses and displacements as you have actually shown in one of your figures. Did you observe any sign of vertical dilation or contraction in your tests?
Budd: During the tests the ice did tend to spread out under the high normal stress, but with the piston system for the confined samples the load was restricted to a limited area.
L. A. Lliboutry: I question your conclusion that a sliding proportional to τ 3 must proceed from a plastic process. For such small wavelengths and high sliding velocities Andrade’s transient creep should prevail. Since γ ≈ U/a and t ≈ λ/U,
Budd: The fact is that the velocity does increase as τ3 for high normal loads. This could be explained by the formula for viscous drag over a wave of amplitude a and frequency ω: τb ∝ 2ηa
2ω3
V
b, where η is an effective viscosity given by ![]() , with τ0 the octahedral shear stress.
, with τ0 the octahedral shear stress.
If the shear stress τ
b is the dominant stress then ![]() , with n = 3, for minimum strain-rates or maximum stress.
, with n = 3, for minimum strain-rates or maximum stress.
C. F. Raymond: You find a transition from stable to unstable slip which is correlated with τb Vb . Do you interpret this to arise as a result of production of water at the contact? If so, might one expect the onset of unstable slip and subsequent behaviour to depend on sample size for small samples, because of the proximity of edges to which water can flow?
Budd: So far no significant effect of sample size has been found for the surfaces given here. The calculated water film is very small compared to the asperity sizes. The lubrication effect associated with τb Vb could be due to many factors including increased water production, mechanical shearing of the ice, and softening of the ice through internal water production at high stress concentrations around the asperities. More work on the extension of the experiments to larger contact areas should be done.
B. Hallet: Do you know how much your ice samples melt during the experiment? Do you have any temperature measurements near the interface?
Budd: Not exactly, but the loss from frictional heating can be calculated. Other losses of the ice can include mechanical yield shearing of the ice around asperities, and spreading under high normal loads. Temperature measurements have been made in the ice near the interface which indicate temperatures very close to the pressure-melting point.
R. H. Thomas: Is it possible that, at the roughness scale that you study, you are looking at the regelation-controlled region of the sliding law?
If your ice samples are unconfined laterally then the stresses due to the overburden will not be hydrostatic; could this produce a pseudo-viscous behaviour?
Budd: Pressure melting can take place, but the water is largely squeezed out before refreezing. Consequently it seems that non-linear viscous drag for ice at the melting-point is the controlling factor. The results for the confined and unconfined samples for low stresses were found to be similar so that the point is not considered to be important. One may expect similar conditions of non-hydrostatic stress to occur in some locations under glaciers also.