


Introduction
Existing ideas concerning behavior of subglacial meltwater are largely theoretical, based on mathematical examinations of englacial and subglacial hydraulics and observations from temperate and sub-polar glaciers. Because of the vast extent and thickness of ice in Antarctica, direct observations have been limited, causing the exact nature of subglacial meltwater contained in the Antarctic ice sheet to remain ambiguous. It is accepted that subglacial meltwater plays a significant role in the stability of ice sheets and glaciers. It affects basal sliding velocities over hard beds (Reference WeertmanWeertman, 1964; Reference LliboutryLliboutry, 1979; Reference BindschadlerBindschadler,1983) and contributes to basal sediment-deformation processes involved in ice streaming (Reference Boulton and JonesBoulton and Jones, 1979; Reference Alley, Blankenship, Bentley and RooneyAlley and others, 1986; Reference Alley, Blankenship, Bentley and RooneyAlley and others, 1987a; Reference Boulton and HindmarshBoulton and Hindmarsh, 1987). Since stability of the West Antarctic ice sheet (WAIS) has been questioned (e.g. Reference Stuiver, Denton, Hughes, Fastook, Denton and HughesStuiver and others, 1981; Reference Mac AyealMacAyeal, 1989; Reference Alley and WhillansAlley and Whillans, 1991; Reference HughesHughes, 1996; Reference BindschadlerBindschadler, 1997; Reference OppenheimerOppenheimer, 1998; Reference Scherer, Aldahan, Tulaczyk, Possnert, Engelhardt and KambScherer and others, 1998), it seems necessary to gain a more complete understanding about the amount and behavior of subglacial meltwater beneath the ice sheet.
Several theories on distribution of subglacial meltwater in Antarctica have been proposed. It has been described as a thin film just beneath the ice (Reference WeertmanWeertman, 1972), as flowing channelized meltwater systems (Reference Hughes, Denton and HughesHughes, 1981) and as part of a porous subglacial till layer that deforms and facilitates ice streaming (Reference Blankenship, Bentley, Rooney and AlleyBlankenship and others, 1986; Reference Blankenship, Bentley, Rooney and AlleyBlankenship and others, 1987; Reference Rooney, Blankenship, Alley and BentleyRooney and others, 1987). This mechanism has gained acceptance, for such a till layer has been sampled beneath Whillans Ice Stream (formerly Ice Stream B) in West Antarctica (Reference Engelhardt, Humphrey, Kamb and FahnestockEngelhardt and others, 1990). It has also been sampled and mapped on the Ross Sea continental shelf, which was occupied by formerly expanded ice sheets (Reference Domack, Jacobson, Shipp and AndersonDomack and others, 1999; Reference Shipp, Anderson and DomackShipp and others, 1999). It is becoming evident that sedimentary substrates are required for the presence of a deforming till layer (Reference Anandakrishnan, Blankenship, Alley and StoffaAnandakrishnan and others, 1998; Reference BellBell and others, 1998; Reference Tulaczyk, Kamb, Scherer and EngelhardtTulaczyk and others, 1998; Reference Anderson, Wellner, Lowe, Mosola and ShippAnderson and others, 2001; Reference Blankenship, Alley and BindschadlerBlankenship and others, 2001; Reference Wellner, Lowe, Shipp and AndersonWellner and others, 2001). However, the entire area beneath the Antarctic ice sheet is not strictly composed of sedimentary basins. Ice grounded far inland rests on older, more indurated strata and crystalline bedrock. In those locations, subglacial meltwater must behave differently.
Observations of meltwater behavior over less permeable beds in the Antarctic subglacial environment are few. Channels and potholes incised into both surficial sediments and underlying bedrock have been identified in the Quartermain Mountains flanking the Dry Valleys (Reference Denton, Prentice, Kellogg and KelloggDenton and others, 1984; Reference Sugden, Marchant and DentonSugden and others,1990). The features were used as evidence that one or more late Tertiary ice sheets overrode the DryValleys region. Reference Sugden, Denton and MarchantSugden and others (1991) investigated the channels in more detail and concluded that they represent a subglacial meltwater drainage system cut by sudden outbursts of meltwater beneath a locally warm-based zone within a predominantly cold-based ice sheet.
At least one freely flowing meltwater outburst has been witnessed near Law Dome in East Antarctica. Reference GoodwinGoodwin (1988) described a jökulhlaup event lasting 6 months. It was followed by sporadic outbursts during the austral autumn and winter of 1986. Evidence from subglacial topography, basal-ice exposures and sedimentology of a nearby supraglacial moraine were used to suggest that meltwater was supplied by an ice-marginal subglacial reservoir of water.
Even though examples of freely flowing basal meltwater in Antarctica have rarely been documented, copious amounts of subglacial meltwater appear to be ponding beneath the ice. Reference Robin, Swithinbank and SmithRobin and others (1970) first identified Antarctic subglacial lakes with radio-echo sounding techniques. More recently, satellite altimetry in combination with radio-echo sounding data were used to locate additional lakes and to calculate the total volume of water held beneath the Antarctic ice sheet in subglacial lakes. Reference Dowdeswell and SiegertDowdeswell and Siegert (1999) estimated that 4000–12 000 km3 of water is held in about 77 lakes. This indicates that a significant amount of meltwater is indeed located at the base of the ice. Such a wide distribution suggests that this water must interact with a variety of substrate conditions.
Geomorphic and sedimentologic observations on the continental shelf in Pine Island Bay reveal an organized meltwater regime unlike those surveyed in other areas of the Antarctic continental shelf. This suggests that the amount of meltwater draining into Pine Island Bay has been significant in the past.
Study Area
Pine Island Bay is located in the Amundsen Sea in the Southern Ocean (Fig. 1). It is bound to the east by the Hudson Mountains and Ellsworth Land and to the south by Marie Byrd Land. These two sectors are divided by a deep, narrow trench occupied by Pine Island Glacier in the southeast portion of the Bay. Pine Island Bay is bordered to the west by Thwaites Glacier and to the north byThurston Island (Fig. 1).
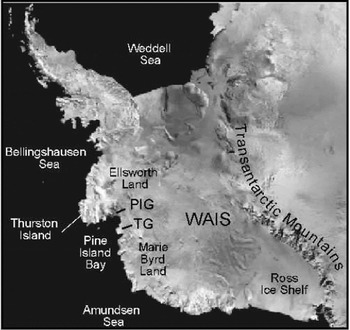
Fig. 1. Satellite image of Antarctica (http://TerraWeb.wr.usgs.gov) showing location of Pine Island Bay and major geographic boundaries of the study area (WAIS, West Antarctic ice sheet; PIG, Pine Island Glacier;TG,Thwaites Glacier).
Pine Island and Thwaites Glaciers represent two ice streams that drain a significant portion of the interior of West Antarctica. The Antarctic ice sheet has an area of 13.6 × 10⁶ km2 of ice, of which 200 000 km2 are drained by Pine Island Glacier (Reference Crabtree and DoakeCrabtree and Doake, 1982). This is approximately 4% of the outflow from the entire Antarctic ice sheet (Reference Vaughan, Alley and BindschadlerVaughan and others, 2001). The glaciers have been suggested to be sensitive to climatic warming, and thus potential triggers for collapse of the entire WAIS because the floating terminus of the ice sheet in Pine Island Bay may be unstable (Reference ThomasThomas,1979; Reference Hughes, Denton and HughesHughes, 1981).
Recent data, documenting extreme variability in ice-flow behavior, support a hypothesis of instability near Pine Island Bay. Variations in surface mass balance may be responsible for negative surface-elevation changes in the Pine Island and Thwaites Glacier basins (Reference Wingham, Ridout, Scharroo, Arthern and ShumWingham and others, 1998), even though the basins receive considerable precipitation (Reference Vaughan, Bamber, Giovinetto, Russell and CooperVaughan and others, 1999). Satellite imagery indicates high ice-flow velocities for both Pine Island and Thwaites Glaciers (Reference Ferrigno, Lucchitta, Mullins, Allison, Allen and GouldFerrigno and others, 1993; Reference Lucchitta and RosanovaLucchitta and Rosanova, 1997). Radar images have been interpreted to indicate that the glaciers are retreating at an accelerated rate (Reference RignotRignot, 1998; personal communication from E. Rignot, 1999), and satellite altimetry and interferometry show that the grounded portion of Pine Island Glacier is thinning at 1.6 m a−1 (Reference Shepherd, Wingham, Mansley and CorrShepherd and others, 2001). The rapid recession of Pine Island Glacier has been attributed to high melt rates caused by an influx of circumpolar deep water interacting with the base of the glacier (Reference Jacobs, Hellmer and JenkinsJacobs and others, 1996). Although the Pine Island Glacier ice front has been stable for several decades, only half of the ice that crosses its grounding line calves as icebergs. The rest melts at the base of the ice at up to 12 m a−1 (Reference Jenkins, Vaughan, Jacobs, Hellmer and KeysJenkins and others, 1997; Reference Hellmer, Jacobs, Jenkins, Jacobs and WeissHellmer and others, 1998).
Methods
Data were collected aboard the RV/IB Nathaniel B. Palmer during the 1999 austral summer (cruise NBP9902) along a major glacial trough within Pine Island Bay. The dataset includes multibeam swath bathymetry, deep-tow side-scan sonar records and seismic data. These combined techniques yield sea-floor imagery ranging in scale from meters to kilometers in area. Swath bathymetry data were collected with a SeaBeam 2100 hull-mounted system and consisted of 120 beams of 12 kHz data. Data editing involved removal of anomalous beams. Processing included gridding and displaying the data in shaded relief maps. Side-scan sonar data were collected with a DataSonics SIS 1000 deep-tow apparatus and recorded features at a smaller scale (<10 m). Intermediate-resolution seismic data were acquired to map the extent of acoustic basement and sedimentary deposits. The seismic data were collected with a 210 in3 GI air gun and a single-channel streamer. The data were recorded with an Elics seismic acquisition system and band-pass filtered. The resolution of these data is on the order of 10 m. Chirp (3.5 kHz) subbottom profiles, collected with a Bathy 2000 deep/shallow water echo-sounder system, imaged fine-scale stratification (decimeter resolution) in the sediments.
Finally, piston cores provide information about the physical properties of the sediments in order to establish a depositional environment and to deduce depositional processes associated with geomorphic features. Piston cores penetrated to a maximum subbottom depth of 4 m. The cores were opened, photographed, X-radiographed, and analyzed with a multi-sensor core scanner at the Antarctic Research Facility at Florida State University. This included measurements of magnetic susceptibility and attenuated gamma counts. Cores were described on the basis of color, grain-size, texture, sorting and mineralogical changes in stratigraphic units. Shear-strength measurements were made using a Boart Longyear torvane. For some samples, the micropaleontological content (mostly foraminifera) was collected and radiocarbon-age dated. Detailed mineralogy was obtained through X-ray diffraction analyses of the clay fraction (<4 μ) of certain samples. Analysis of the data followed Reference AndersonAnderson’s (1999) summary of sedimentological and seismic criteria for defining deposits that occur on the Antarctic continental shelf.
Results
Bathymetry
Bathymetry of the continental shelf in Pine Island Bay changes from an extremely rugged inner shelf with relief on the order of 600 m in water depths > 1000 m, to a smooth outer shelf averaging 400 m depth. The boundaries of a glacial trough were mapped using multibeam swath bathymetry (Fig. 2a). The trough is narrow and deep on the inner shelf (Fig. 2b), but broadens as it extends onto the shallower outer shelf. A seismic profile collected down the axis of the trough shows that the inner shelf and most of the middle shelf are characterized by exposed crystalline bedrock, exhibiting irregular surface topography and a chaotic seismic facies (Fig. 3a). Further offshore, the surface is buried by seaward-dipping strata, which toplap against an erosional unconformity (Fig. 3a). These packages of strata are foredeepened across the length of the shelf and are progressively buried by seaward-thickening aggradational strata interpreted to be unconsolidated Plio-Pleistocene sediments (Reference Lowe and AndersonLowe and Anderson, 2002). A single, amalgamated sea-floor unconformity ties all of the sequences together and stretches across the length of the trough. It truncates the landward end of reflectors within the sedimentary units. North of Burke Island, a sedimentary wedge comprised of prograding sequences of layered and chaotic deposits overlies the seaward-dipping strata (Fig. 3b). The wedge is ∼42 km long and up to 70 m thick and is situated on top of the amalgamated unconformity.
Fig. 2. Bathymetry of Pine Island Bay continental shelf showing: (a) glacial trough and the shelf break; (b) rugged topography of the inner shelf with 200 m contour interval. Contours of the deepest portions of the shelf are shaded, from light gray (1200 m) to dark gray (1600 m); dashed contours show where bathymetry was inferred.

Fig. 3. Portions ofa seismic profile collected down the axis of the glacial trough in Pine Island Bay showing: (a) substrate transitions from exposed crystalline bedrock to seaward-dipping strata; (b) offshore, younger, aggradational sedimentary deposits and a sedimentary wedge on the middle shelf that buries the strata.The locations of the two lines are shown in Figure 4.
Geomorphology and sedimentology
Geomorphic landforms and sedimentary deposits have been identified within the trough, and these features appear to fall into five distinct zones (Fig. 4). The zones are based on morphology and distribution of landforms, as well as basal surface conditions.

Fig. 4. Map of Pine Island Bay showing boundaries of five geomorphic zones used in this study (solid lines; labeled Z1–Z5) and substrate transitions (dashed lines).The hatched pattern on the middle shelf shows the approximate location of the grounding-zone wedge.The glacial trough (600 m contour line) is shown for reference. Locations of multibeam, side-scan sonar and seismic images used in this paper, and core locations for the data in Figures 5–9, are shown.
Zone 1
Zone 1 includes the landward-most area of the inner shelf, where crystalline bedrock is exposed at the sea floor. The most prominent features are deep channels and cavities, which contribute to the rugged nature of the shelf topography. The channels occur as three types. The largest and deepest channels are up to 15 km long, 2 km wide and occur in water 1400–1700 m deep (Table 1). They cross-cut features trending in the direction of ice flow (grooves and megascale glacial lineations) and wind around bathymetric highs to connect with other channels (Fig. 5a and b), typical of tunnel-valley behavior (Reference Benn and EvansBenn and Evans, 1998). A second type of channels occurs as sets within cavities. These groups of channels form an anastomosing relationship with each other and follow the length of the cavities in which they are situated rather than ice-flow direction (Fig. 5c). They vary in size, from 2–14 km long and 0.2–1 km wide (Table 1). The final type of channel exists on tops of bedrock highs and forms linear paths (Fig. 5c). They typically form direct pathways between cavities and channels, but sometimes crosscut one another as well. These smaller-scale channels are 1–10 km long and 0.5–1 km wide. They are incised 200–400 m deep into the crystalline bedrock (Table 1).
Table 1. Dimensions of geomorphic features identified on the continental shelf of Pine Island Bay.The substrate upon which the features formed is also listed


Fig. 5. Sea-floor imagery from zone 1 showing subglacial geomorphic features formed on exposed crystalline bedrock. Multibeam swath bathymetry data show: (a) features such as deep tunnel valleys, cavities and p-forms; (b) transverse p-forms, such as sichelwanne, which also occur in zone 1; (c) other types of meltwater channels, including anastomosing channels within cavities and linear channels on bedrock highs; and (d) similar, smaller-scale features observed with deep-tow side-scan sonar imagery. Profile channels a and b are side-scan images showing grooves and p-forms. Profile channel c is a corresponding deep-tow subbottom chirp profile. Sediment cover is thin to absent and occurs as a patchy drape.
The other major features in zone 1 are large cavities, all of which occur in > 1000 m of water. The shapes of cavities vary, with channels emptying into them from all sides. The cavities are situated oblique to large channels in the lee sides of obstacles (Fig.5b and c) or as linear continuations of deep tunnel valleys (Fig. 5a).
Secondary landforms identified in zone 1 include streamlined erosional features such as large-scale bedrock drumlins and p-forms. These features tend to show incision around their heads and appear to be smooth and polished (Fig. 5a, b and d). They vary in size from 0.04–2 km long and can be up to 200 m high (Table 1). These are always oriented parallel to the axis of the trough and ice-flow direction. Occasionally, transverse p-forms such as sichelwanne and comma marks occur. They are wide (up to 5 km) features that taper on their downstream ends (Fig. 5b). Grooves and furrows that are 5–1000 m long are formed on the flanks of troughs and on bedrock highs (Fig. 5b and d). Gouge marks can also be seen on some bedrock flanks and highs (Fig. 5a and b).
Zone 2
The portion of the trough on the middle shelf that is floored by bedrock makes up zone 2 (Fig. 4). Here, geomorphic features are not as large and are oriented in a more uniform direction. Channels remain prominent; however, they are aligned parallel to each other and to the axis of the trough (Fig. 6). The channels are up to 5 km long and 0.2–3 km wide (Table 1). They exhibit less relief than the channels of zone 1, with a maximum of 200 m. Streamlined features, such as bedrock drumlins, occur on the channel floors, with deep incision evident around the drumlin heads (Fig. 6). Rare, but deep, comma marks are also identified in zone 2, as are gouges (Fig. 6). There are no cavities in zone 2.

Fig. 6. Multibeam swath bathymetry from zone 2 showing aligned channels and p-forms.
Cores from zones 1 and 2 are similar and feature two dominant sedimentary units (Fig. 7). The uppermost deposit is a brown to olive-gray clay containing rare dropstones. Occasionally, there is enough fine-grained silt composition for the unit to be described as a silty clay. The clays all have low (0.02 kg cm−2 or 2.0 kPa), to no measurable, shear strengths. Magnetic-susceptibility measurements are low, due to lack of sand content. Rare microfossils were found within the clays, and the assemblage is mainly composed of arenaceous foraminifera. Inner-shelf cores from an earlier cruise, Deep Freeze 85 (DF-85), collected along the eastern margin of the bay also recovered very fine-grained sedimentary units, described as a muddy silt (Reference Kellogg and KelloggKellogg and Kellogg, 1987a).

Fig. 7. Descriptions and photographs of three cores collected in zones 1 and 2. NBP9902 PC40 showing a diamicton separated by clay deposits. Cores NBP9902 TC46 and NBP9902 PC46 show a well-sorted deposit grading from coarse cobbles to clays. A clay rip-up clast is seen between 50 and 65 cm in NBP9902 PC46.
Recovered thicknesses of the entire clay deposit range from 30–450 cm, with the thickest recoveries occurring within close proximity to the present-day ice front. Chirp subbottom data collected with the deep-tow side-scan apparatus show that the sea-floor deposit probably exists as a drape over the exposed crystalline bedrock, with a thin sediment layer apparent on obstacle flanks and between bedrock highs (Fig. 5d).
The second unit in zones 1 and 2 is a soft, brown diamicton with a silty clay matrix (Fig. 7). The coarse fraction of the diamicton is poorly sorted and angular, consisting of a mix of granite, mica schist, quartz and orthoclase feldspar pebbles. Shear strengths are low (0.03–0.05 kg cm−2 or 3.0–4.9 kPa), and magnetic susceptibility readings vary (250–700 cgs or 0.003–0.009 × 10⁻⁶ SI units). Microfossils are rare, but when found represent a mix of planktonic and benthic foraminifera. In three separate cores, at least one second clay unit was found beneath the silty unit (Fig. 7). The older clay is identical in all properties to the younger clay. Mineralogical composition of the clays and the clay fraction of the diamicton were determined with X-ray diffraction analyses and shown to be identical (Reference Lowe and AndersonLowe and Anderson, 2002). The samples consist of > 90% phyllosilicate minerals, mainly illite and a mixed-layer illite/smectite.
One core taken within a particularly rugged portion of zone 1 shows graded sands and gravels, with pebble- to cobble-sized grains grading to very fine sand over 1.5 m (Fig. 7). The trigger core sampled a surficial clay unit typical of the sea-floor deposits already described. Out of 12 cores collected in 1999 from the area of exposed crystalline bedrock, only one is longer than 2.5 m, and it was fairly washed. Complete recovery was rare in zones 1 and 2, and often the cutter nose was gnarled and scratched with a small amount of loose gravel inside.This suggests that the cores may have encountered an impenetrable gravel layer.
Zone 3
Zone 3 begins at the exact position where the bed changes from crystalline bedrock to seaward-dipping strata (Fig. 4). The trough begins to widen in zone 3, depths decrease and relief of glacial features is limited to at most 50 m. The only geomorphic features in zone 3 are mega-scale glacial lineations and flutes, as well as some grooves and gouges near Burke Island. The mega-scale glacial lineations are at least 3 km long and 15–30 m high (Fig. 8). They parallel each other and the trough, but are occasionally cross-cut by irregular iceberg-furrow paths.

Fig. 8. Multibeam swath bathymetry data showing geomorphic features that distinguish zones 3 and 4. Zone 3 is characterized by mega-scale glacial lineations, while iceberg furrows identify zone 4.The dashed line indicates the transition between the two zones.
Only two cores were collected in zone 3. They recovered identical successions of deposits. The succession includes a thin, upper unit of stratified grayish-brown sandy silt overlying a gray sand containing a concentration of gravels and pebbles at its base. The micropaleontologic assemblage consists of mainly planktonic foraminifera, and a few (three species) of benthic foraminifera. These units cap a dark gray, stiff diamicton composed of poorly sorted subrounded grains with large dropstones.The lower unit is only 50 cm thick and massive. The mineralogical composition in the lower diamicton ranges widely, but is predominately quartz and orthoclase feldspar, with minor amounts of mica schist and heavy minerals. The diamicton is stiff, recording high shear strengths up to 0.2 kg cm−2 (19.6 kPa) and a steady magnetic-susceptibility curve that varied only slightly from 50 cgs (0.0006 × 10⁻⁶ SI units). Descriptions of the cores from the eastern margin of Pine Island Bay indicate that a thin (0–15 cm) layer of sandy mud with abundant dropstones overlies a compact, non-sorted diamicton (Reference Kellogg and KelloggKellogg and Kellogg, 1987b), similar to descriptions of zone 3 cores.
Zone 4
The geomorphic features of zone 3 are interrupted just north of Burke Island by a bathymetric high (640–680 m deep) approximately 20 km long. On this high, only randomly oriented iceberg furrows exist (Fig. 8). The high corresponds to the location of the sedimentary wedge mapped with seismic data (Fig. 3). At the seaward boundary of zone 4, the mega-scale glacial lineations of zone 3 re-emerge. Chirp subbottom data show a change in surface character from zone 3 to zone 4. On the lineated surface, it is very smooth, but becomes more irregular on bathymetric highs of zone 4.The furrows occur in water depths < 700 m. The reappearance of zone 3 is short-lived due to the shallowing nature of the shelf as it extends seaward. Once shelf depths reach 700 m, the furrows from zone 4 dominate the geomorphic character of the outer shelf (Fig. 4).
The sedimentary wedge, identified on the seismic profile (Fig. 3), characterizes the shallow stratigraphy of zone 4. Cores collected from zone 4 recovered a homogenous dark-grayish brown sandy diamicton with numerous dropstones. The mineralogical content is extremely varied, containing quartz, orthoclase feldspar, plagioclase, granite, sandstone, chlorite and biotite mica. The shear strengths of this deposit are variable, ranging from 0.01–0.07 kg cm−2 (1.0–6.9 kPa). Magnetic susceptibility varies as well, ranging from 100–128 cgs (0.001–0.002 × 10⁻⁶ SI units) over the length of the cores.The massive deposits are up to 2 m thick, and contain both planktonic and benthic foraminifera. Unpublished data from cruises DF-85 and Deep Freeze-81 (DF-81) show that cores from the outer shelf sampled homogenous compacted diamictons with no visible stratification and shear strengths in excess of 0.25 kg cm−2 (2.5 kPa).
Zone 5
Zone 5 actually occurs seaward of the shelf break. On the slope, gullies are imaged by swath bathymetry (Fig. 9). Gullies are submarine valleys carved in the continental slope. The features in Pine Island Bay are 2–10 km long and incised 100–250 m deep (Table 1). Five cores were collected during DF-81 on the slope of Pine Island Bay. These cores contain a range of deposits, but primarily consist of olive-gray mud with abundant pebbles of varying composition and size. Two of the cores from the lowermost continental slope contain pebbly sands and moderately sorted sands (Reference CassidyCassidy, 1983).

Fig. 9. Multibeam swath bathymetry showing gullies offshore of the shelf break in zone 5.
Organization of Subglacial Meltwater
Bedrock substrate
Landforms described in zone 1 comprise a suite of features attributed to subglacial erosional processes characterized by a combination of glacial erosion and freely flowing meltwater over impermeable crystalline bedrock. A channel system exists on the sea floor. The age of the channel system is unknown, as it is formed in crystalline bedrock. The scale of the features suggests they formed over many glaciations. It is believed that West Antarctica has been glaciated since the middle Miocene (Reference AndersonAnderson,1999), providing ample time for the features to achieve their great size and depth.
The channels exhibit characteristics typical of channels formed by meltwater, including steep walls, linear and sinuous valleys and abrupt blind terminations (Figs 5 and 6; Reference O CofaighO Cofaigh, 1996; Reference Benn and EvansBenn and Evans,1998).The channels occur in conjunction with bedrock cavities and form an arborescent pattern with smaller-scale channels linking cavities and larger channels together. Reference Brennand and ShawBrennand and Shaw (1994) suggest a branching pattern argues for fluvial rather than glacial origin and branching is often documented in regions where glacial drainage is through subglacial meltwater-channel systems (e.g. Reference Walder and HalletWalder and Hallet, 1979; Reference Boyd, Scott and DoumaBoyd and others, 1988; Reference PiotrowskiPiotrowski,1994; Reference PairPair, 1997; Reference Clayton, Attig, Mickelson, Mickelson and AttigClayton and others, 1999). It should be noted that these documented systems are much smaller in scale than the features presented here.
At a local scale, bedrock geology can influence channel orientation (Reference Booth and HalletBooth and Hallet, 1993). Subglacial meltwater flow is primarily controlled by ice-surface gradient, but tends to favor topographic lows or structural weaknesses, especially on rugged valley floors (Reference ShreveShreve,1972); therefore, it is plausible that meltwater made use of pre-existing valleys, faults and less-resistant bedrock.The occurrence of channels within cavities and the orientation of the channels on bedrock highs, appear to follow a structural grain inherent in the bedrock (Fig. 5a and c).
The floors and flanks of tunnel valleys exhibit separate features, which may be related to subglacial meltwater distributed across the bed. Bedrock drumlins and large-scale p-forms are identified in zone 1 (Fig. 5). Previously documented examples of such features (e.g. Reference Shaw, Kvill and RainsShaw and others, 1989; Reference Kor, Shaw and SharpeKor and others, 1991; Reference Benn and EvansBenn and Evans, 1998) are 1–2 orders of magnitude smaller than those in Pine Island Bay. Our interpretation is based on the similarities in shape with documented features and their association with channels. Although the mechanism of formation for such features is debatable, one explanation is that they form by glaciofluvial erosion associated with turbulent meltwater flow (Reference Shaw, Kvill and RainsShaw and others, 1989; Reference ShawShaw, 1994). Comma marks and sichelwanne are traditionally described as p-forms, implying formation by abrasion beneath plastically deforming ice. However, their occurrence in a wide range of shapes and sizes indicates that they originate by a variety of glacial and fluvial erosional processes (Reference Benn and EvansBenn and Evans,1998). Reference Kor, Shaw and SharpeKor and others (1991) classified these and other classic p-forms as s-forms (sculpted forms). They are differentiated from p-forms because they form by a turbulent viscous medium instead of a plastic medium (Reference Kor, Shaw and SharpeKor and others, 1991). Longitudinal and transverse p-forms may be bedrock erosional features caused by vortices linked to turbulent fluids flowing around obstacles. There is a particularly strong case when such features occur together with anastomosing channel systems and other evidence of subglacial meltwater.
Similar, but smaller, features occur in broad distributions with meltwater-channel systems in Ontario, Canada, and are linked to rapid release of sheet floods causing complete ice–bed separation (Reference ShawShaw, 1988; Reference Sharpe and ShawSharpe and Shaw, 1989; Reference Kor, Shaw and SharpeKor and others, 1991). The scale and integration of the anastomosing channel system with streamlined landforms in Pine Island Bay suggests contemporaneous operation and necessitates catastrophic discharges (Reference WrightWright,1973; Reference Boyd, Scott and DoumaBoyd and others, 1988; Reference Shaw, Kvill and RainsShaw and others, 1989; Reference Brennand and ShawBrennand and Shaw, 1994); however, the immensity of the channel system also implies that such discharges were not sustainable for long periods. Therefore, it is more appropriate to suggest that certain meltwater features in zone 1 were probably formed by many, short-lived catastrophic outbursts of subglacial meltwater and any ice–bed decoupling occurred only locally in the vicinity of the channels.
Other geomorphic features have been identified, and these are associated with glacial erosion. The deep cavities mapped in zone 1 occur in an area where the glacial trough converges on the shelf (Fig. 2). The cavities show evidence of glacial erosion (grooves and gouges), but also contain subglacial meltwater features described above. Their shapes resemble the fjords on the west coast of Norway, which are also carved into bedrock. Reference HoltedahlHoltedahl (1967) attributes the formation of Hardangerfjord and Sognefjord to glacial erosion, with the deepest portions forming in locations related to confluence of glacial drainage patterns. This appears to be the case in Pine Island Bay as well. Subglacial meltwater features are also observed in Norway and meltwater flow is noted to be an important factor in the formation of the fjord-dominated landscape of the region (Reference HoltedahlHoltedahl, 1967).
Grooves and gouges are evident on channel floors, on bedrock highs and on the floor of some cavities (Fig. 5). Some are crescentic shaped, but most are parallel to ice flow. Even though meltwater flow was an important erosional mechanism in zone 1, erosion by ice played an active part as well.
The geomorphic evidence provided by meltwater regimes just described suggests the following scenario for zone 1. Glacial erosional features such as grooves, furrows and gouges indicate ice was directly in contact with the crystalline bedrock of the inner shelf. Where glacial ice was thickest, cavities developed in a way similar to fjord formation. However, the rugged topography of the shelf, along with an abundant amount of meltwater, resulted in the formation of a meltwater-channel system. During events of high discharge, more complete ice–bed separation may have initiated locally, and catastrophic release of meltwater-formed p-forms and bedrock drumlins within the channels. Ice-erosional features could still form on bedrock highs between the channels. Due to the size and scale of the features, such extreme discharge events would not have been continuous, and once meltwater was evacuated, ice regained contact with the floor of the channels.
Subglacial meltwater influence appears to have been focused in parallel tunnel valleys in zone 2 in contrast to the branched character of channels in zone 1. There are several possible explanations for the noted difference between the two geomorphic zones. If both zones were active concurrently, zone 2, because it is more distal, would have been overlain by the downward-sloping profile of theWAIS. The higher surface slope would have produced a higher potential gradient causing meltwater flow to be directed in a similar direction as ice flow. Also, a smoother bed could have reduced the control of bed topography on meltwater flow. Floors and walls of tunnels in zone 2 feature polished bedrock drumlins, comma forms, and furrows, all of which can be implicated to turbid meltwater flow (Fig. 6; Reference ShawShaw, 1988, Reference Shaw1989). Abrasive action by ice around the tunnels seems evident too, with gouges identified on bedrock highs (Fig. 6).
Core data help to substantiate a meltwater hypothesis for the inner shelf. Graded sands and gravels are typical meltwater deposits (Reference Ehlers, Grube and EhlersEhlers and Grube,1983;Reference WingfieldWingfield,1990; Reference Brennand, Shaw and SharpeBrennand and others, 1996). One core from the inner shelf penetrated such a stratigraphy, and other cores may have reached a gravelly layer, but were unable to sample it. A single-channel seismic profile (1 kJ) collected during DF-85 near the Pine Island Glacier front shows an approximately 100 m thick sedimentary sequence overlying crystalline bedrock. The sequence is highly reflective and suggestive of internal layering (Reference Kellogg and KelloggKellogg and Kellogg, 1987b). It may represent other deposits of well-sorted and graded clays, sands and gravels.This layer is not imaged at the seaward end of crystalline bedrock outcrop, where seismic data were collected during NBP9902. Perhaps distribution of the sequences thins to nothing seaward, forming a wedge-shaped distribution.
If no sand and gravel layer exists in Pine Island Bay, then it can be assumed that material eroded during channel formation was carried down-glacier by the overlying ice. At seaward locations, the material was recycled into diamictons that exist on the outer shelf (Reference Kellogg, Kellogg and HughesKellogg and others, 1985; Reference Lowe and AndersonLowe and Anderson, 2002), or it was completely removed from the shelf eventually and discarded over the shelf break during maximum glaciations.
Clays, which were regularly sampled and imaged by deep-tow chirp subbottom profiles, are also typical meltwater deposits (Reference Ehlers, Grube and EhlersEhlers and Grube, 1983; Reference Ehlers, Meyer and StephanEhlers and others, 1984). The thickest units occur near the present-day ice front of Pine Island Glacier and they drape the bedrock topography (Fig. 5d). The presence of multiple clay units lacking ice-rafted debris indicates rapid deposition in a series of separate events. Multiple clay units include at least three deposits differentiated on the basis of color (dark-brown clay, brown clay, olive-gray clay) and the presence or absence of bioturbation. Locally, a glacial-marine silty diamicton unit separates clay deposits (Fig. 7). Radiocarbon dates from the clay units include one within an upper clay indicating modern-day deposition (2270 ± 800 years BP; uncorrected radiocarbon date). This relatively modern date is further evidence of rapid deposition (Reference Lowe and AndersonLowe and Anderson, 2002).
The clays are interpreted to be meltwater-plume deposits originating from the front of Pine Island Glacier. It is known from hydrographic studies that plumes are emanating from the irregular base of the Pine Island Glacier front, where temperature and salinity profiles indicate upwelling circumpolar deep water mixing with glacially derived freshwater (Reference Jacobs, Hellmer and JenkinsJacobs and others,1996). Results from microfabric analysis of DF-85 cores from Pine Island Bay revealed faint laminations, resembling cyclopels (Reference HiemstraHiemstra, 2001), argued to be the result of interplay of mud-laden meltwater plumes and marine currents (Reference Mackiewicz, Powell, Carlson and MolniaMackiewicz and others,1984). Plume activity in Pine Island Bay appears to be irregular. Sometimes, clays are deposited continuously, as evidenced by separate clay units deposited on top of each other. At other times, a pause in plume activity is recorded, with clay deposits separated by glacial–marine units.
Some of the sediment stays in suspension for long periods of time. X-ray diffraction analyses of the silty diamicton that separates multiple clay events show that the clay matrix is compositionally equal to the clay deposits (Reference Lowe and AndersonLowe and Anderson, 2002). Therefore, even when discharge events subside and deposition in a glacial–marine environment begins, some clays are evidently still in suspension from the jet, and continue to settle out under different environmental conditions. Further, the distribution of clay deposits is not restricted to basins. It occurs as a patchy drape (Fig. 5d).
Sedimentary substrate
In zone 3, any meltwater produced at the base of the ice sheet was able to permeate the underlying substrate. Zone 3 substrate consists of sediments rather than bedrock. There are no features indicative of vast amounts of meltwater identified in zone 3. Presence of mega-scale glacial lineations has been used as evidence of streaming ice (Reference ClarkClark, 1993; Reference Shipp, Anderson and DomackShipp and others, 1999; Reference Anderson, Wellner, Lowe, Mosola and ShippAnderson and others, 2001). Their formation is associated with deformation of the underlying bed by an irregular ice-sheet surface (Reference ClarkClark, 1993). In such conditions, meltwater is incorporated into the underlying sediments, and a mixture of meltwater and erodible sediments provides lubrication for fast flow of ice (Reference Alley, Blankenship, Bentley and RooneyAlley and others, 1986, Reference Alley, Blankenship, Rooney and Bentley1987b; Reference AlleyAlley, 1989). Deformation till was sampled in zone 3. It is identified by low shear strengths and constant magnetic susceptibility records, suggesting homogenous composition (Reference Shipp, Anderson and DomackShipp and others, 1999). The till unit occurs beneath a thin, stratified glacial–marine deposit occurring at the surface in zone 3.
Streaming ice in zone 3 also may contribute to the explanation of geomorphic features of zone 2. Zone 2 is a small intermediate area between zone 1 and zone 3 that represents a transition from slow ice flow over bedrock to streaming ice over sediment. Rapid flow in zone 3 resulted in a thin ice-sheet profile, while slower ice flow in zone 1 was associated with a thick ice-sheet profile (Fig. 10). Zone 2 represents an area of accelerating ice flow and high ice-surface slope.
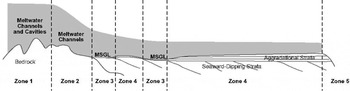
Fig. 10. Cartoon showing changes in ice-sheet profile occurring over different geomorphic zones in Pine Island Bay.Thick ice rested on rugged topography in zones 1 and 2. Streaming ice, evidenced by mega-scale glacial lineations (MSGL) in zone 3, resulted in a thin ice-sheet profile across the outer shelf.The most dramatic change in ice-sheet surface slope occurred over zone 2 where ice flow accelerated.
Basal conditions in zone 4 are characterized by sedimentary deposits that progressively thicken toward the shelf break and bury the foredeepened surface of seaward-dipping strata. The geomorphic signature of zone 4 includes iceberg furrows and these appear on the surface of the sea floor in areas with water depths < 700 m (Fig. 8). Associated sediment deposits are glacial–marine in origin (Reference Lowe and AndersonLowe and Anderson, 2002). The iceberg furrows are younger features that have actually obliterated evidence of older mega-scale glacial lineations (Fig. 8). They formed during times when ice was not grounded; therefore, there is no implication for subglacial meltwater associated with geomorphic landforms of zone 4.
Seaward of the shelf break, gullies are incised into the continental slope (Fig. 9). Gullies have been imaged on other portions of the Antarctic shelf, and are interpreted to form as sediment-laden meltwater is expelled from the base of an ice sheet grounded at the shelf break (Reference AndersonAnderson, 1999). In zone 5, any subglacial meltwater once again flowed freely. The gullies in Pine Island Bay are comparable in size to those imaged in Ross Sea, Antarctica (Reference AndersonAnderson, 1999), and do not show indications of an unusual amount of meltwater production on the outer shelf. Slope cores from DF-81 collected pebbly muds and moderately sorted sands, which could be debris-flow deposits associated with gully formation.
Implications
Observations of past meltwater activity in Pine Island Bay reveal a subglacial setting involving an organized drainage system. Multibeam data showing mega-scale glacial lineations indicate that the ice sheet advanced at least 240 km across the outer shelf. During ice grounding, subglacial meltwater discharged through a system of changing substrates. Meltwater discharge on the crystalline basement of the inner shelf consisted of a channel system, with relatively slow sliding of thick ice occurring on bedrock highs and trough boundaries. Intermittent floods occurred during catastrophic discharge events and separated the ice from the bed within some channels and expelled the meltwater directly into the bay. On a sedimentary substrate, small amounts of meltwater produced at the base of a thinner ice sheet were incorporated into the underlying strata. Streaming ice prevailed as a deforming bed controlled ice flow and thinning of the ice sheet resulted. The presence of seismic unconformities indicates ice grounded at the shelf break in the past. At those times, meltwater expelled at the shelf break lead to incision of gullies into the continental slope.
Meltwater regimes described in zones 1 and 2 are evidence that large amounts of subglacial meltwater have been discharged into Pine Island Bay in the past. The water must have been plentiful in order to incise over 400 m into the underlying bedrock, although glacial erosion undoubtedly contributed to the relief on the sea floor (Fig. 5, Table 1). There are indications of catastrophic floods occurring in areas where fields of glaciofluvial erosional features are ∼50–100 m high and at least 50 km wide. These are similar in scale to those identified in Ontario (Reference ShawShaw, 1988, Reference Shaw1989), where meltwater discharges, based on height of geomorphic features and width of fields of collective features, are estimated to be 2–6 × 10⁶ m3 s−1 (Reference ShawShaw, 1989). Due to the presence of ice-contact features, like grooves and gouges, it is not likely that such large sheet floods, resulting in complete separation of ice from the bed, occurred in Pine Island Bay. Rather, the extreme releases were more localized and probably restricted to channels and cavities.
The amount of meltwater needed to erode such deep channels and large areas, even if erosion was time-transgressive, is more than can be accounted for by melting produced by subglacial friction and geothermal heating. A geothermal heat flux on the order of 0.06 W m−2 over an area of ∼200 km × 200 km is sufficient to melt 0.24 km3 a−1. The heat derived from basal sliding may be expected to melt a similar volume (Reference PatersonPaterson, 1994). Pine Island Bay is in a polar environment, and supraglacial meltwater sources are not expected. The discharge corresponding to geothermal melting and basal friction is much too small to form the features in Pine Island Bay.
The remaining water may have been supplied by a large source somewhere up-glacier of Pine Island Bay. It is known that many subglacial lakes exist beneath the ice sheet (Reference Dowdeswell and SiegertDowdeswell and Siegert, 1999; Reference SiegertSiegert, 2000). Of the identified lakes, most exist in East Antarctica. However, it is clear that the majority of lakes form in the ice-sheet interior where thick ice persists. Radio-echo sounding data, used to locate lakes, covers only 50% of the ice cover and excludes Byrd Subglacial Basin and Bentley Subglacial Trench, where ice thicknesses are > 2000 m (Reference Vaughan, Alley and BindschadlerVaughan and others, 2001) and ∼4000 m (Reference Dowdeswell and SiegertDowdeswell and Siegert, 1999), respectively. These could serve as likely locations for a lake large enough to contain water to cause such striking geomorphic features in Pine Island Bay.
The WAIS is known to have been thicker during glacial maxima when it advanced to the outer shelf (Reference Anderson, Shipp, Lowe, Wellner and MosolaAnderson and others, 2002). We do not know how many times the ice sheet advanced across the shelf, but there were at least eight shelfwide grounding events during the Plio-Pleistocene (Reference Bart and AndersonBart and Anderson, 2000). The long glacial history of West Antarctica has certainly contributed to the spectacular scale of subglacial geomorphic features on the shelf, including those features in Pine Island Bay.
The Pine Island Bay channel system provides an example of freely flowing meltwater beneath the Antarctic ice sheet. Flowing meltwater radically affects ice-sheet stability in several ways. Rapid discharge of water may be accompanied by accelerated ice flow and surging in glaciers (Reference HughesHughes, 1977; Reference KambKamb and others, 1985). Sheet floods are known to enhance glacier flow and rapid flow velocities may result, because they locally eliminate bed resistance (Reference Alley, Blankenship, Bentley and RooneyAlley and others,1986; Reference BoultonBoulton,1986). High water pressures are suggested to reduce ice–bed coupling, which leads to a flat ice-sheet profile and increased sliding velocities. These factors contribute to ice-sheet instability and cause rapid fluctuations in ice retreat and advance (Reference Piotrowski and TulaczykPiotrowski and Tulaczyk, 1999). Such factors must be considered, together with those associated with deforming beds, when reconstructing ice-sheet dynamics and profiles of Antarctica (Reference Anderson, Shipp, Lowe, Wellner and MosolaAnderson and others, 2002).
Conclusions
Based on the evidence provided from glacial landforms and glaciofluvial sedimentary deposits, a large amount of freely flowing meltwater may have flowed beneath a formerly expanded ice sheet that was grounded within Pine Island Bay, Antarctica. This volume of meltwater drained through a series of tunnels or channels, and occasionally discharge may have been sufficient to cause local ice–bed separation.
The channel system in Pine Island Bay provides an example of subglacial meltwater interaction with a crystalline substrate, as well as a sedimentary substrate. Meltwater flowing over impermeable crystalline bedrock tended to channelize due to influence by overlying ice pressure and rugged topography of the bed. Ice grounded on sedimentary strata tended to deform sediment. Subglacial meltwater penetrated the eroded strata to become incorporated into a deforming till. The result was rapid ice flow by ice streaming.
Geological evidence suggests that recent fluctuations in the Pine Island Glacier system may be influenced by presence of subglacial meltwater. Large outbursts, which may have been experienced in the past, can be the source of erratic glacial behavior. Even if significant outbursts are not occurring presently, freely flowing subglacial meltwater likely exists beneath Pine Island Glacier. It is probably organized similarly to the system observed on the continental shelf, and undoubtedly influences ice-flow velocities. Rapid changes in the Pine Island Glacier system are linked to stability of the ice sheet and meltwater can now be considered as another factor that may affect a potential disintegration of the WAIS.
Acknowledgements
This work was supported by U.S. National Science Foundation–Office of Polar Programs grant No. 9527876 to J. B. Anderson. The authors thank the crew of the RV/IB Nathaniel B. Palmer and staff of Antarctic Support Associates for a successful cruise. S. O’Hara provided helpful assistance with the multibeam data and processing. The staff at the Antarctic Research Facility at Florida State University assisted with core analysis and sampling. We thank V. R. Baker, M.T. Guðmundsson, T. Jóhannesson (Scientific Editor) and J. S. Wellner for providing helpful comments after reviewing early versions of the manuscript.


