

1. INTRODUCTION
Mineral dust particles emitted from arid and disturbed landscapes are the most common atmospheric aerosol by mass (Andreae, Reference Andreae1995). The global radiative impact of these dust aerosols can be positive or negative depending on how they influence cloud formation and their optical contrast with the substrate (Tegen and others, Reference Tegen, Lacis and Fung1996; Myhre and Stordal, Reference Myhre and Stordal2001). Given the importance of aerosol optical properties on determining the magnitude of aerosol radiative forcing, there have been multiple direct analyses and indirect inversion techniques developed to determine the optical properties of aerosol dust and dust from geographic source regions (Grams and others, Reference Grams, Blifford, Gillette and Russell1974; De Luisi and others, Reference De Luisi1976; Patterson and others, Reference Patterson, Gillette and Stockton1977; Sokolik and others, Reference Sokolik, Andronova and Johnson1993). The bulk of this effort has focused on Saharan dust, which dominates dust aerosol mass loading (Patterson and others, Reference Patterson, Gillette and Stockton1977; Linke and others, Reference Linke2006; Kandler and others, Reference Kandler2007; McConnell and others, Reference McConnell2008; Wagner and others, Reference Wagner2012).
Dust aerosols also influence radiative forcing when deposited on snow (Painter and others, Reference Painter, Skiles, Deems, Bryant and Landry2012; Skiles and others, Reference Skiles, Painter, Deems, Landry and Bryant2012). Clean snow is highly reflective in the visible wavelengths and even moderately absorbing dust aerosols decrease visible albedo. This is a regionally important process that has received less attention than global atmospheric dust radiative forcing. The impacts of dust in snow have been most well studied in the mountain snow cover of the Colorado Rocky Mountains, the headwaters of the Colorado River, on which dust is deposited during the springtime when dust emission rates peak upwind in the semi-arid Colorado Plateau (Painter and others, Reference Painter, Skiles, Deems, Bryant and Landry2012; Flagg and others, Reference Flagg, Neff, Reynolds and Belnap2014). Deposition of mineral dust has increased five-fold in portions of the Upper Colorado River Basin (UCRB) since settlement and disturbance of the Western US (Neff and others, Reference Neff2008), and studies indicate that extreme dust years may become more frequent in the future as climate warms and vegetation dynamics shift (Munson and others, Reference Munson, Belnap and Okin2011; Li and others, Reference Li, Okin, Skiles and Painter2013).
Dust has also been shown to impact the snow albedo of glaciers in the Himalaya (Kaspari and others, Reference Kaspari2009; Gautam and others, Reference Gautam, Hsu, Lau and Yasunari2013; Kaspari and others, Reference Kaspari, Painter, Gysel, Skiles and Schwikowski2014) and Switzerland (Oerlemans and others, Reference Oerlemans, Giesen and Van den Broeke2009), annual snow cover of the Sierra Nevada (Sterle and others, Reference Sterle, McConnell, Dozier, Edwards and Flanner2013) and snow in the Canadian Arctic (Woo and Dubreuil, Reference Woo and Dubreuil1985; Zdanowicz and others, Reference Zdanowicz, Zielinski and Wake1998). Additional observational studies of dust in snow have occurred in the European Alps (De Angelis and Gaudichet, Reference De Angelis and Gaudichet1991; Franzén and others, Reference Franzén, Mattsson, Mårtensson, Nihlén and Rapp1994; Schwikowski and others, Reference Schwikowski, Seibert, Baltensperger and Gaggeler1995; Grousset and others, Reference Grousset, Ginoux, Bory and Biscaye2003), central/east Asia (Wake and Mayewski, Reference Wake and Mayewski1994; Xin and others, Reference Xin, Baiqing and Jing2014) and the Antarctic Penninsula (McConnell and others, Reference McConnell, Aristarain, Banta, Edwards and Simoes2007). It has been suggested that dust on snow may be responsible for northern China remaining ice free during the last glacial maximum (Krinner and others, Reference Krinner, Boucher and Balkanski2006). It has also been theorized that dust on snow accelerated snowmelt early in the history of Mars, leading to the formation of valley networks from meltwater (Clow, Reference Clow1987).
Although radiative forcing by dust in snow has been well recognized for decades, its precise value has largely remained unquantified. Many snow radiative forcing models justify neglecting dust because black carbon (BC), a widespread light absorbing aerosol produced by incomplete combustion, can be orders of magnitude more absorptive by mass than dust and the effects of dust loading in snow should be similar to those of optically equivalent concentrations of BC (Warren, Reference Warren1984; Warren and Wiscombe, Reference Warren and Wiscombe1980). Alternatively, some models assume that all the dust is characteristically Saharan (Flanner and others, Reference Flanner, Zender, Randerson and Rasch2007). These assumptions are not well justified. Given the established presence and impact of dust on snow globally it is necessary to determine the regionally varying optical properties of dust deposited in snow. Furthermore, the optical properties of dust in snow cannot be properly inferred from source region dust, because exact source area is unknowable and particle size distributions (PSDs) and overall composition are altered during atmospheric travel (Miller and others, Reference Miller, Tegen and Perlwitz2004).
The radiative properties of dust aerosols, which are size- and wavelength-dependent, are described by the spectral complex index of refraction:
 $$m_\lambda = n_\lambda + ik_\lambda$$
where n λ is the real part, also known as the simple index of refraction, i is the imaginary number and k λ is the imaginary part. Values of n have been fairly well established for airborne mineral aerosols, generally ranging from 1.5 to 1.6 for dust aerosols and between 1.4 and 1.6 for pure mineral phases (Grams and others, Reference Grams, Blifford, Gillette and Russell1974; Patterson and others, Reference Patterson, Gillette and Stockton1977; Sokolik and others, Reference Sokolik, Andronova and Johnson1993; Zhao and others, Reference Zhao, Gong, Hu, Tanaka and Hayasaka1997; Barthelmy, Reference Barthelmy2012; Meng and others, Reference Meng2010; Wagner and others, Reference Wagner2012).
The imaginary part, k λ, describes absorption loss as the wave propagates through the medium. Despite a number of methods to determine it, it is less well established for dust aerosols. Methods can be generalized into two categories: direct and inversion. Direct methods use laboratory measurements to measure diffuse reflectance or transmitted light to retrieve k values from radiation theories, like the two flux Kubelka–Munk theory (Patterson and others, Reference Patterson, Gillette and Stockton1977).
Inversion methods for determining k values utilize measurements from one or more optical instruments, like nephelometers, photometers and spectroradiometers, to determine scattering and reflectance. These instruments can be in the laboratory (Wagner and others, Reference Wagner2012), in the field (Grams and others, Reference Grams, Blifford, Gillette and Russell1974), or on airborne remote-sensing platforms (Redemann and others, Reference Redemann2000; McConnell and others, Reference McConnell2008; Osborne and others, Reference Osborne2008). Measurements are then used to retrieve k values by relating them to modeled scattering/reflection. Inversion methods require that certain assumptions about the nature of the dust be made, for instance PSD and sphericity.
Here, an inversion method is presented to determine the spectral complex index of refraction for dust deposited in snow, motivated by the fact that generic/non-specific dust representations cannot accurately constrain radiative transfer modeling of snow albedo in the UCRB (or necessarily any other snow-covered region), either in magnitude or reflectance shape. Measured dust PSDs are used to model single scattering optical properties from Mie theory for varying values of k, and a specified value of n. Multiple scattering and reflectance is then modeled from single scattering optical properties, and the complex index of refraction is retrieved by matching measured hemispherical dust reflectance to modeled reflenctance in the visible (VIS) and near infrared (NIR). The single scattering optical properties, associated with retrieved k λ values, are incorporated in a snow/aerosol radiative transfer model to verify the validity of results by comparing modeled albedo of snow containing dust to snow albedo measured in the field.
2. METHODS
2.1. Study area and field sampling
We used dust collected from snow at Swamp Angel Study Plot (SASP), a subalpine study plot located in Senator Beck Basin Study Area (SBBSA), a 290 ha study basin located in the San Juan Mountains of southwestern, CO (Fig. 1). The San Juan Mountains are the first major mountain range approached by dust aerosol plumes emitted from the southern Colorado Plateau, and SBBSA was established in 2003 to monitor the hydrologic impacts of dust in snow in the Colorado River Basin (CRB). For more information see Landry and others (Reference Landry, Buck, Raleigh and Clark2014) and Painter and others (Reference Painter, Skiles, Deems, Bryant and Landry2012).

Fig. 1. Overview of the four corners region of the western US showing location of Senator Beck Basin Study Area in the San Juan Mountains of southwestern Colorado.
Snow measurements at SASP have included weekly collections of snow samples for determination of dust loading at the surface and stratigraphy in the top 30 cm of the snow column at 3 cm intervals (the approximate maximum depth at which radiative forcing is influenced by light absorbing impurities). The dust in snow data record has been used to assess the interannual variability of dust deposition and dust composition (Lawrence and others, Reference Lawrence, Painter, Landry and Neff2010; Skiles and others, Reference Skiles, Painter, Deems, Landry and Bryant2012), but previous measurements were not carried out in a way to facilitate radiative transfer modeling. To address this void, a high-resolution record of snow properties and gravimetric dust and BC concentrations were collected on a near daily basis at SASP over the last 2 months of snow cover in 2013. A detailed description of this dataset is presented in Skiles and Painter (Reference Skiles and Painter2016).
Briefly, measured snow properties included spectral snow albedo, grain size and snow density, in addition to impurity concentrations. Spectral albedo was measured above the site of gravimetric snow sampling with an Analytical Spectral Devices FieldSpec3 field spectroradiometer. The optical grain size was retrieved via contact spectroscopy (Painter and others, Reference Painter, Molotch, Cassidy, Flanner and Steffen2007) in 2 cm increments across the full vertical snow profile. Snow density in each of the 10 gravimetric samples in the top 30 cm was calculated from sample mass and volume. Below the top 30 cm, snow density was measured with a 1 L density cutter and field scale at 10 cm intervals.
2.2. Laboratory measurements
Laboratory analysis for snow impurity content is described in more detail in Skiles and Painter (Reference Skiles and Painter2016). Briefly, snow samples were kept frozen until time of analysis at which point they were melted, weighed, filtered and dried for dust mass and concentration. Dust PSD between 0.05 and 2000 µm was quantified utilizing laser light diffraction (Malvern Instruments; Mastersizer 2000E) from a subset of snow samples introduced directly using a wet dispersion system. The need to meet obscuration limits of the system limited analysis here to visibly dusty samples, but the extreme dust loading in spring 2013 enabled us to analyze six samples, representing both single event and merged dust layers.
Dust does settle out during the process of melting the snow sample and to disperse the dust in the melted snow water again samples were agitated (both manually and through sonification) prior to analysis. We note here that sonification could break apart aggregates that may have been present in the snow. There is also potentially a discontinuity between PSDs determined from dispersed samples relative to aggregate (filtered and dried) samples. This is relevant for this analysis because we use dispersed dust PSDs for modeling but the reflectance of dried (aggregate) samples for retrieval, as discussed further below. To assess the variation in PSD between dispersed and filtered/dried dust samples, we also measured the PSD of dried dust from two samples post-filtering.
Hemispherical reflectance of optically thick dry filtered dust was measured with an Analytical Spectral Devices (ASD) FieldSpec3 spectroradiometer coupled to an ASD RTS-3ZC integrating sphere. The spectrometer measures from 0.35 to 2.50 µm, with contiguous bands that are 0.003 µm (at 0.7 µm) to 0.01 µm (at 1.4 and 2.1 µm) at full width half maximum. The spectra are resampled and splined to 1 nm resolution. The sample is illuminated by a collimated tungsten light source at a radiance close to that of sun at the Earth's surface. We were able to measure reflectance of seven optically thick samples from 2013, representing both single event and merged dust layers. The spectrometers shortwave infrared (SWIR) detector was noisy and the reflectance between 1.7 and 2.5 µm needed to be smoothed, which introduces some uncertainty in the reflectance values in the SWIR.
The optical property retrieval technique presented here does not account for individual constituents of the impurity mixture. Impurities are here referred to as dust because they dominate the impurity mass, but likely also include some organics (bacteria, plant matter) and BC. The presence of BC could influence the selection of the real part of the refractive index, which has higher suggested values (n = 1.75–1.95 (Bond and Bergstrom, Reference Bond and Bergstrom2006)) than dust aerosol, Skiles and Painter (Reference Skiles and Painter2016) showed that over the 2013 spring melt season BC concentrations ranged from 2 to 26 ppb. These concentrations accounted for, on average, <0.01% of the total impurity mass.
2.3. Dust radiative transfer modeling
The modeling and analysis scheme described here is represented in Figure 2. Mie theory was used to model single scattering and absorption for a measured PSD and specified value of n with a range of k λ values, for wavelengths between 0.35 and 2.5 µm at 10 nm resolution, to match the spectral resolution of the SNow, ICe and Aerosol Radiation model (SNICAR) (Flanner and Zender, Reference Flanner and Zender2005, Reference Flanner and Zender2006), the snow and aerosol radiation transfer model used to validate results. The PSD is described by the volume weighted mean radius, r and standard deviation of log(r) from the PSD measurements of dust samples.

Fig. 2. Methodology to retrieve and validate dust on snow optical properties.
The use of Mie theory requires the assumption of spherical dust particles, a reasonable, but imperfect assumption. Although dust aerosols are irregularly shaped and non-spherical, it has been shown that differences in optical properties between spherical and non-spherical particles, like the shape of the phase function (angular distribution of reflected light), become less important when integrated over hemispheres. Mishchenko and others (Reference Mishchenko, Lacis, Carlson and Travis1995) showed that the spherical assumption can lead to large errors when retrieving properties where scattering geometry matters, like optical thickness for dust aerosols in the atmosphere, but spherical/non-spherical errors ‘averaged out’ when integrating over reflectance and illumination angles. Therefore, the accuracy of applying Mie theory is adequate when modeling radiative flux and albedo. Still, we recognize the spherical assumption as an uncertainty in this analysis, and plan to investigate the utility of non-spherical radiative transfer modeling in the future. Further discussion of the limitations of treating dust aerosols as spheres, can be found in Meng and others (Reference Meng2010) and Yi and others (Reference Yi, Hsu, Yang and Tsay2011) and citations therein.
Previous studies have reported that the retrieval of k λ is not sensitive to the value of the real part of the refractive index between n = 1.5 and n = 1.6 (Grams and others, Reference Grams, Blifford, Gillette and Russell1974; Kandler and others, Reference Kandler2007; McConnell and others, Reference McConnell2008; Yi and others, Reference Yi, Hsu, Yang and Tsay2011). To assess this, we conducted a sensitivity analysis by producing separate look up tables (LUTs) for n = 1.5, 1.525, 1.55, 1.75 and 1.6. Retrievals of k λ from each LUT allowed us to independently determine that this method is also relatively insensitive to the n value in this range (Fig. 3). Here we selected n = 1.525 across the entire wavelength range to match the value of Grams and others (Reference Grams, Blifford, Gillette and Russell1974), which was measured for dust from the southwestern US using the oil immersion technique.
Fig. 3. We found that varying the real part, n, did not strongly impact the retrieval of the imaginary part, k. Here we show an example retrieval where the shaded area represents the range of k values for specified values for n between 1.5 and 1.6.
The values for the imaginary part of the refractive index, k λ = 0.00001–0.1, at 0.0001 resolution, were selected to bracket the range of reported values for dust aerosols and mineral components in the literature. The single scattering optical properties were used to model multiple scattering and reflectance using the plane parallel discrete ordinate radiative transfer algorithm DISORT (Stamnes and others, Reference Stamnes, Tsay, Wiscombe and Jayaweera1988) to create a reflectance LUT catalogued by wavelength and k value (Fig. 4). Measured reflectance was then processed through the LUT to retrieve k λ . The associated spectral single scattering optical properties (albedo, asymmetry parameter and mass extinction coefficient) were then compiled as separate optical property LUTs to update SNICAR, discussed further below. Similar methodology has been used to infer the imaginary part of refractive index of sea-ice sediment by Light and others (Reference Light, Eicken, Maykut and Grenfell1998) and for hydrated salt crystals in sea ice by Carns and others (Reference Carns, Light and Warren2016).

Fig. 4. Visual representation of DISORT look up table (LUT) used to retrieve the imaginary part of the complex index of refraction. The actual LUT is more densely populated; the resolution is limited here so that reflectance curves remain discernible.
2.4. Snow radiative transfer modeling
SNICAR computes multiple scattering and reflectance from snow + aerosol mixtures across 470 bands (0.3–5.0 µm) at 10 nm resolution with a single layer version of the two stream, multilayer radiative approximation of Toon and others (Reference Toon, McKay, Ackerman and Santhanam1989). The inputs for SNICAR include solar zenith angle, snow optical grain size, snow density and concentrations of impurities. The single scattering optical properties for impurities and ice are extracted from LUTs. For ice, LUTs are included for a large range of grain sizes (between 10 µm to 5 mm at 1 µm resolution) and have been updated to reflect the revised ice optical property compilation of Warren and Brandt (Reference Warren and Brandt2008).
Currently, the dust optical properties in SNICAR are designed to represent general global dust aerosols, which are characteristically Saharan. The single scattering optical properties for four partitions of a lognormal size distribution (D1: 0.1–1 µm; D2: 1.0–2.5 µm; D3: 2.5–5.0 µm; and D4: 5.0–10.0 µm) are characterized by combinations of indices of refraction for a mixture of quartz, limestone, montmorillinite, illite and hematite using the Maxwell-Garnett approximation (SNICAR-Online (Flanner and others, Reference Flanner, Zender, Randerson and Rasch2007)). We compare SNICAR albedo, modeled with both the general dust characterization (‘dustgeneral’) and with the updated optical properties for dust on snow (‘dustsnow’) presented here, and assess modeled albedo scenarios by comparing them with both spectral albedo, measured at the snow sampling site and broadband albedo, measured at the instrumentation tower nearby the sampling site.
Spectral albedo was modeled with SNICAR for each day measurements, were made in the field between 11 March and 18 May 2013. Snow property inputs were specified for the full depth of the snowpack, represented as 11 layers; the top 10 layers are 3 cm deep, and correspond to snow sampling described above and in Skiles and Painter (Reference Skiles and Painter2016), the 11th layer represents the ‘bulk’, or remainder, of the snowpack (Fig. 5). Density, optical grain size (resampled from 2 to 3 cm resolution) and dust concentrations are specified in each of these layers. Across the lowest layer the mean density, mean grain size and bulk dust concentration were specified. Model solar zenith angles were concurrent with measured values. For dustgeneral runs, dust particles were binned based on measured PSDs (3% D1, 6% D2, 9% D3, 82% D4). Note that the filtered dust pictured in Figure 5 is an example of an optically thick dust sample.

Fig. 5. A representation of SNICAR inputs and output for 11 May 2013. Snow properties and dust concentrations are specified in 11 layers: 10 3-cm surface layers and a single layer for the remainder of the snowpack.
To assess modeled albedo, we compare modeled with measured spectrally weighted albedos, which were calculated over the broadband (BB; 0.35–1.5 µm), visible (VIS; 0.35–0.75 µm) and NIR wavelengths (0.75–1.5 µm) by dividing the product of the summation of irradiance and albedo by the summation of irradiance, i.e. for broadband albedo between 0.35 and 1.5 µm:
 $${\rm \alpha} = \displaystyle{{\sum\limits_{{\rm \lambda \,=\, 0}{\rm. 35}\,{\rm \mu m}}^{1.5\,{\rm \mu m}} {I \,\times} \,{\rm \alpha} _{dust}\Delta {\rm \lambda}} \over {\sum\limits_{{\rm \lambda \,= \,0}{\rm. 35}\,{\rm \mu m}}^{1.5\,{\rm \mu m}} {I\Delta {\rm \lambda}}}} $$
where I is spectral irradiance at a given solar zenith angle, α dust is the modeled albedo with dust at the same solar zenith angle and λ is the wavelength (μm). We use the difference between measured reflected flux and modeled reflected flux (α dust × I) to quantify the skillfulness of albedo modeled with dustgeneral and dustsnow to represent observed conditions.
To minimize uncertainty due to measurement conditions we selected only the days that had consistent (fully clear or fully cloudy) sky conditions during albedo collection (14 of 36 d). Although this is a smaller subset of the full record, these days were representative of the range of observed snow conditions, from cold to melting snow, and from relatively low to extremely high-dust content. As noted for integrating sphere measurements, there was high noise in the SWIR for spectral albedo measurements, which is why we chose to carry out the comparison between 0.35 and 1.5 µm. This is acceptable in this application because the majority of snow reflectance, and solar irradiance, occurs in this range.
During albedo measurements uplooking measurements were not collected in irradiance mode, therefore we model clear sky spectral irradiance with Santa Barbara DISORT Atmospheric Radiative Transfer model (SBDART) (Ricchiazzi and others, Reference Ricchiazzi, Yang, Gautier and Sowle1998). The presence of clouds can shift the spectral distribution of irradiance, while this was not accounted for here, daily variation in irradiance was accounted for by scaling modeled irradiance such that its spectral integration matched measured broadband irradiance at the instrumentation tower.
Snow albedo varies with wavelength and is controlled in the NIR wavelengths by snow grain size and in the visible wavelengths by impurity content thus a spectrally explicit treatment is required. In addition, spectral albedo is best used in this analysis given that model inputs (including grain size and impurity content) and albedo measurements were spatially and temporally coincident. However, due to sky condition limitations, the spectral albedo dataset was smaller than the number of days when measurements were collected. Here, we also use broadband albedo from tower pyranometers to compare modeled with measured albedo across the full measurement time series (modeled spectrally weighted albedos, Eqn (2), were calculated between 0.35 and 2.5 µm for this comparison). Measured broadband albedo is calculated from uplooking and downlooking pyranometers after correcting snow reflectance for slope and aspect gradients (Painter and others, Reference Painter, Skiles, Deems, Bryant and Landry2012). For consistency, comparison is made at the same daily time step across the time series, 11:00 AM local time, which corresponds to the time when snow measurements were typically being made.
3. RESULTS AND DISCUSSION
3.1. Laboratory measurements
3.1.1. Particle size distributions
The dust PSDs were relatively consistent from sample to sample (Fig. 6). Variations mainly depended on the number of dust deposition events represented in the sample, where samples that contained dust from single events exhibited a slightly more narrow distribution range than snow samples that contained merged dust events. This may be due to the fact that the source region and deposition conditions are fairly consistent from event to event. More likely it was due to the fact that 90% of the dust was deposited by one event (dust event No. 6; ‘D6’), which then dominated the PSD. The PSD used for the Mie modeling, a volume-weighted mean radius of 6 µm and standard deviation of log(r) of 0.28, was a mean of all PSDs including single and merged events.

Fig. 6. Particle size distributions of SASP 2013 dust on snow, as measured with laser light diffraction. Here we show dust reflectance for single event (dust event 6; D6) and merged dust layers, the average reflectance from all measurements, and the gray shading represents the range of values.
We note that the PSDs presented here are shifted toward smaller sizes relative to PSDs previously published for dust deposited in snow between 2005 and 2008 at SBBSA (see Fig. 2 in Lawrence and others (Reference Lawrence, Painter, Landry and Neff2010)). We attribute this to differences in samples preparation; in Lawrence and others (Reference Lawrence, Painter, Landry and Neff2010) samples were freeze dried, acid digested, sieved and then measured by size fraction, and it was recognized that they likely underestimate the mass fraction of <250 µm size particles with this approach. That being said, both methodologies return size ranges that are classified as predominantly clay and silt, and have similar mean particle sizes (phi units; ~6).
The inversion for k λ is sensitive to the selected PSD and measuring PSDs directly from melted samples, as we did here, is suggested. In part because dust in snow primarily is in contact with liquid water during its solar-interactive lifetime, and as might be expected we found that if the PSD was measured after the sample had been filtered, dried and physically separated (but no further treatments were applied like sieving), then the distribution shifted toward larger particles sizes (mean radius > 10 µm). When the ‘dry’ PSDs were used to produce the LUT the retrieved k λ values were representative of weakly absorbing mineral phases like quartz, and were too low to describe absorption by dust in snow in this region.
3.1.2. Dust reflectance
Over the solar spectrum, the absorptivity of the dust filtered from the snow was greatest across the visible wavelengths and decreased into the NIR. At 0.35 µm albedo was ~0.1 and increased steadily over the visible wavelengths to ~ 0.3 at 0.75 µm, ~0.4 at ~1.35 µm, and then to ~0.5 at 2.5 µm (Fig. 7). The 2.2 µm absorption feature indicates the presence of clays. The general shape and magnitude of dust reflectance was consistent between samples, and there were no discernible patterns differentiating reflectance of individual and merged samples (Fig. 7). This is not unexpected given that the majority of dust was deposited by a single event, as mentioned in Section 3.1.1, which would then dominate the optical properties of merged samples. Although we report the retrieved k λ values for the average reflectance, they were determined for all reflectance curves and the difference between the retrievals was negligible.

Fig. 7. Integrating sphere reflectance for SASP 2013 samples. Here we show dust reflectance for single event and merged dust layers, and the average reflectance from all measurements. Note that there was noise across the SWIR wavelengths, which we have smoothed here.
3.1.3. Dust optical properties
The retrieved imaginary part of the complex refractive index for dustsnow ranged from 0.0015 at 0.35 µm to 0.0005 at 1.5 µm (Fig. 8). The uncertainty in retrieval, assessed by comparing the difference in retrieved values between the individual and average reflectance curves, was ±9 × 10⁻⁵. The most rapid decrease in k λ corresponded to the increase in reflectance across the visible wavelengths between 0.35 and 0.6 µm, where k λ decreases from 0.0015 to 0.0006. Some complex indices of refraction retrieved by this method across the visible wavelengths were 1.525–0.0015i, 1.525–0.0010i and 1.525–0.0006i at 0.35, 0.5 and 0.75 µm, respectively (see Table 1 for more values).
Fig. 8. The imaginary part of complex index of refraction, k, for dustsnow between 0.35 and 2.5 µm. Dashed line indicates where reflectance was estimated to account for noise in the SWIR. Shaded area represents the range of retrievals for all dustsnow reflectance curves; black line is the retrieval for average reflectance, which was used for retrieval of single scattering optical properties.
Table 1. Complex index of refraction for dustsnow over a range of wavelengths

Averages are summarized in bold at the bottom of each column.
Other k values published for dust aerosols are widely ranging and are typically only determined at a few wavelengths, but generally, what we would expect is that dust mainly originating from the southern Colorado Plateau would be more absorptive in the visible wavelength relative to most but not all Saharan dust, which is generally less iron rich. We selected a few values from the literature for comparison. Carlson and Benjamin (Reference Carlson and Benjamin1980) summarized a range of previously published values in the visible, NIR and infrared for Saharan dust, in the visible wavelengths studies found that the dust was most absorptive ~0.3 µm (0.018–0.039) with decreasing absorptivity toward 0.7 µm (0.002–0.012). These values are higher than more recent measurements, McConnell and others (Reference McConnell, Formenti, Highwood and Harrison2010) collected airborne Saharan dust over West Africa and found the imaginary part of the complex refractive index at 0.55 µm to range between 0.0001 and 0.0046. Muller and others (Reference Muller2008) reports higher values of 0.0051, 0.0016 and 0.0045 at 0.45, 0.55 and 0.65 µm, respectively for near surface airborne dust in Morocco. Very few studies have taken place in the western US, the imaginary part of the complex refractive index suggested by Grams and others (Reference Grams, Blifford, Gillette and Russell1974), 0.005 at 0.5 µm determined from near surface airborne dust in Texas, was the geometric mean value from a set of retrievals that ranged from 0.0009 to 0.01. We would like to note again that the optical properties of dust in snow should not be inferred from the assumed source region, but there have been no other studies of which we are aware that have collected dust deposited in snow for optical property analysis.
The single scattering albedo, the probability that a photon will survive an extinction event (where 1 is fully scattering and 0 is fully absorbing), for dustsnow ranged from 0.76 at 0.35 µm to 0.97 at 2.5 µm (Fig. 9). Corresponding to the decrease in absorption and k λ values across the visible wavelengths, the largest rate of change in SSA occurred between 0.35 and 0.7 µm, where it increased from 0.76 to 0.9. The asymmetry parameter g, the mean cosine of direction of scattering (where 1 is forward scattering and −1 is backward scattering), for dustsnow decreased slightly from 0.82 at 0.35 µm to 0.7 at 2.5 µm. This indicates that across the solar wavelength range there is a decrease in the forward scattering, and penetration of photons into the snowpack, by dust. An assumed particle density of 2.6 g cm−3 (Tegen and Fung, Reference Tegen and Fung1995; Hess and others, Reference Hess, Koepke and Schult1998; Kandler and others, Reference Kandler2007) was used to determine the mass specific extinction coefficient for dustsnow, which was highest at 0.35 µm, decreased to 0.7 µm, and then remained fairly constant into the NIR (Fig. 9).

Fig. 9. The single scattering albedo, asymmetry parameter and mass absorption coefficient for dustsnow and four size bins of dustgeneral.
The optical properties retrieved for dustsnow are plotted with the optical properties for the four size bins of dustgeneral in Figure 9. The optical properties for dustsnow are most similar to properties for the largest dustgeneral size bin (D4: 5–10 µm), which is expected given the volume weighted mean radius for dustsnow falls within this range. Notably, the main difference between scenarios is the higher absorption coefficient of dustsnow in the visible wavelengths relative to the dustgeneral D4 size bin.
Sokolik and Toon (Reference Sokolik and Toon1999) presented a good summary of the limitations of retrieving dust optical properties from bulk samples, like the method presented here. Essentially, they argue that it is difficult to justify the representativeness of bulk samples when dust aerosols are highly variable in time and space and also question the appropriateness of attributing a single refractive index to mixtures of various particle sizes and chemical composition.
We acknowledge the validity of these arguments for dust aerosols in transport but argue that using the reflectivity of bulk samples is an appropriate method to retrieve optical properties for dust in snow, for multiple reasons. First, space-time variability is constrained by deposition region and seasonality of dust impacts, and we have found DOS reflectance and grain-size distributions exhibit limited intra- and interannual variability. Second, this method utilizes hemispherical reflectance and is therefore not sensitive to issues associated with illumination angle. Third, approaching dust in snow with a forward, composition mixing approach neglects some absorbing components like organics (bacteria, plant matter) since these are typically removed by digestion/sieving prior to compositional analysis. Ultimately, we argue this method is useful because it improves radiative transfer modeling of snow-containing dust, as discussed below, and provides a method for the establishment of a geographic library of optical properties of dust found in snow around the globe.
3.2. Evaluation of dust optical properties
3.2.1. Spectral albedo
Snow conditions on days in which spectral albedo measurements were made can be generally classified into three types that occurred during three distinct time periods: five relatively clean snow days when dust near the surface was <0.1 pptw (28 March–24 April); four transitional days over which dust layers began to converge and emerge at the surface (26–29 April); and five days with high-dust content (4.0 pptw or more) at the surface (2–4 May, 17–18 May) (Fig. 10). We selected a day during each of these periods to show: (1) albedo modeled with both dustgeneral and dustsnow, (2) the difference between modeled and measured albedo, (3) reflected flux and (4) the difference between modeled and measured reflected flux (Fig. 11). In Figure 12, spectrally integrated BB, VIS and NIR albedo are plotted for all 14 d, and the summary of results is presented in Table 2.

Fig. 10. Surface dust concentrations, shown with snowfall events, between 21 March and 18 May 2013.
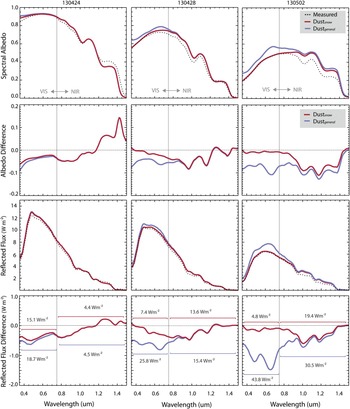
Fig. 11. Measured and modeled spectral albedo, difference from measured albedo, reflected flux, and difference from measured reflected flux for a relatively clean day (24 April), a day with high dust content near but not at the surface (28 April), and a day with high dust content at the surface (2 May).

Fig. 12. Spectrally integrated broadband, visible, and NIR albedo across the full spectral albedo time series (above), and corresponding scatter plots of measured versus modeled broadband albedo (below).
Table 2. Summary of measured broadband, visible, and near infrared irradiance, reflectance and albedo, in comparison with modeled albedo and difference in reflected flux from that which was measured, for the two different dust optical properties representations
Due to the presence of dust in all the snow samples, albedo modeled with dustsnow was always lower than dustgeneral because dustsnow is more absorptive across the VIS wavelengths. Snow reflectance modeled with dustsnow also better captured measured snow reflectance magnitude and shape, particularly on days when there was high-dust content at or near the surface. This higher absorption resulted in an improvement in albedo modeling of 50% on average across the full range of snow reflectance, reducing the difference in reflected flux (Δ flux) from 43.9 to 20.7 Wm−2. The most marked improvement occurred across the VIS during the 5 d when dust was at the surface, when dustsnow reduced errors by almost 80% relative to dustgeneral (Fig. 11). Therefore, utilizing dustsnow optical properties allowed SNICAR to more accurately model the reduction in snow albedo due to dust in this region, particularly in the presence of heavy dust loading.
The largest variation between measured and modeled albedo for both dust optical representations occurred in the NIR wavelengths in the presence of heavy dust loading, where SNICAR overestimated NIR albedo by ~15% for dustsnow and ~20% for dustgeneral, with respective Δ flux of 13.3 and 17.8 Wm−2. Given that (1) we force the model with measured effective grain size, and (2) solar irradiance across this wavelength range is lower, we would have expected these errors to be smaller and we discuss this in more detail below. Despite the presence of these errors, dustsnow still improved the modeled NIR albedo, reducing the average errors from 12 to 9%.
3.2.2. Discussion of NIR errors
Albedo in the NIR should be a better match in all cases given that it is determined by the optical grain-size input, which is estimated from measured reflectance. The method, contact spectroscopy, uses the integral of the continuum normalized ice absorption feature centered at 1.03 µm to invert for grain size using the same theory and ice optical properties contained in SNICAR. We recognize that extreme dust deposition, like that which occurred in 2013, could impact the grain size retrieval by making the absorption feature more shallow, therefore returning a smaller grain size. Increasing the snow grain size, though, does not resolve the NIR discrepancy observed here, because a larger grain size reduces the albedo at all wavelengths (this was observed in test runs, also see (Warren and Wiscombe, Reference Warren and Wiscombe1980)). Therefore, we attribute this issue to representation of dust absorption within SNICAR, as opposed to an error that could be attributed to inputs.
The mismatch between measured and modeled NIR albedo issue may arise from how dust particles and snow grains are modeled as a mixture: SNICAR treats dust as an external mixture, while at SBBSA wet and dry deposition of dust is observed, resulting in dust that is both internally and externally mixed with snow grains. An external treatment results in heterogeneous dispersions of dust among snow grains that interact with solar radiation differently from homogeneous external mixtures. This micro-scale variation in absorption manifests as spatially variable surfaces, for example, high-surface roughness and vertical and planar patches of concentrated dust interspersed with cleaner snow (Fig. 13). Even with high-dust content, surfaces like these would have reflectance that is characteristic of both dust and ice.

Fig. 13. A picture of dust near the snow surface at SASP on 10 May 2013 exhibiting the variability in dust distribution in the snow. Rather than a continuous externally mixed layer of dust, like that which would result from artificial deposition, atmospheric deposition results in dust that is heterogeneously distributed among snow grains as internal and external mixtures.
The way SNICAR models NIR albedo in the presence of heavy dust loading is similar to the spectral albedo measurements presented in Singh and others (Reference Singh, Kulkarni and Chaudhary2010), where varying amounts of dust were manually applied at the snow surface. In this instance, snow would almost be exclusively externally mixed. In spectroscopy measurements a plateau of NIR albedo and increased SWIR albedo with increasing amounts of dust was observed. Essentially, the reflectance became more dust like and less ice like in the NIR/SWIR. As shown here, this is not representative of heavy dust absorption deposited by atmospheric deposition, where NIR albedo does not plateau and albedo still reduces close to 0 in the SWIR. Previous radiative transfer models of snow containing impurities have treated them as both exclusively external (Warren and Wiscombe, Reference Warren and Wiscombe1980) and exclusively internal (Chýlek and others, Reference Chýlek, Ramaswamy and Srivastava1983). We suggest that representing dust as both internally and externally mixed would allow modeled absorption in the NIR to better match observations.
3.2.3. Broadband albedo time series
Using dustsnow optical properties also improved albedo modeling relative to the measured broadband albedo time series from the tower (Fig. 14). Prior to 28 April, when surface concentrations were relatively low (0.01–0.35 pptw), dustsnow moderately improved albedo modeling and reduced Δ flux from 43 to 33 Wm−2. Between 29 April and 5 May surface when dust layers emerged and converged at the snow surface with melt (0.5–5.7 pptw), using dustsnow improved albedo modeling by 50%, reducing Δ flux from 122 to 67 Wm−2. When combined dust layers were exposed at the surface (after 5 May, >5.0 pptw), using dustsnow improved albedo modeling by ~70%, reducing Δ flux from 91 to 30 Wm−2.

Fig. 14. (Left) Modeled broadband albedo for all snow measurement days between 11 March and 18 May, shown with the continuous broadband albedo times series from the SASP instrumentation tower (11:00 am local time). (Right) Scatter plot of measured versus modeled broadband albedo.
The snow albedo measured at the tower may not always be representative of snow in the nearby study plot, and it should be noted that snow melted out underneath the tower a day and half earlier than in the measurement plot. This is likely a product of the snow being shallower under the tower due to the difference in underlying surface height of the ground (which varies across the study plot). It could also be a product of spatial variability in albedo, which was not characterized. Still, it is worthwhile to assess the variation between SNICAR modeled albedo and tower measurements over the full time series. Relative to tower albedo, dustsnow improved broadband albedo modeling by 50% over the spring and 70% in the presence of heavy dust loading.
4. CONCLUSION
Here, we presented an inversion technique to determine the complex index of refraction and single scattering optical properties of dust deposited in mountain snow cover using measured PSDs and hemispherical reflectance. We validated our retrievals by comparing albedo modeled by a snow + aerosol radiative transfer model with measured albedo, and found utilizing the derived optical properties of reduced errors in broadband albedo modeling by 50% relative to optical properties for a ‘global mean’ dust characterization.
The study of light absorbing impurities in snow has focused on BC in permanent snow and ice in the high northern latitudes where even minor reductions in albedo can have important climatic impacts (Hansen and Nazarenko, Reference Hansen and Nazarenko2004; IPCC, 2007, 2013). Despite the importance of annual snowmelt runoff in the mid-latitudes, and the increased risk for dust emission and deposition with climate and land use change, the impacts of mineral dust on snow cover are not as well understood and the optical properties of dust are poorly constrained observationally. A few recent studies have found that dust dominates radiative forcing in mid-latitude mountain snow cover, even in the presence of BC (Sterle and others, Reference Sterle, McConnell, Dozier, Edwards and Flanner2013; Kaspari and others, Reference Kaspari, Painter, Gysel, Skiles and Schwikowski2014). The method presented here, which requires no more than an optically thick dust sample, could be employed to determine the region specific dust optical properties in mountain snow cover in remote regions like the Middle East, Central Asia and the Himalaya to improve radiative transfer and hydrologic modeling efforts.
In some areas organics, like algae and tree debris, also play a role in albedo decline (Winkler and others, Reference Winkler, Boon, Zimonick and Baleshta2010; Benning and others, Reference Benning, Anesio, Lutz and Tranter2014). This method, while it does not directly discriminate between dust and other impurity inclusions, assumes that dust dominates the impurity mass. This has been well established in this region, but in locations where organics are the dominant impurity, this method would not be appropriate given the variability in size, shape and optical properties of organic material.
Although the ultimate goal of this method was to improve the accuracy of radiative transfer modeling of snow containing dust, it may be useful in other applications, given that multiple groups worldwide have identified optical property characterization as the main missing component for understanding the climatic role of dust aerosols globally. Additionally, the development of this method facilitates an additional inversion technique to retrieve dust concentrations from a snow and snow containing dust reflectance library when the only snow albedo measurements are available, which has important implications for in situ and remote sensing retrievals in remote snow-covered environments.
ACKNOWLEDGEMENTS
We acknowledge Chris Landry/The Center for Snow and Avalanche Studies for maintenance of Swamp Angel Study Plot and data availability from the energy balance tower. We would like to thank Ian Delaney and Jeffrey Deems for their assistance with snow sample collection and observations, and Victoria Patterson for assistance in sample analysis. We would also like to thank Anne Nolin and another anonymous reviewer for their helpful comments, which improved the paper. This work was funded by the NASA project NNX10AO97G. Part of this work was performed at the Jet Propulsion Laboratory, California Institute of Technology under a contract from NASA.


 Open access