


Introduction
The Antarctic region represents the most important repository of ice on Earth. The Antarctic Ice Sheet contains more than 80% of all fresh water ice on land (Barry and Hall-McKim, Reference Barry and Hall-McKim2018), the Antarctic ice shelves are a major source of ocean fresh water storing ~380 000 km3 of ice (Fretwell and others, Reference Fretwell2013), sea ice cover oscillates seasonally between 3 and 19 million km2 playing a key role in the energy budget of the Southern Ocean (Serreze and Meier, Reference Serreze and Meier2019), and the glaciers in the Antarctic periphery account for 19% (133 000 km2) of the global glacier extent (RGI Consortium, 2017). The most prominent changes involve sea ice and the floating ice shelves and are driven by both atmospheric and ocean temperatures. Southern Ocean ice cover exhibits the largest seasonal fluctuations on Earth but little overall change in extent since 1979 (Slater and others, Reference Slater2021). Antarctic ice shelves and floating glacier tongues have lost 22.5 000 km2 between 1997 and 2018 (Baumhoer and others, Reference Baumhoer, Dietz, Kneisel, Paeth and Kuenzer2021), accounting for the largest reduction in the Earth's ice cover. The decrease is focused on the coast of the Antarctic Peninsula, where significant sections of ice shelves have collapsed in recent decades (Cook and Vaughan, Reference Cook and Vaughan2010). Although the loss of floating ice (shelves) decreases the planetary albedo (Thackeray and Hall, Reference Thackeray and Hall2019), and affects ocean circulation (Armitage and others, Reference Armitage, Manucharyan, Petty, Kwok and Thompson2020), it does not contribute to global sea-level rise. The sea level is raised by ice loss from the ice sheets and grounded glaciers (The IMBIE Team, 2018; Zemp and others, Reference Zemp2019), which also modulate oceanic circulation through fresh water input (Rahmstorf and others, Reference Rahmstorf2015).
The most prominent grounded ice decline in Antarctica has been reported for the Antarctic Peninsula and surrounding islands, where >90% of glaciers showed considerable loss of area since the late 1940s (Cook and others, Reference Cook, Vaughan, Luckman and Murray2014; Fieber and others, Reference Fieber2018). Glaciers retreated at accelerating rates until the end of the 20th century (Davies and others, Reference Davies, Carrivick, Glasser, Hambrey and Smellie2012) in parallel with one of the largest increases in near-surface air temperature on Earth (Turner and others, Reference Turner2005). The retreat rates slowed-down during the first decade of 21st century, when temperatures significantly decreased (e.g. Turner and others, Reference Turner2016; Oliva and others, Reference Oliva2017). As the cooling reversal terminated around the mid-2010s (Carrasco and others, Reference Carrasco, Bozkurt and Cordero2021), glacier surface area and mass have begun to decrease again (WGMS, 2021a). The recent mass losses from the peripheral glaciers of Antarctica are considered moderate compared with other glacierized regions (Zemp and others, Reference Zemp2019; Hugonnet and others, Reference Hugonnet2021), but the projected losses to the end of the 21st century are among the largest on Earth (Edwards and others, Reference Edwards2021). Hence, more research is needed to better constrain mass-balance assessments for glaciers around the Antarctic Peninsula, where in situ mass-balance measurements are available from only few glaciers. Moreover, mass-balance data have not yet been reported for small glaciers (with area <1 km2), which represent 60% of the 2752 glaciers in the Antarctic and sub-Antarctic region (RGI Consortium, 2017). As these small ice masses around the Antarctic Peninsula are rapidly melting (Simões and others, Reference Simões, Dani, Bremer, Aquino and Arigony-Neto2004; Gordon and others, Reference Gordon, Haynes and Hubbard2008; Pudełko and others, Reference Pudełko, Angiel, Potocki, Jędrejek and Kozak2018), their contribution to sea-level rise should be considered in spite of their individual small size (e.g. Bahr and Radić, Reference Bahr and Radić2012).
In order to obtain mass-balance data for the smallest category of glaciers in the Antarctic Peninsula region, we initiated glaciological observations and climate monitoring on Triangular Glacier with an area of 0.5 km2. Surface mass-balance measurements on this cirque glacier, at the north-western part of James Ross Island (JRI), have been realized annually since 2014. Additional geophysical and geodetic data have been collected during the subsequent field campaigns and meteorological conditions on the glacier have been recorded at automatic weather stations (AWS) during the period 2014–2020. In the present paper, we first analyse the evolution of Triangular Glacier during the last four decades using remotely sensed imagery, ground penetrating radar (GPR) data and differential global navigation satellite system (DGNSS) measurements. We then present the results of surface mass-balance monitoring, interpreting the observed changes in relation with in situ meteorological observations. Finally, we assess the glaciological and climatic findings within the regional context of the northern Antarctic Peninsula.
Study area
Triangular Glacier (GLIMS Glacier ID: G302151E63856S; IJR-39 in the inventory by Rabassa and others, Reference Rabassa, Skvarca, Bertani and Mazzoni1982) is located in the north-western part of JRI, which is situated ~20 km from the north-eastern coast of the Antarctic Peninsula and nearly 80 km from its northern tip (Fig. 1a). Neogene basalt plateaux with steep cliffs up to 300 m high surrounded by flatter slopes in Cretaceous sediments dominate the landscape of this part of JRI called the Ulu Peninsula, which is among the least glacierized areas in Antarctica. According to the first glacier inventory of JRI by Rabassa and others (Reference Rabassa, Skvarca, Bertani and Mazzoni1982), 31 small glaciers can be delimited northward from Whisky Bay and Shrove Cove. Most of these glaciers slowly recede, reflecting the post-glacial recession, ice surface lowering and detachment from plateaux accumulation areas (Carrivick and others, Reference Carrivick, Davies, Glasser, Nývlt and Hambrey2012). This is the case of Triangular Glacier in the western slope of Lachman Crags plateau (Fig. 1b). Headwall cliffs bound the upper part of this cirque glacier that descends along prominent ice-cored moraines to the south-west. The glacier is at an elevation range of 104–329 m a.s.l. and has a relatively steep surface with a mean slope of 17° (Davies and others, Reference Davies and Hambrey2013). By contrast, gentle slopes and braidplains prevail in the proglacial zone (Jennings and others, Reference Jennings2021).
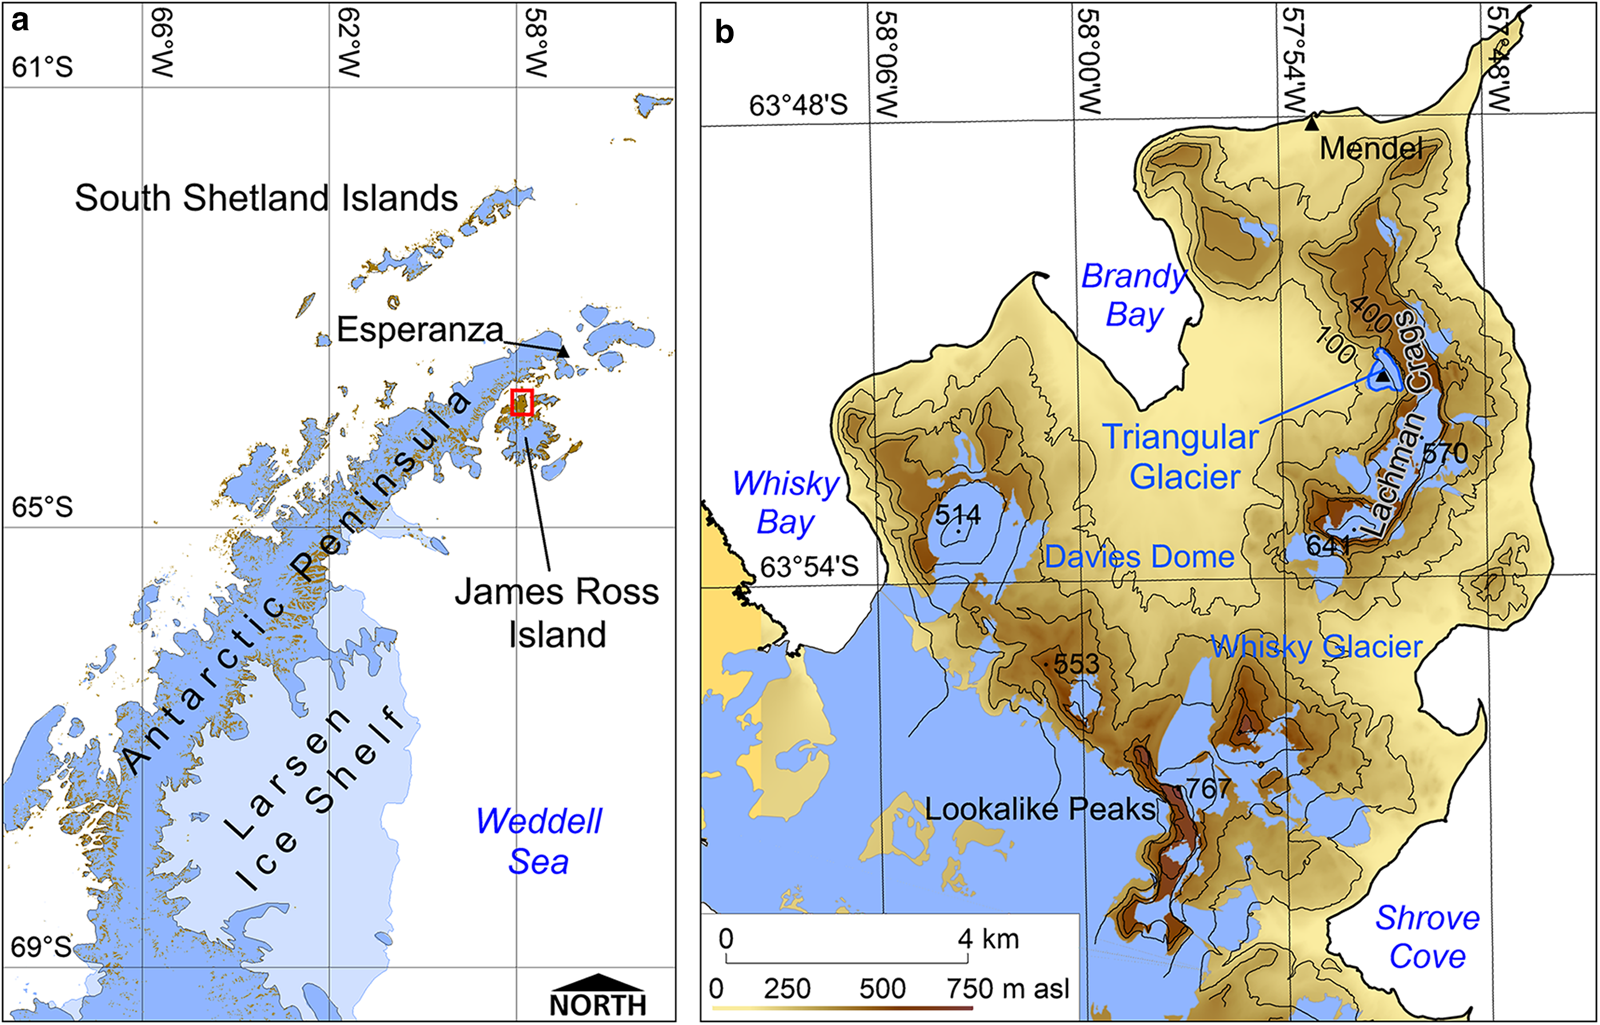
Fig. 1. (a) Location of James Ross Island and Esperanza Station (black triangle) in the north-eastern part of the Antarctic Peninsula with the study area marked in red. (b) Topography of the northern part of the Ulu Peninsula with the location of automatic weather stations at Triangular Glacier and Mendel Base (black triangles). Ice-free area on the Antarctic Peninsula after Burton-Johnson and others (Reference Burton-Johnson, Black, Fretwell and Kaluza-Gilbert2016).
Triangular Glacier is the smallest ice mass on the Ulu Peninsula, and its surface mass balance, derived from field measurements, is discussed in this paper. Other monitored ice masses in JRI are Davies Dome and Whisky Glacier (Fig. 1b), inventoried by Rabassa and others (Reference Rabassa, Skvarca, Bertani and Mazzoni1982) as IJR-39 and IJR-45, respectively. Their annual surface mass balance is estimated by the glaciological method, with measurements only once per year, which precludes determination of separate winter and summer balances. Detailed results of mass-balance monitoring on Davies Dome and Whisky Glacier for the period 2009/10–2014/15 were published by Engel and others (Reference Engel, Láska, Nývlt and Stachoň2018). Measurements from the next two glaciological years were presented by Láska and others (Reference Láska2018), while mass-balance data collected from 2015/16 to 2020/21 is under preparation for a separate publication.
Climate conditions in the study area are affected by the predominantly western circulation across the Antarctic Peninsula, the southerly barrier winds from the Antarctic interior and the sea-ice extent variations in the north-western sector of the Weddell Sea (King, Reference King1994; Turner and others, Reference Turner2016; Ambrožová and others, Reference Ambrožová, Láska and Kavan2020). The mean annual air temperature decreases from −7.0 °C at sea level to <−8.0 °C at high-elevation areas (Ambrožová and others, Reference Ambrožová, Láska, Hrbáček, Kavan and Ondruch2019). The modelled precipitation ranges between 300 and 700 mm in water equivalent (w.e.) per year (van Wessem and others, Reference van Wessem2016; Palerme and others, Reference Palerme2017). Snowfall occurs irregularly within a year and snow cover depth usually does not exceed 0.3 m in lowland areas (Hrbáček and others, Reference Hrbáček, Engel, Kňažková and Smolíková2021). Spatial variation in snow depth is determined mainly by the prevailing southerly to south-westerly winds (Kňažková and others, Reference Kňažková, Hrbáček, Kavan and Nývlt2020).
Methods
Glacier mapping
We used available aerial photographs and digital elevation models (DEM), selected satellite images and field mapping to determine the surface topography of Triangular Glacier since 1979. The former glacier extent was delineated using orthorectified aerial photographs from 1979 and 2006 and satellite images acquired in 2016 and 2020 (see details in Table 1). We digitized the former outlines manually because the upper part of the glacier is shadowed by the steep cirque headwall and its south-eastern section is debris-covered. The most recent extent of the glacier was determined in February 2021 based on field mapping. DGNSS measurements were used to determine the limit of the glacier including its highest section at the foot of the cirque headwall. The position of inflection points was recorded with a Trimble Geo7X roving receiver (Trimble Navigation Limited, 2013) and differentially corrected through postprocessing using the data collected at the reference station at Mandel Base (63°48′S; 57°53′W).
Table 1. Remote-sensing data used for delineation of Triangular Glacier

In addition to suitable optical data, we used photogrammetrically derived DEMs (Meixner, Reference Meixner2009), the Reference Elevation Model of Antarctica (Howat and others, Reference Howat, Porter, Smith, Noh and Morin2019) and the 2020 Pléiades DEM of the French Space Agency (CNES) to derive topographic characteristics of Triangular Glacier. We co-registered these source DEMs (e.g. Berthier and others, Reference Berthier2014) and clipped them to the reconstructed glacier extents generating ice surface DEMs for 1979, 2006, 2016 and 2020. Based on the resulting ice surface DEMs, we determined aspect, slope and surface elevation characteristics (terminus elevation, mean and maximum elevation) of Triangular Glacier for the relevant years. Changes of the glacier surface over time were analysed by the comparison of these DEMs, and the uncertainties associated with the observed changes were estimated following the procedures detailed by Hall and others (Reference Hall, Bayr, Schöner, Bindschadler and Chien2003) and Li and others (Reference Li2006). The calculated uncertainties in glacier area are listed in Table 2.
Table 2. Geometric changes of Triangular Glacier since 1979

Ground penetrating radar survey
GPR was used to determine the ice thickness and volume of Triangular Glacier. The GPR data were collected on 25 January 2017 along three profiles parallel to the glacier central line and five transverse profiles (Fig. 2). GPR profiling was carried out using an unshielded 50 MHz Rough Terrain Antenna and RAMAC CU-II control unit (MALÅ GeoScience, 2005). The triggering interval was set to 0.1 s and the GPR was man-hauled at a mean speed of ~3 km h−1, yielding one radar trace every ~0.01 m. A Garmin GPSMAP 60CSx receiver (Garmin International, 2007) was used to determine position for the corresponding trace numbers with a real-time horizontal accuracy of <5 m. The raw GPR data were processed applying an automatic gain function, background removal and topographic correction using ReflexW software v. 8.5 (Sandmeier, Reference Sandmeier2017). The glacier bed reflections were selected on radargrams by a phase follower tool and eventually relocated to the desired phase at the glacier bed. Two-way travel times were converted to depths assuming a radio-wave velocity of 168 m μs–1 reported by Narod and Clarke (Reference Narod and Clarke1994) for cold glacier ice.

Fig. 2. Location of ground penetrating radar profiles (black lines), automatic weather station (black triangle), accumulation and ablation stakes (black dots) on Triangular Glacier. Blue lines indicate evolution of the glacier since 1979. Aerial image (BAS/RN/06/0945, the British Antarctic Survey) shows a distinct snowline in the upper part of the glacier and an ice-marginal lake (light blue hatches) in front of its terminus in February 2006.
The uncertainty of GPR-retrieved ice thickness was estimated following the approach by Lapazaran and others (Reference Lapazaran, Otero, Martín-Español and Navarro2016a). The error in thickness retrieved from the GPR measurement was evaluated using a conservative estimate of vertical resolution (a half of the signal's wavelength in ice, i.e. 1.68 m for the 50 MHz antenna) and a relative error in radio-wave velocity of 2.4%, which corresponds to a range of velocity values from 166 to 170 m μs–1 (Engel and others, Reference Engel, Kropáček and Smolíková2019). We chose this narrow range since we anticipated only minor variations in density and water/air content in glacier ice. The positioning-related error was determined from the variability of ice thickness along and across the profiling direction. As the radar traces were positioned using GPS measurement in kinematic mode, we evaluated the maximum absolute value of the differences in thickness within a circle with a radius of 5 m. The variability of ice thickness along the profiling direction was calculated from the values picked for radar traces whereas the variability in the perpendicular direction was retrieved from the values interpolated between GPR profiles.
Ice volume assessment
The ice-thickness data retrieved from GPR measurements were interpolated over the glacier surface using a minimum curvature method. This interpolation technique has been selected as the most appropriate algorithm based on the cross-validation results and smooth surface of glacier bed (Engel and others, Reference Engel, Nývlt and Láska2012). The boundary of the glacier was determined from WorldView-2 data (Table 1) and the ice thickness along the limit was set to zero. The generated ice-thickness DEM provides the volume of Triangular Glacier in the summer of 2016/17. The summation of this value and the volumes arising from the differences between the available ice surface DEMs yields ice-volume estimates for the glacier in 1979, 2006 and 2020. In addition to the ice-thickness DEM, the glacier bed topography was modelled using the same set of ice-thickness data. The ice surface elevation for the GPR-derived data was adopted from the REMA strip file acquired on 11 September 2016 because this dataset has lower vertical error (<2.4 m; Howat and others, Reference Howat, Porter, Smith, Noh and Morin2019) than values measured with a GPS in kinematic mode during the GPR survey. The bed elevation for the GPR-derived ice-thickness points was derived by the subtraction of the ice thickness from the REMA-based surface elevation.
The uncertainty associated with the glacier volume determination was assessed in accordance with the guidelines recommended by Lapazaran and others (Reference Lapazaran, Otero, Martín-Español and Navarro2016b) and Martín-Español and others (Reference Martín-Español, Lapazaran, Otero and Navarro2016). The error arising from the interpolation of GPR data was analysed from the difference between the measured and interpolated values at GPR locations blanked with increasing circles. The increasing radius of blanking circles allows derivation of functions that relate an interpolation bias (mean error) and random error (std dev.) with distance. The obtained functions were used to calculate interpolation-related error at grid nodes of the ice-thickness DEM. This error was combined as the root of their squared summation with the GPR-related errors (described in the section above) propagated to the grid nodes. The overall quality of ice-thickness DEM was calculated as the root-mean-square value of the errors at the grid nodes and the degree of correlation among the ice-thickness errors was assessed using a variogram. Based on the best-fitting variogram model and the variogram range, the error in volume related with ice thickness was calculated using the equation for spherical model (Table 1 in Martín-Español and others, Reference Martín-Español, Lapazaran, Otero and Navarro2016). The resulting error was combined with the glacier boundary-related error as the root of their squared summation, yielding the total error associated with the glacier volume estimate for 2016/17. The error of the volume estimates for 1979, 2006 and 2020 results from the squared summation of the 2016/17 total error and the error arising from the vertical biases of co-registered DEM pairs (the product of glacier area and mean elevation difference of the DEMs). The mean elevation difference on the ice-free terrain between the REMA and the Pléiades DEM was 0.24 m; the remaining vertical shift of the 2006 and 1979 DEMs was of 0.19 and 0.27 m, respectively.
Surface mass-balance determination
Surface mass-balance monitoring of Triangular Glacier started in February 2014. The glacier has been visited once or twice per austral summer between late January and mid-February. The fieldwork includes mass-balance measurements and maintenance of accumulation and ablation stakes drilled into the glacier. Stakes are regularly distributed across its surface and its number has increased over the years from nine in 2014 to 12 since 2019. The position of the stakes was determined by DGNSS. The readings lasted 2 min at each stake, yielding a horizontal accuracy of 0.2–0.3 m after post-processing. Such accuracy is not critical for surface mass-balance studies but allows the ice surface velocity to be determined. The height of the stakes above the glacier surface is measured with an accuracy of ±0.01 m using a standard tape measure.
The height of the stakes was compared with the previous summer values and inter-annual differences were converted to metres in water equivalent (m w.e.). We used a zonally variable conversion approach (Huss, Reference Huss2013) that reflects variable density, for snow above the equilibrium line and glacier ice in the ablation zone. We converted the inter-annual height differences of the stake readings in the ablation and accumulation zones using densities of 900 and 500 kg m–3, respectively. Because the uncertainty in the mass-balance determination at individual stakes arises mainly due to local variations of snow density and thickness we applied a broad range of uncertainty (±90 kg m–3) to the snowpack density for the accumulation area (Engel and others, Reference Engel, Láska, Nývlt and Stachoň2018).
Subsequently, we integrated point balances over the entire glacier area generating annual gridded mass balance. The natural neighbour technique (de Smith and others, Reference de Smith, Goodchild and Longley2015) was selected as the most appropriate interpolation algorithm for our dataset based on the cross-validation results (see Engel and others, Reference Engel, Láska, Nývlt and Stachoň2018 for details). Based on the annual and cumulative gridded mass balances, equilibrium-line altitude (ELA) and accumulation-area ratio (AAR) values were determined for individual glaciological years within the period 2014/15–2019/20. The uncertainty of annual mass-balance values is quantified following the recommendations by Huss and others (Reference Huss, Bauder and Funk2009), and the uncertainty in cumulative mass balance is calculated as the std dev. for the observation period, and the mean values are reported with the standard error of the mean. Assuming negligible internal and basal mass balances, surface mass balance is equivalent to climatic mass balance (Cogley and others, Reference Cogley2011) and, given that Triangular Glacier terminates on land, it is also equivalent to total mass balance.
Surface weather observations
An AWS was installed in the middle part of Triangular Glacier (63.85650°S, 57.85096°W) at an elevation of 179 m a.s.l. in February 2014. Air temperature was measured 1.8 m above ground level using an EMS33H sensor (EMS, Czech Republic). Temperature data were acquired with an accuracy of ±0.15 °C and the measured values were recorded at hourly interval. We calculated daily, monthly and annual mean air temperatures over the period from February 2014 to February 2020. In addition, we applied a positive degree-day model for surface melt parameterization (Hock, Reference Hock2003), where the number of positive degree-days (PDD) is defined as the integral of positive air temperature (T) in °C over a time interval (A):

The annual sum of PDD was computed using Eqn (1) for individual glaciological years. The height difference between the snow surface and a sonic distance sensor (Judd Communication, USA) was measured with an accuracy of ±0.01 m. The observations were carried out at 4 h intervals over the period from 1 February 2017 to 31 January 2020. Raw sonic data were corrected based on actual air temperature measured at the AWS. The zero point level was chosen arbitrarily to be lower than the initial snow-cover surface during the first glaciological year. Finally, the recorded data were converted to relative snow height changes and classified as positive (snow height increase) and negative (snow height decrease) changes within the last 24 h. To investigate the deposition and removal of snow at the glacier surface, we applied relative snow height changes together with PDD criteria for the evaluation of the following processes: snow melt (snow height decrease, PDD > 0 K d−1) and snowdrift (snow height decrease, PDD = 0 K d−1), respectively.
In order to evaluate the variability of climate conditions in the northern Antarctic Peninsula region, we acquired monthly mean air temperatures from the Esperanza station (the nearest World Meteorological Organization observing station) available at the Reference Antarctic Data for Environmental Research (READER) archive (Turner and others, Reference Turner2005). We calculated mean annual air temperatures and the associated linear trends for individual decades in the period 1980–2019.
Results
Changes in glacier topography since 1979
Triangular Glacier has lost 0.3 km2 (36.6%) of its area over the past four decades receding at a mean rate of 0.007 km2 a−1 (−0.9% a−1). The glacier suffered most of its area loss (0.25 km2) during the period 1979–2006 (Figs 2, 3a) when it receded at a mean rate of 0.009 km2 a−1 (−1.1% a−1). In January 1979, the glacier was 0.94 km long, the snout reached the inner slope of lateral moraines and its south-eastern part extended along the western cliffs of Lachman Crags nearly 500 m to the south. The glacier extended over an area of 0.826 ± 0.021 km2 storing ~41.0 ± 0.9 million m3 of ice. The mean surface elevation was 204.9 ± 2.0 m a.s.l. During the next three decades, the glacier retreated from the foot of the west-facing cliffs to its current location taking its characteristic triangular plan view shape. The deglaciated terrain between the terminal moraine and the glacier snout has been occupied by a small ice-marginal lake that covered an area of ~13.4 000 m2 in February 2006. Over the period 1979–2006 the terminus retreated 60 m at a mean rate of 2.3 m a−1 (Table 2). The surface area of Triangular Glacier decreased to 0.571 ± 0.011 km2 losing almost one-third (−30.8%) of its previous extent. The ice volume dropped to <26.3 ± 0.6 million m3 (−35.8%) and the mean surface elevation decreased to 189.6 ± 0.8 m a.s.l.
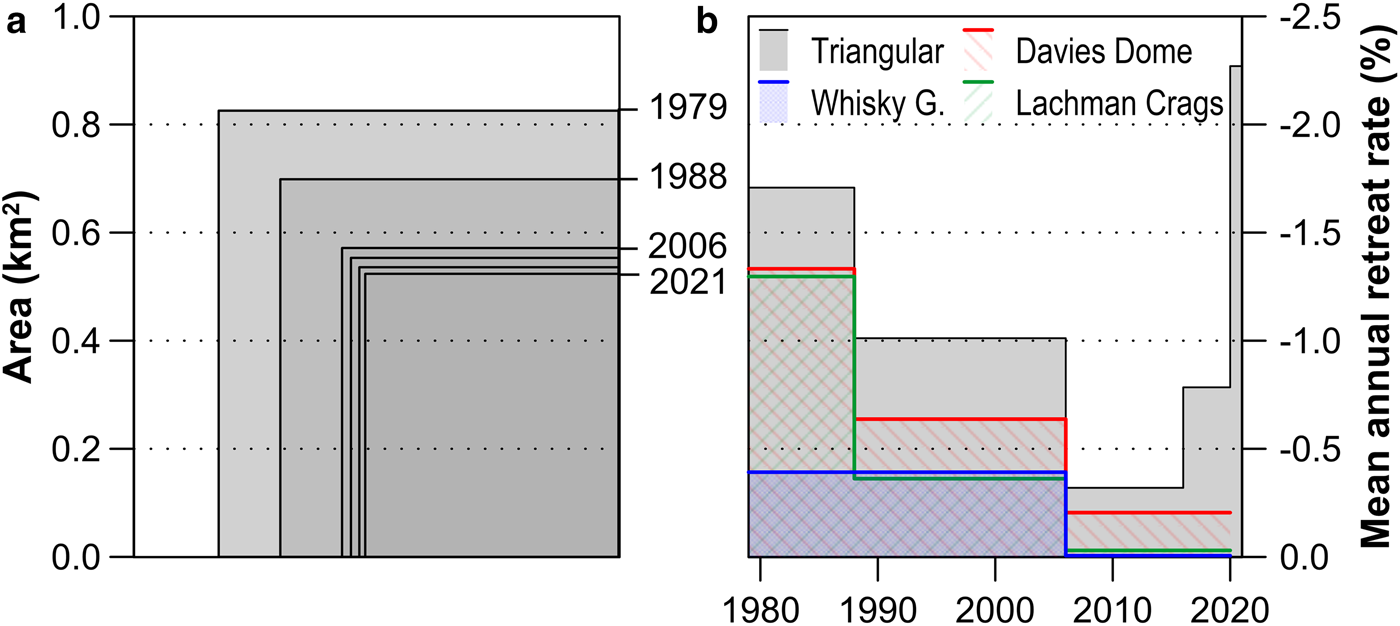
Fig. 3. (a) Surface area of Triangular Glacier over the period 1979–2021 (extent in 2016 and 2020 without labels). (b) Areal retreat rates of selected glaciers on the Ulu Peninsula. Extent of glaciers in 1988 after Davies and others (Reference Davies, Carrivick, Glasser, Hambrey and Smellie2012). Data for Davies Dome, Whisky Glacier and Lachman Crags adopted from Engel and others (Reference Engel, Nývlt and Láska2012, Reference Engel, Kropáček and Smolíková2019).
After the summer of 2005/06, the glacier recession and surface lowering slowed down substantially. The surface area diminished at a mean rate of 0.002 km2 a−1 (−0.3% a−1) over the period 2006–2016, to 0.553 ± 0.019 km2 in the summer 2016/17. The mean rate of area change doubled (−0.004 km2 a−1 or −0.8% a−1) until the summer of 2019/20 and then increased to −0.012 km2 a−1 (−2.3% a−1) over the next year (Fig. 3b). During the latter period, the most prominent retreat was observed at the glacier terminus, where the ice-marginal lake dammed by the terminal moraine steadily expanded. The lake occupied an area of ~19.1 000 m2 in January 2020 and increased to 28.4 000 m2 in the late summer 2020/21. In February 2021, Triangular Glacier covered an area of 0.524 ± 0.004 km2 and its length was of 0.79 km (Table 3). The glacier terminus receded 86 m over the period 2006–2021 yielding a mean retreat rate of 5.7 m a−1. The mean surface elevation of the glacier changed within its uncertainty values from 2005/06 to 2019/20 and the same applies for the ice volume. The mean ice thickness determined from the GPR survey in January 2017 was of 46.2 ± 3.7 m and the maximum measured thickness of 103.1 ± 2.4 m was found close to the central flowline ~300 m from the upper glacier limit (Fig. 4a). The uncertainty in ice thickness ranged between 1.1 and 6.8 m, with a mean value of 2.8 m and a std dev. of 1.0 m (Fig. 4b).

Fig. 4. (a) Ice-thickness uncertainty, (b) glacier thickness and (c) glacier surface elevation (blue contours) and terrain and glacier bed elevation (brown contours).
Table 3. Spatial characteristics of Triangular Glacier (IJR-39) in 2021

The ice thickness refers to January 2017 when the GPR survey was realized.
Mass balance during the period 2014/15–2019/20
Annual mass balance has been negative during the observation period except for its first year, 2014/15, when a slightly positive, nearly-zero value of 0.04 ± 0.39 m w.e. was determined (Table 4). The mass-balance for 2018/19, −0.08 ± 0.35 m w.e., was also nearly zero. The mass-balance values for the remaining glaciological years of the observation period ranged from −0.22 to −0.56 m w.e. indicating persistent loss of glacier mass. The cumulative mass balance of −1.66 ± 0.83 m w.e. confirms the net mass loss of Triangular Glacier over the period 2014/15–2019/20. The high uncertainty calculated for the cumulative mass balance results from relatively large annual uncertainties that range from 0.13 to 0.50 m w.e. The largest uncertainty, corresponding to the 2016/17 mass balance (−0.34 ± 0.50 m w.e.) reflects the reduced number of point balances that were available for interpolation. The limited input arises from the intense surface melting on the glacier during the warm summer 2016/17, when most of the ablation stakes were lost.
Table 4. Annual surface mass balance, equilibrium-line altitude (ELA) and accumulation-area ratio (AAR) of Triangular Glacier during the period 2014/15–2019/20

The spatial distribution of the annual mass balance reveals two distinct features: an elevation pattern and an asymmetry along the central flowline of the glacier (Fig. 5). The elevation pattern preconditioned by the altitudinal gradient in air temperature is further enhanced by the shadow effect that cools temperatures at the foot of cirque headwall and protects the upper part of Triangular Glacier from direct solar radiation during summer mornings. The asymmetry in the mass-balance distribution is indicated by more negative mass-balance values in the north-western part of the glacier snout compared to its south-eastern margin. This feature is probably controlled by the slope orientation as the north-western part of the glacier is more exposed to the sun. The effect of elevation is visible in the mass-balance distribution throughout the observation period but it is more pronounced for the glaciological years 2015/16, 2016/17 and 2019/20, when annual mass balance was more negative. By contrast, the asymmetric pattern prevails in the surface mass-balance distribution for the less negative glaciological years 2014/15 and 2018/19, indicating the influence of snow accumulation on the mass-balance pattern.

Fig. 5. Annual mass balance (in m w.e.) of Triangular Glacier during the period 2014/15–2019/20.
The glacier zone with positive cumulative balance over the observation period (Fig. 6) coincides with the mean snow-covered zone at the end of the austral summer. The snow cover is restricted to the upper part of the glacier shadowed by the cirque headwall. The snow usually descends along the central flowline to get finally accumulated on the less inclined part of the glacier ~200 m a.s.l. The resulting delta shape pattern of the snow cover was observed during most of the field seasons and it is also clearly visible on available aerial and satellite images acquired during the late summer (Fig. 2). The relative stability of the pattern suggests that the distribution of snow on Triangular Glacier is influenced by constant factors such as the shadow effect and the prevailing wind. The enhanced accumulation of snow on the less steep central part of the glacier reveals the significance of snowdrift and/or decreased melt of the thicker snow cover at this zone.

Fig. 6. Cumulative mass balance (in m w.e.) of Triangular Glacier over the period 2014/15–2019/20.
The annual ELA ranged from 191 to 261 m except for the glaciological year 2015/16, when the complete glacier surface was affected by ablation (Table 4). Considering the ELA above the upper limit (329 m) of the glacier in this markedly negative mass-balance year, the arithmetic mean of six annual values yields a mean value of 232 m. This value is consistent with the mean ELA of 229 m determined from the cumulative mass-balance grid, representing a realistic estimate of the mean ELA over the observation period. The AAR values determined for individual glaciological years range from zero to 0.48, with an average of 0.27. Zero and nearly-zero AAR was determined for the glaciological years 2015/16 and 2019/20, respectively.
Climate conditions
The mean annual air temperature at Triangular Glacier was −6.0 °C for the period 2014–2020, with a maximum of 14.8 °C on 9 February 2020 and a minimum of −31.6 °C on 4 September 2017 (Fig. 7). The highest mean annual air temperature of −4.2 °C was recorded in 2016, while the minimum temperature of −7.0 °C was obtained in 2015. The annual cycle of air temperature is apparent over the entire period, with the highest monthly mean temperatures for the summer period ranging between 1.4 °C (January 2020) and −2.6 °C (February 2019), and the lowest monthly mean temperatures for the winter period between −7.5 °C (June 2016) and −19.8 °C (August 2020). In the warmest year 2016, exceptionally high monthly temperatures (4 °C above the long-term average) were recorded from May to July and from September to October. The annual sum of PDD ranged between 208.6 K d−1 for the glaciological year 2015/16 and 364.1 K d−1 for the year 2016/17 (Fig. 7). The year 2019/20, with a PDD sum of 331.3 K d−1, a mean annual air temperature of −5.4 °C and a mean summer air temperature of 0.5 °C, was the second warmest year in the observation period. The annual average sum of PDD was 275.4 K d−1 over the entire period.

Fig. 7. (a) Variation of monthly mean air temperature recorded at Triangular Glacier from February 2014 to February 2020. (b) Mean summer (DJF) and annual (AT) air temperature and annual positive degree-day (PDD) sum during the period 2014/15–2019/20.
Changes of snow height from February 2017 to January 2020 are shown in Figure 8a. The recorded snow height roughly varied between 0.5 m (January to February) and 1.3 m (September to October), with a minimum of 0.44 m (23 January 2020) and a maximum of 1.51 m (6 October 2017). A gradual increase in the height of the snow cover occurred every year from March to October with an average accumulation of 0.12 m per month. A prominent decrease of snow height was observed from 3 November 2017 to 9 December 2017 as a result of snow melt driven by advection of relatively warm air with daily maximum temperature up to 6 °C. However, both increase and decrease of snow height can be observed throughout the year (Fig. 8b). The daily rate of snow height increase is mostly lower than 0.2 m d−1. The maximum values were recorded during the heavy snowfall on 4−6 October 2017 (0.44 m), 12−13 January 2018 (0.31 m) and 14−15 November 2018 (0.24 m). Daily rates of snow height decrease by snowmelt or snowdrift varied between 0.01 and 0.14 m.

Fig. 8. (a) Snow height changes and (b) daily rate of snow height increase and decrease at Triangular Glacier from February 2017 to January 2020.
The annual sums of snow height changes are summarized in Figure 9. The highest snow height increase was found in the glaciological year 2017/18, when the annual sum yields 3.97 m. Since 2017/18, the annual sums decreased by ~0.5 m (12% of the total sum) each year. The snow height decreased from 4.2 m in the period 2017/18 to 347 and 3.35 m in 2018/19 and 2019/20, respectively. Snow melt accounts for 53–62% (57% on average) of snow height decrease with year-to-year changes varying between 1.27 and 1.29 m. Snow drift represents ~43% of snow height decrease with the highest rate of 47% in 2017/18. Net snow height decrease prevailed on Triangular Glacier in 2019/20 (−0.37 m) and 2017/18 (−0.22 m) while a small increase (2 mm) was found in 2018/19.

Fig. 9. Cumulative snow height changes at Triangular Glacier over the period 2017/18–2019/20.
Discussion
Variable glacier recession around the northern Antarctic Peninsula
The mean annual retreat rates (0.002–0.012 km2 a−1) determined for Triangular Glacier are well within the range of values reported by Davies and others (Reference Davies and Hambrey2013) for cirque glaciers on the Ulu Peninsula (0.000–0.017 km2 a−1). Similar retreat rates (0.005–0.008 km2 a−1) during the last two decades of the 20th century were also determined for cirque glaciers on King George Island (Simões and others, Reference Simões, Dani, Bremer, Aquino and Arigony-Neto2004). The retreat rates obtained for Triangular Glacier represent area changes that range from −0.3 to −2.3% a−1. The comparison of these values with area changes experienced by different types of glaciers indicates particularly rapid recession of cirque glaciers (Fig. 3b). Triangular Glacier receded more rapidly than adjacent plateau ice domes on Lachman Crags (−0.03 to −1.3% a−1), nearby valley glacier IJR-45 (−0.01 to −0.4% a−1) and Davies Dome plateau glacier with marine-terminating outlet (−0.2 to −1.3% a−1). The mean retreat rates over periods exceeding 5 years culminated during the 1980s and then gradually decreased until 2016. This is consistent with the findings by Davies and others (Reference Davies, Carrivick, Glasser, Hambrey and Smellie2012) who reported regional decline in retreat rates of land-terminating glaciers between 1988 and 2009. The recession of Triangular Glacier was accompanied by the growth of the ice-marginal lake that doubled its surface area between 2006 and 2021. The observed increase of the original lake surface area falls within the lower range of growth values (110–636%) determined over the period 1988–2018 for ice-marginal lakes on King George Island (KGI) in the north-western Antarctic Peninsula (de Oliveira and others, Reference de Oliveira2021).
The increase in the retreat rate of Triangular Glacier since 2016 has been accompanied by more negative mass balances throughout the period 2015/16–2019/20, indicating renewed mass loss in the north-western JRI. The initial evidence of the change in mass-balance trends was given by Engel and others (Reference Engel, Láska, Nývlt and Stachoň2018), who reported slightly negative surface mass balance for Davies Dome in the mass-balance year 2014/15. Other observed glaciers in the region experienced mass gain during this glaciological year (Marinsek and Ermolin, Reference Marinsek and Ermolin2015; Engel and others, Reference Engel, Láska, Nývlt and Stachoň2018) that is consistent with the minimum surface melt and runoff from glaciers reported by Costi and others (Reference Costi2018) for 2014. The return from predominantly positive to negative mass balances in the north-eastern Antarctic Peninsula occurred no later than 2015/16 as indicated by negative mass-balance values reported for Whisky Glacier (Láska and others, Reference Láska2018) and Bahía del Diablo glacier on nearby Vega Island (WGMS, 2021b). The timing of the change in mass-balance trends in the north-eastern Antarctic Peninsula occurred a year earlier than in the South Shetland Islands (SSI, Fig. 10), where mass gain was observed even in 2015/16 (Mavlyudov, Reference Mavlyudov and Kotlyakov2016; WGMS, 2021b). The difference in the timing of mass-balance changes may be attributed to the variation in climate and oceanographic parameters and/or to the different response of glaciers north and east from the Antarctic Peninsula to these parameters (Davies and others, Reference Davies, Carrivick, Glasser, Hambrey and Smellie2012; Navarro and others, Reference Navarro, Jonsell, Corcuera and Martín-Español2013).

Fig. 10. Comparison of annual (bar chart) and cumulative (line chart) mass-balance values for Triangular Glacier with mass-balance records in the northern Antarctic Peninsula region. Data for Bahía del Diablo, Hurd and Johnsons Glaciers from the WGMS (2021b).
The cumulative mass loss of −1.66 m w.e. calculated for Triangular Glacier over the period 2014/15–2019/20 may differ from the real value due to the relatively large uncertainty. However, the comparison with the mass-balance values reported annually for Bahía del Diablo glacier (WGMS, 2021b) supports the validity of the mass deficit reported here. Both glaciers reveal comparable annual values during the 6-year period (Fig. 10) yielding cumulative mass loss values that differ only by 0.17 m w.e. (10%). In contrast, the mean annual mass loss from Triangular Glacier over the 6-year period analysed (−0.27 ± 0.09 m w.e. a−1) is higher by a factor of three than the regionally averaged value reported by Hugonnet and others (Reference Hugonnet2021) for Antarctic peripheral glaciers over the period 2015–2019. The negative mass balance of the glaciers on the eastern side of the Antarctic Peninsula is in contrast with the mass-balance series reported by WGMS (2021b) for the SSI located across the Peninsula ~180 km to the north-west. Glaciers on this archipelago had more positive annual mass-balance values and an overall mass gain over the period 2014/15–2018/19. The contrasting mass balances confirm different climate conditions and/or controls of glacier mass changes on opposite sides of the northern Antarctic Peninsula (Arigony-Neto and others, Reference Arigony-Neto, Kargel, Leonard, Bishop, Kääb and Raup2014; Oliva and others, Reference Oliva2017; Seehaus and others, Reference Seehaus, Cook, Silva and Braun2018).
The mean ELA of 232 m determined for Triangular Glacier from the mass balance over the period 2014/15–2019/20 is considerably higher than the value of 180 m reported by Davies and others (Reference Davies and Hambrey2013). The deviation of the reported value may be attributed to its calculation from the hypsometric curve without validation against mass-balance data (Davies and others, Reference Davies, Carrivick, Glasser, Hambrey and Smellie2012). The mean ELA of Triangular Glacier for the period 2014/15–2019/20 coincides with the mean elevation of 221 m derived for the snowline at the end of the summer 2005/06 (Fig. 2). This snowline approximates ELA before the onset of the predominantly positive mass-balance period 2009/10–2014/15, during which the ELA probably decreased. Considering the difference in ELAs derived by Davies and others (Reference Davies and Hambrey2013) for Triangular and IJR-45 glaciers (270 m), and the ELA of 311 m determined for the later glacier from the mass-balance data (Engel and others, Reference Engel, Láska, Nývlt and Stachoň2018), the ELA of Triangular Glacier probably descended below 220 m during the period 2009/10–2014/15. It seems likely that the ELA will rise closer to the upper limit of Triangular Glacier if the recent trend in the mean annual air temperature in the north-western JRI continues.
The low annual and mean AARs calculated for Triangular Glacier are within the range of values reported for glaciers in the north-eastern Antarctic Peninsula and mostly lower than the AAR of monitored glaciers on the SSI (Mavlyudov, Reference Mavlyudov and Kotlyakov2016; WGMS, 2021b). In 2014/15, the AAR of 0.48 derived for Triangular Glacier was centred between the values of 0.23 and 0.73 reported by Engel and others (Reference Engel, Láska, Nývlt and Stachoň2018) for IJR-45 glacier and Davies Dome, respectively. In the same year, the accumulation area reached a similar ratio at Bahía del Diablo Glacier (0.52) on Vega Island but spread over the entire surface of Hurd and Johnsons Glaciers in the north-western Antarctic Peninsula (WGMS, 2021b). During the next 4 years, the AAR determined for Triangular Glacier was mostly lower than the values reported in the WGMS database (2021b) for the monitored glaciers in the Antarctic Peninsula region.
Reasons for rapid mass loss of Triangular Glacier
The rapid recession of Triangular Glacier at the end of the 20th century reflects the strong warming trend in the northern Antarctic Peninsula reported by, e.g. Vaughan and others (Reference Vaughan2003) and Turner and others (Reference Turner2005). The decrease in retreat rates during the period 2006–2016 is in accordance with the temporary cooling at the turn of the millennium (Turner and others, Reference Turner2016) that slowed-down glacier recession in the northern Antarctic Peninsula including JRI (Davies and others, Reference Davies, Carrivick, Glasser, Hambrey and Smellie2012; Oliva and others, Reference Oliva2017; Lippl and others, Reference Lippl2019). The subsequent acceleration of Triangular Glacier retreat rates coincides with the prominent increase in summer and mean annual air temperature along the eastern coast of Antarctic Peninsula. The temperature records from Triangular Glacier (Fig. 7) and Esperanza station (Fig. 11) suggest the timing of the change in temperature trends around 2014.

Fig. 11. Variation of mean annual air temperature at Esperanza station in the period 1980–2019. The broken line indicates the linear trend for the annual temperature over the entire period. The temperature data were obtained from the Reference Antarctic Data for Environmental Research (READER) database (Turner and others, Reference Turner2004).
A linear regression analysis between PDD and annual mass-balance characteristics suggests a pronounced response of Triangular Glacier to air temperature. Mass-balance and AAR values decreased with increasing sum of PDD over the period 2014/15–2019/20, while ELA shows a positive correlation with PDD. The scatter plots between annual sum of PDD and the selected parameters (Fig. 12) show high correlations with coefficients of −0.91 (annual mass balance), −0.98 (AAR) and 0.91 (ELA). The glaciological observations for 2016/17 are not included in the regression analysis due to their high uncertainties. We are aware that the number of observations presented here is limited and does not allow for a representative analysis and for inferring well-sustained outcomes. However, it can be used as a first approach for further investigations covering a longer period.

Fig. 12. Relationship between cumulative sum of positive degree-day (PDD) and (a) surface mass balance (SMB), (b) accumulation area ratio (AAR) and (c) equilibrium-line altitude (ELA) for Triangular Glacier over the period 2014–2020. The value for the glaciological year 2016/17 represented by an open circle is not considered in the regression analysis.
Despite the simplicity of the PDD model, which does not consider, e.g. the shading effect of the nearby mountains or the meltwater percolation in the snowpack (Hock, Reference Hock2003), glacier mass balance and air temperature records are closely related. The sensitivity of Triangular Glacier to air temperature changes is in line with previous studies from the north-eastern side of Antarctic Peninsula that suggest a pronounced response of glaciers to air temperature and lower sensitivity to snowfall (Abram and others, Reference Abram2013). In situ measured data in the north-western Antarctic Peninsula have shown that, depending on the particular year, either summer temperature decrease (controlling summer mass balance) or winter solid precipitation increase (controlling winter balance), or a combination of both, has been the drivers of the positive changes in annual surface mass balance observed during the regional cooling period (Jonsell and others, Reference Jonsell, Navarro, Bañón, Lapazaran and Otero2012; Navarro and others, Reference Navarro, Jonsell, Corcuera and Martín-Español2013). The validity of these findings for Triangular Glacier remains unknown as separate summer and winter balance estimates are not available.
The net snow height changes measured in the central part of Triangular Glacier are consistent with the variation in glacier mass balance and ELA during the period 2017/18–2019/20. A small net snow height increase was recorded in 2018/19 when the glacier mass balance was close to zero and the ELA was apparently low (see Fig. 9 and Table 4). Similarly, the largest net snow height decrease in 2019/20 coincides with the most prominent mass loss and the highest ELA over the study period. Annual net changes determined from sonic measurements are ~40% lower compared with annual mass balance calculated from ablation stakes at the same altitude. The difference probably results from the enhanced snow accumulation along the central flowline of the glacier and variations in snow density over the year (e.g. Jonsell and others, Reference Jonsell, Navarro, Bañón, Lapazaran and Otero2012).
The heavy snowfall observed on Triangular Glacier in the spring and summer seasons is well within the frequency and seasonality of extreme precipitation events related with incursions of moist air from the north (Turner and others, Reference Turner2019). Nevertheless, the observed snow accumulation on Triangular Glacier was lower than the snowfall totals reported for King George Island (Pudełko and others, Reference Pudełko, Angiel, Potocki, Jędrejek and Kozak2018; Plenzler and others, Reference Plenzler, Budzik, Puczko and Bialik2019) or Livingston Island (Jonsell and others, Reference Jonsell, Navarro, Bañón, Lapazaran and Otero2012; de Pablo and others, Reference de Pablo, Ramos and Molina2017). The differences in the reported values confirm the contrasting climate conditions between the regions north-west and north-east of the Antarctic Peninsula (Vaughan and others, Reference Vaughan2003). Moreover, annual snow height changes calculated for Triangular Glacier suggest that snow ablation prevailed over snowfall, similarly as in the 1990s (van Lipzig and others, Reference van Lipzig, King, Lachlan-Cope and van den Broeke2004; Leeson and others, Reference Leeson2017). The glacier surface decreased mostly by melt, but snowdrift and removal by wind was also significant, accounting for 43% of the total snow height decrease. These findings confirm that wind transport can be particularly effective (van Lipzig and others, Reference van Lipzig, King, Lachlan-Cope and van den Broeke2004) and should be taken into account in mass-balance assessments for glaciers in coastal regions of the Antarctic Peninsula.
Conclusions
The evolution of Triangular Glacier since 1979 and its mass changes during the period 2014/15–2019/20 indicate the high sensitivity of small glaciers in the northern Antarctic Peninsula region to air temperature variations. The glacier receded rapidly during the period of regional warming in the late 20th century, losing nearly one-third of its surface area between 1979 and 2006. The recession slowed-down markedly during the subsequent cooling period, reaching the minimum retreat rates observed over recent decades. Following the transition from cooling to warming conditions in 2014/15, the retreat rates started to increase again and the glacier has experienced sustained mass loss since then.
The recent mass-balance data of Triangular Glacier confirm the termination of the predominantly positive mass-balance period in the north-eastern Antarctic Peninsula and SSI in the early 21st century. Its slightly positive mass balance for the glaciological year 2014/15 is in agreement with the mass gains reported for glaciers in this region. Since 2015/16, this glacier has suffered persistent mass loss with mass-balance values ranging from −0.08 ± 0.35 to −0.56 ± 0.25 m w.e., yielding a cumulative mass balance of −1.66 ± 0.83 m w.e. over the period 2014/15–2019/20. The return to glacier mass loss in the eastern part of the Antarctic Peninsula coincides with the observed change in the regional temperature trends.
The mass-balance changes can be mostly explained by melt-season temperatures, as indicated by the close relationships between PDD and annual mass balance, ELA and AAR values. Intense warming in the glaciological year 2019/20, with a PDD sum of 331.3 K d−1 and a mean summer air temperature of 0.5 °C, resulted in the largest observed mass loss of −0.56 ± 0.25 m w.e. Snow height changes at Triangular Glacier suggest that glacier surface decreased mostly by snow melt, but wind transport of snow was also important, accounting for 43% of the total snow height decrease.
Data availability
The Reference Elevation Model of Antarctica is available from https://doi.org/10.7910/DVN/SAIK8B and mass-balance records for glaciers on the SSI from https://doi.org/10.5904/wgms-fog-2021-05. The Pléiades stereo-pair used in this study was provided by the Pléiades Glacier Observatory initiative of the French Space Agency (CNES).
Acknowledgements
We thank Daniel Nývlt, Jakub Ondruch, Zdeněk Stachoň, Peter Váczi and the crew at Mendel Base for fieldwork support. We are grateful to Francisco Navarro for his useful comments that helped to improve the manuscript. The research was funded by the Czech Science Foundation (project no. GC20-20240S) and the Ministry of Education, Youth and Sports (projects LM2015078 and VAN 2021).


 Open access