


Introduction
After a slab avalanche releases, an effort is often made to reach the starting zone of the slab in order to inspect the snow in the vicinity of the slab fracture surfaces. This inspection usually reveals important dues which pertain not only to the specific avalanche under investigation, hut also to possible widespread stability problems that may be expected as the avalanche season progresses. More fundamentally, many avalanche scientists believe that systematic and quantitative information from the starting zone will lead to an improved theory of avalanche forecasting.
Our earlier study (Reference PerlaPerla, 1977) summarizes 205 fracture-zone investigations made in a wide variety of mountain ranges and corresponding climates. In this paper we present 30 additional investigations made in British Columbia at the Whistler Mountain ski area, one of Canada’s largest ski areas, and the Canadian ski area with the most extensive avalanche control programme. Reference Stethem and HetheringtonStethem and Hetherington (1978) describe the Whistler climatology, avalanche hazard, and avalanche control programme. Over 90% of the Whistler slab hazard is in response to heavy snow-fall and involves the most recent layers of snow. However, our 30 investigations are biased by a high proportion of slabs consisting of older, metamorphosed snow, essentially the deeper and more insidious slabs. The study is also biased exclusively towards dry slabs and does not include any of the numerous wet slabs that release late in the spring.
We measured the same parameters that are summarized by Reference PerlaPerla (1977), except that we omitted the time-consuming shear-frame measurements. We introduced a new technique for photomicrography of snow crystals extracted from layers that coincided with, as near as we could estimate, the layers of critical weakness at the slab’s lower boundary.
Terminology
Figure 1 shows an idealized cross-section of the slab’s crown region, that is, the region of the upper tensile fracture. The main sliding surface is a convenient reference plane which we call the bed surface. We envision this plane to extend beneath the crown, thus forming in our terminology a bed-surface extension. Ideally, the main shear weakness, which is a layer of finite thickness, also extends beneath the crown at a level immediately above the bed-surface extension. We call this weak layer the gleitschicht, preserving the German terminology fig.1. introduced in the Swiss avalanche literature. The idealization of Figure 1 is probably an oversimplification of nature. In many cases, the weak layer appears to have noticeable thickness below the bed-surface extension, and in some cases seems to include the entire substratum to the ground level.
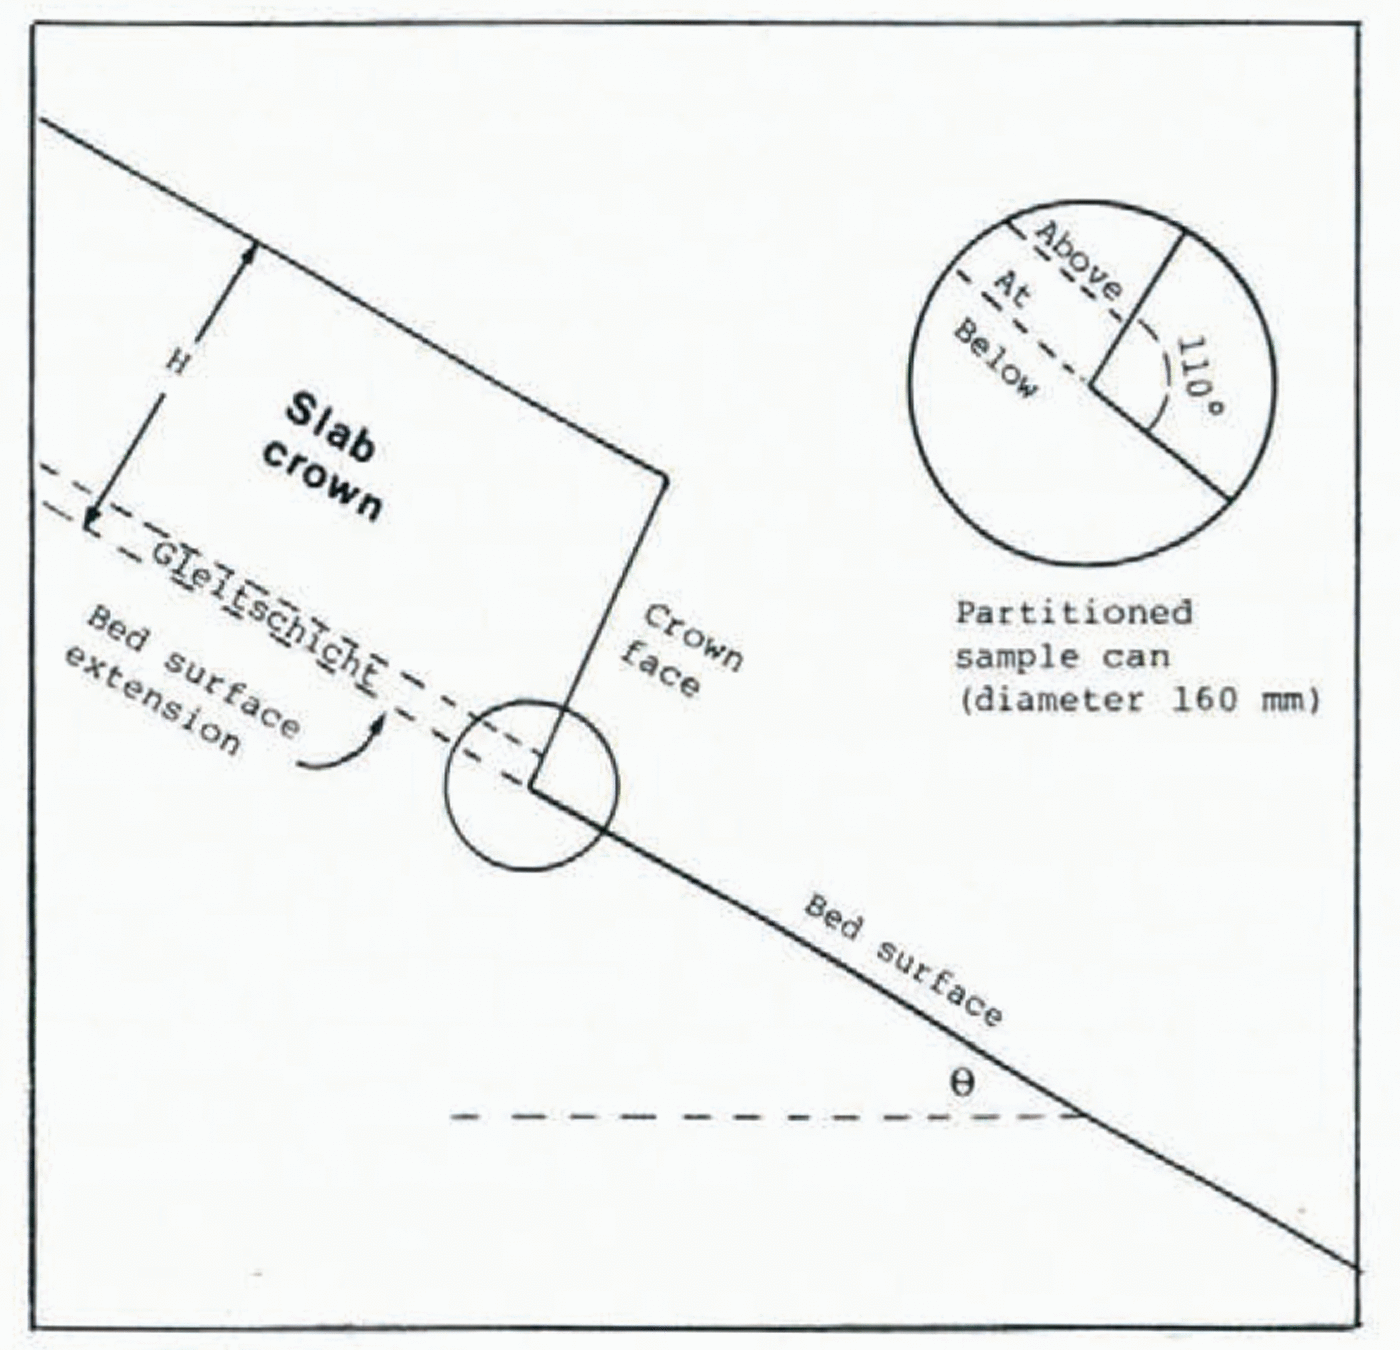
Fig. 1. Idealization of crown region.
The slab crown is characterized by a thickness H, and a mean density ρs, averaged over the thickness H. The bed surface is characterized by its inclination θ, measured immediately down-slope from the centre of the crown. The bed-surface extension is characterized by a temperature TB, and a density index ρB. The latter is more precisely the density index of the layer that is immediately above the bed-surface extension. Presumably ρB is a reasonable density index of the gleitschicht, or at least the upper portion of the gleitschicht.
Methods: Slab Measurements
Investigations were made as soon as possible after avalanche release. For 22 of the 30 investigations, elapsed time from avalanche release to measurement was 5 h or less. The remaining 8 investigations were postponed until the day following the avalanche with elapsed times ranging from 12 to 28 h. The index that loses meaning fastest with increasing elapsed time is TB. This measurement was not included in the study if the elapsed time exceeded 5 h. TB was measured in a pit excavated at least 0.5 m up-slope from the crown face in order to sample a portion of the bed-surface extension that was relatively free from thermal disturbance.
Slab density ρs was measured by weighing cylindrical samples, diameter 0.18 m and height 0.4 m, cut from the crown across the entire slab layer. This weighing was performed in situ.
The density index ρB of the layer above the bed surface extension was obtained by cutting out a rectangular sample 20 mm thick by 100 mm wide by 100 mm long. Three samples were Cut out for each investigation. These were placed in plastic bags and transported to a sheltered location where they were weighed on a triple-beam balance and averaged. Because of inclement weather, this delicate measurement was taken for only 8 of the 30 investigations. It can be argued that the measurement of ρB should be made by cutting as thin a sample as possible, but we found in preliminary studies that sampling errors increased by about a factor of five (from 2% to 10%) when the sample thickness was decreased from 20 mm to 10 mm.
To complete our records, the avalanche event was sized as either small, medium, or large, depending on a rough, subjective estimate of the destructive capability of the event. A small avalanche is capable of injuring an unprotected human; a medium avalanche can destroy a wood-frame house or auto; a large avalanche has enough capacity to destroy a village or a forest.
Results: Slab Measurements
Table I shows the results of the 30 Whistler investigations. Means and standard deviations of H, θ, ρs, ρB, and TB are summarized in Table II, and compared with results from our earlier study (Reference PerlaPerla, 1977)- The means from the two studies arc in close enough agreement Table. I. that we feel our earlier conclusions remain valid. In particular, the following conclusions from Reference PerlaPerla (1977) are strengthened by the Whistler results:
Table I. MEASUREMENTS TAKEN AT FRACTURE LINE (see text for explanation)

1. Less than 1% of all slab avalanches initiate where the slope angle is less than 25°.
2. Less than 5% of all slab avalanches initiate where the slope angle is less than 30°.
3. The average shear stress at the bed surface prior to failure is in the range of 102-104N/m2
4. The most prevalent bed-surface temperature is in the band – 5°C to 0°C.
5. Over 95% of all slab avalanches have a bed-surface temperature of –10°C or warmer.
Note that emphasis is placed on the minimum distribution of θ values. Relevance of the mean value of θ is open to question since many slab avalanches are initiated by smaller snow masses descending from steeper terrain (cliff bands, chutes).
One factor that is not the same in the two studies is the ratio of failure shear stress at the bed surface to the bed-surface density. In the Whistler study, the mean shear stress at the bed surface (ρsgH sin θ) is almost 50% larger than the mean shear stress reported earlier because the separate factors ρs, H, and θ are larger. What is interesting is that the Whistler mean ρB is lower. Although the Whistler sample size of ρB is too small (only 8 samples) to lead to confident conclusions, the drop in ρB relative to ρsgH sin θ could be explained by the fact that the earlier 72 measurements of ρB summarized by Reference PerlaPerla (1977) were obtained with relatively thick samplers (>50 mm) whereas the Whistler data were obtained with a thinner sampler (20 mm). These limited data suggest that the gleitschicht tends to be a relatively thin layer (<50 mm) in a significant number of cases. Another explanation is that density is a poor predictor of failure stress (Reference GublerGubler, 1978), and correlations are likely to change from sample to sample.
Table II. COMPARISON OF SLAB MEASUREMENTS

Methods: Photomicrography
Figure 1 shows our arrangement for collecting a snow sample from the neighbourhood of the intersection of the crown and bed surfaces. A partitioned sample can was carefully inserted at the intersection so that the partitions aligned with the crown and bed surfaces. The can, which now contained the sample, was delicately cut out from the snow, capped, and inserted into a larger cylindrical can. Snow was packed inside the larger cylinder and around the sample can in order to prevent melting and minimize shock disturbance during transport, which was by backpack on skis to a refrigerated laboratory at the left of the Whistler ski area.
In the laboratory, the sample can was tapped sharply in order to induce a fracture along the bed-surface extension. If there was no fracture, then the axis of the bed-surface extension was visually estimated with the aid of the reference partition (we were able to obtain a fracture in about 10 of the 30 cases). After locating the axis of the bed-surface extension as closely as possible, a tiny V-shaped chisel was used to extract carefully a sample of about 10 to 100 snow grains from a band approximately 10 mm thick immediately above the axis. The grains were placed in a petri dish, and the dish was tapped in order to disaggregate the grains into separate crystals as much as possible. The grains were then photographed using transmitted polarized light with the nicols in an uncrossed position. The polarized light was used to accentuate crystal boundaries.
We called the grains extracted from just above the axis of the bed surface extension the “at” grains. For comparison, a second set of grains, which we called the “below” grains, was extracted from an axis below the bed surface extension; and similarly, a third set of grains was extracted from an “above” axis. Our initial plan was to extract the “above” and “below” grains from respective axes 50 mm above and below the bed-surface extension. However, as the study progressed it became clear that the more interesting “above” and “below” layers did not necessarily coincide with the 50 mm spacing. For example, in 10 of our 30 cases, visual inspection of the sample can revealed crust layers along axes usually spaced closer to the “at” layer than 50 mm. Crusts and other anomalies that appeared to form natural boundaries of the gleitschicht were sampled in preference to the 50 mm layers.
Results: Photomicrography
The far right column in Table I is a summary of the types of crystals observed in the photomicrographs of the above, at, and below layers. The type of crystal is coded by a number (1-7) based on the international system of snow classification (UNESCO, 1970) as follows:
1. New and initially metamorphosed crystals. Original crystal shapes (plates, columns, dendrites) as formed in atmospheric clouds can be recognized despite initial sublimation, wind fragmentation, or riming. Plate-like forms appear colour less when illu-minated with transmitted, polarized light. Prisms show some colour.
2. Rounded crystals. The majority of the crystals appear to have rounded surfaces, although flat faces are visible at crystal bonds. Original atmospheric forms are no longer obvious. Polarized light may produce some colours depending on crystal thickness. The projected crystal area is less than one square millimetre, and often closer to 10–1 or 10–2 mm2.
3. Faceted crystals. The majority of the crystals appear to have flat surfaces and angular corners. Polarized light brings out a variety of colours. The projected area of these crystals may exceed several square millimetres.
4. Stepped crystals. These are enlarged, faceted crystals which, when examined under transmitted light, appear to consist of many steps or layers. The steps sometimes spiral around to form a cup. Polarized light reveals brilliant colours.
5. Crusts. This category is determined primarily by the relative strength of the layer and its resistance to disaggregation. Photomicrographs reveal colourful conglomerates of tightly packed crystals.
6. Surface hoar. The Whistler variety of surface hoar typically includes large, fan-shaped crystals. Projected area often exceeds 10 mm2. Although step-like features are obvious, these crystals are easily distinguished from Category 4 by their relative lack of colour under polarized light, at least in their early stages of metamorphism.
The code 7 was used in one case (19 January 1977) where the bed surface was immediately above the ground, and it was not possible to sample a below layer.
Many of the photomicrographs were disappointing in the sense that the “at” crystals did not appear very different from the “above” and “below” crystals. For half the investigations shown in the far right column of Table I the “at” crystals were classified the same as either the “above” or “below” crystals. Three notable exceptions are shown in Figure 2, The “at” crystals from the Boomer Bowl investigation of 18 February 1979 stand out as relatively unmetamorphosed stellar fragments (Category I) sandwiched between the rounded crystals (Category 2) shown in the “above” and “below” photomicrographs. The “at” crystals from the fig.2. PK-high investigation of 16 March 1979 stand out as surface hoar (Category 6), whereas the “above” crystals are initially metamorphosed stellar fragments (Category 1), and the “below” crystals are classified as rounded (Category 2), although there is some evidence of stellar shapes. The Whistler Bowl photomicrographs, 10 March 1977, show faceted crystals (Category 3) sandwiched between large conglomerates taken from ice crusts (Category 5).
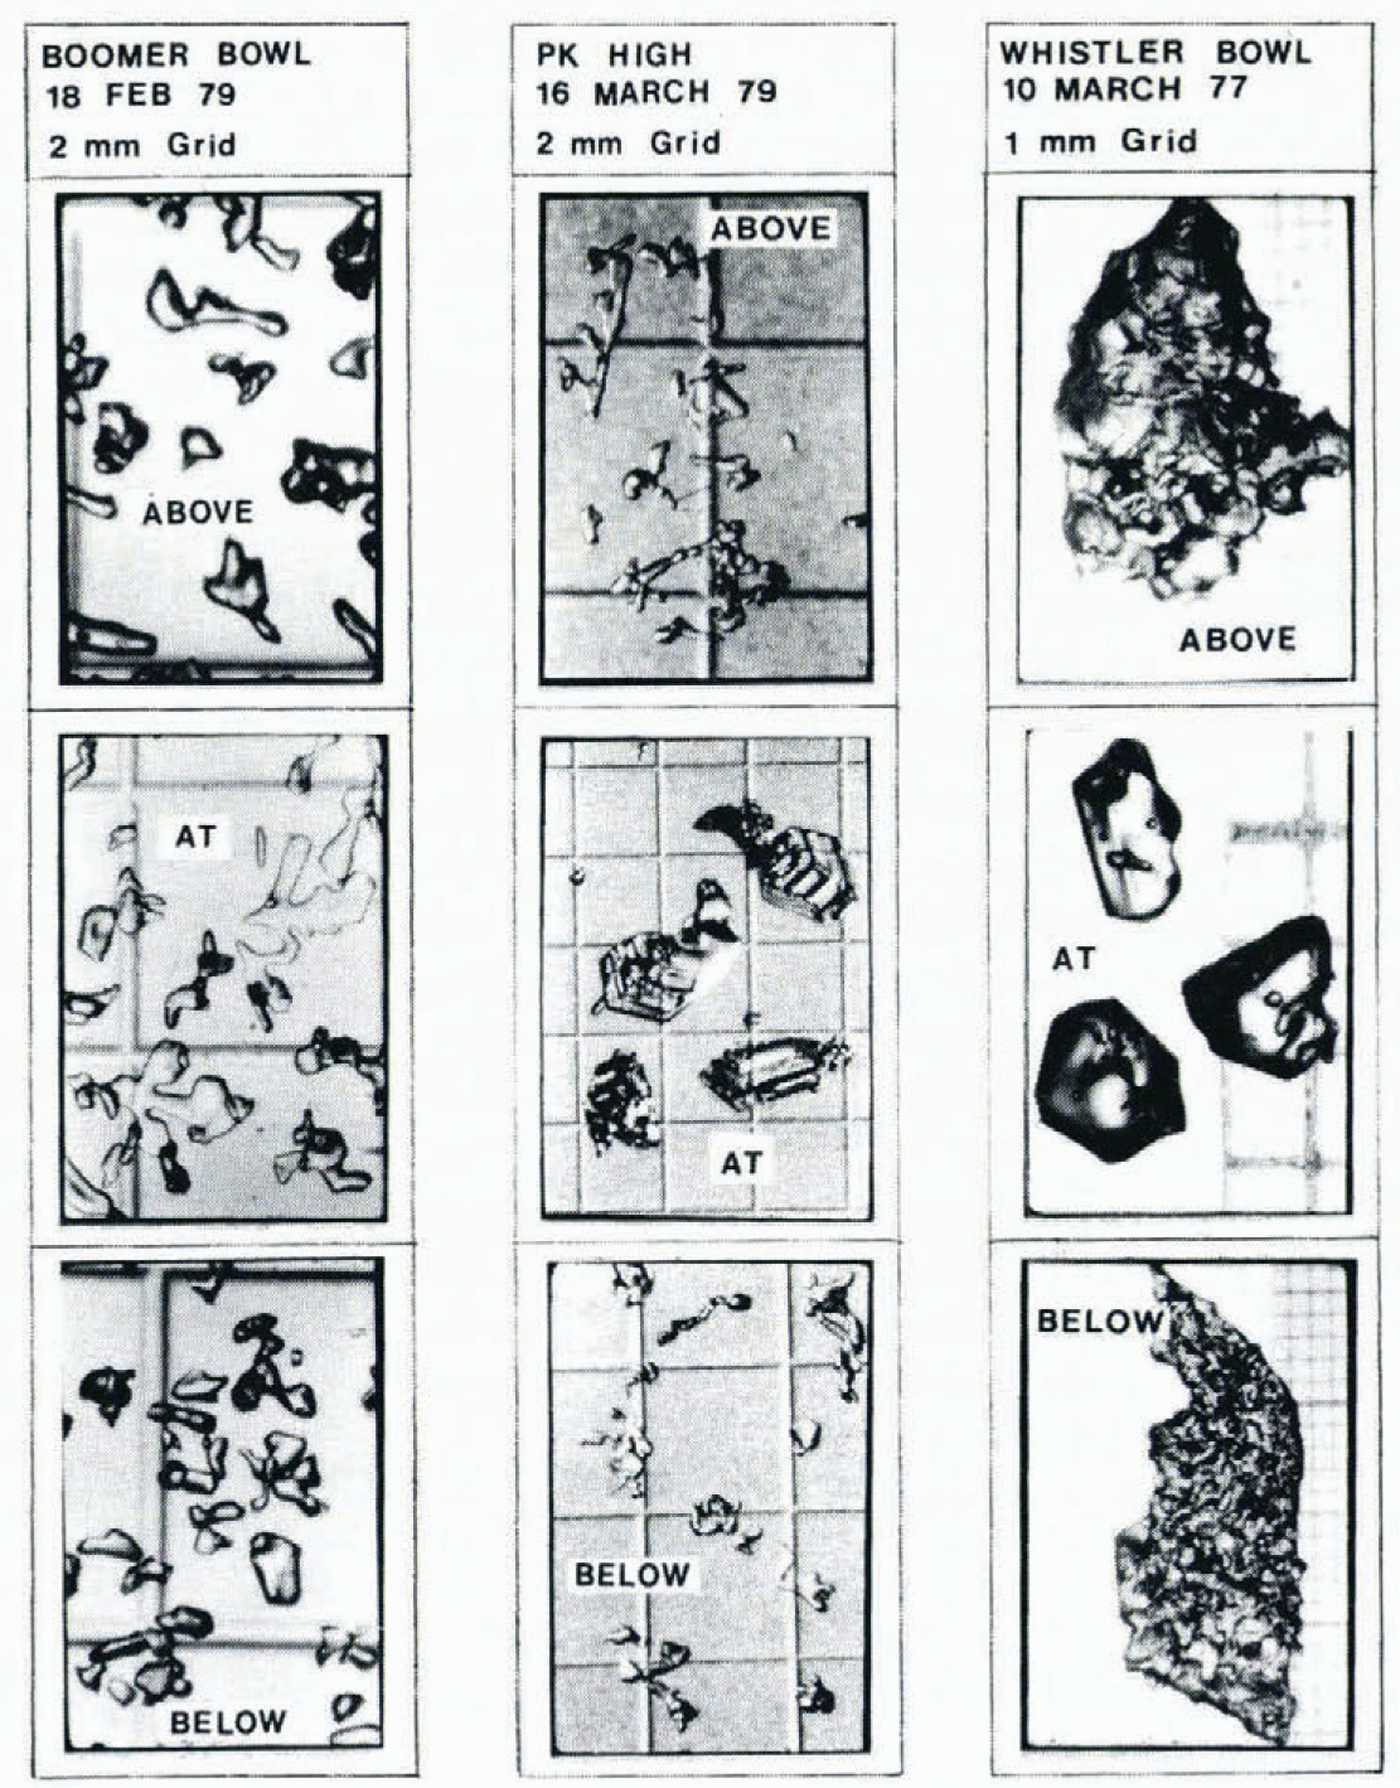
Fig. 2. Examples of photomicrographs.
Discussion
We feel the recurring statistics of bed-surface slope angles have practical significance, especially for back-country skiers who are well advised to avoid slopes steeper than 25 ° if there is any doubt about snow stability. We have again found that bed-surface temperatures are essentially in the band 0°C to — 10°C. Since it is exceedingly rare for the bed surface of a thick slab (H > 1 m) to have a temperature colder than — 5°C, we feel laboratory tests of shear strength and related properties should emphasize warmer temperatures than the somewhat arbitrary — 10°C that is conventional in many snow studies. Similarly, the densities of prime interest are probably in the band 200 kg/m3 to 250 kg/m3, the lower limit corresponding to gleitschicht densities, and the upper limit to slab densities.
Improvement of our photomicrography method is certainly needed. A three-layer model of the gleitschicht (“above”—“at”—“below”) turned out to be a naïve oversimplification of Nature. In our future work we will attempt to photograph the intact texture of the gleitschicht using plane sections.
Acknowledgement
This study was only possible with the help of Garibaldi Lifts Ltd, Whistler, B.C. Correspondence with Professor E. R. LaChapelle, University of Washington, influenced many of our ideas.


