

Introduction
The purpose of this research is to investigate the spatial variability of snow stability as a function of terrain at the physical scale of a small mountain range on two different days (midwinter and late-winter) during a snow season. Knowledge of regional snowpack conditions is critical for predicting snow avalanches, which are a significant hazard in mountain environments. Because snow conditions are not uniform in complex terrain, an understanding of spatial variations in snowpack properties is important in snow-avalanche research and prediction. In spite of known snowpack variations, traditional methods of data collection have focused on single-location study plots. These data are then extrapolated to larger areas on the basis of practical experience instead of scientific understanding. The connections between these point data and the snowpack properties of the surrounding terrain must be better understood for accurate avalanche prediction and explanation of avalanche processes.
Previous work quantified snow stability as a strength-to-load ratio, where the strength is often measured with a shear frame and the load includes the gravitational stress of the slab and can include additional stresses from skiers or others (e.g. Reference FöhnFöhn, 1987; Reference JamiesonJamieson, 1995). For this research, snow stability is defined as the probability of avalanches not occurring, and it is quantified by simple results from two in situ snow-stability tests, the rutschblock (Reference FöhnFöhn, 1987) and the stuftblock (Reference Birkeland and JohnsonBirke-land and Johnson, 1999). Snow strength is distinct from stability, and is usually measured as resistance to penetration from an object such as a foot, hand or penetrometer. This work utilized a Rammsonde (ram) penetrometer to measure snow strength.
Several studies have assessed snow strength or stability at a specific point (e.g. Reference LaChapelle and AtwaterLaChapelle and Atwater, 1961; Reference BradleyBradley, 1966, Reference Bradley1968; Reference MartinelliMartinelli, 1971; Reference LaChapelle, Armstrong, Armstrong and IvesLaChapelle and Armstrong, 1977). Broadening that approach, Reference Jamieson and JohnstonJamieson and Johnston (1995) attempted to link study-plot stability data to skier-triggered avalanches in surrounding terrain. Recent field research has focused on the spatial variability of snow, which is a key consideration for avalanche release, with studies exploring snow-strength variations (Reference BirkelandBirkeland, 1990; Reference Birkeland, Hansen and BrownBirkeland and others, 1995) and snow-stability patterns (Reference Conway and AbrahamsonConway and Abrahamson, 1984; Reference FöhnFöhn, 1989; Reference Jamieson, Johnston and ArmstrongJamieson and Johnson, 1993; Reference JamiesonJamieson, 1995) on individual slopes with areas on the order of 102 to 104 m2. Only two field-based studies have investigated snow-strength variations at a scale larger than this local scale. Reference BradleyBradley (1970) looked at basal snow strength on slopes with different aspects over an area of about 1 km2. In a study that most closely parallels the present work, Reference DexterDexter (1986) quantified snowpack and snow-strength variables over an area of 10 km2, but did not measure snow stability. There have been no field-based studies of snow-stability patterns over areas of hundreds of square kilometers, which is the scale of interest to regional avalanche forecasters.
Reference LaChapelleLaChapelle (1980) discussed the nature of the data used for avalanche forecasting, and Reference McClung and SchaererMcClung and Schaerer (1993) classified the variables into three categories (meteorological, snowpack and stability), with higher classes containing data that provide less direct evidence for avalanche prediction. Though terrain is not included, it changes radically in space and provides the background for the interplay of the other variables; thus, this research includes terrain as a variable category. Specifically, in order to explore snow stability at a previously unstudied scale, this work addresses the following research questions:
On two given days,
-
(1) how does snow stability vary in relation to terrain?
-
(2) how does snow stability vary in relation to terrain and snowpack?
-
(3) how does snow stability vary in relation to terrain, snowpack and snow strength?
Answering the above increasingly complex questions will help to identify the data requirements for assessing stability patterns. Hypothetically, linkages between snow stability and terrain exist, the addition of more specific snowpack factors will improve the predictability of stability patterns, and these relationships change over the course of the season.
Research Methodology
Environmental setting
The area chosen for study is the Bridger Range, located 5 km northeast of Bozeman, Montana, U.S.A. (Fig. 1). Relatively simple topography, abundant snowfall and extensive avalanche terrain make the range an ideal location for this research. The Bridger Range is in the intermountain avalanche climate zone (Reference LaChapelleLaChapelle, 1966; Reference Armstrong and ArmstrongArmstrong and Armstrong, 1987; Reference Mock and BirkelandMock and Birkeland, 2000), and consists of a single ridge of mountains approximately 40 km long and 10 km wide, with peaks up to 2900 m that rise 1400 m above the valley floor. The snow climate, steep topography and lack of significant vegetation in the higher elevations combine to create extensive and dangerous avalanche terrain, with an estimated 1000 avalanche paths in this range of about 250 km2.
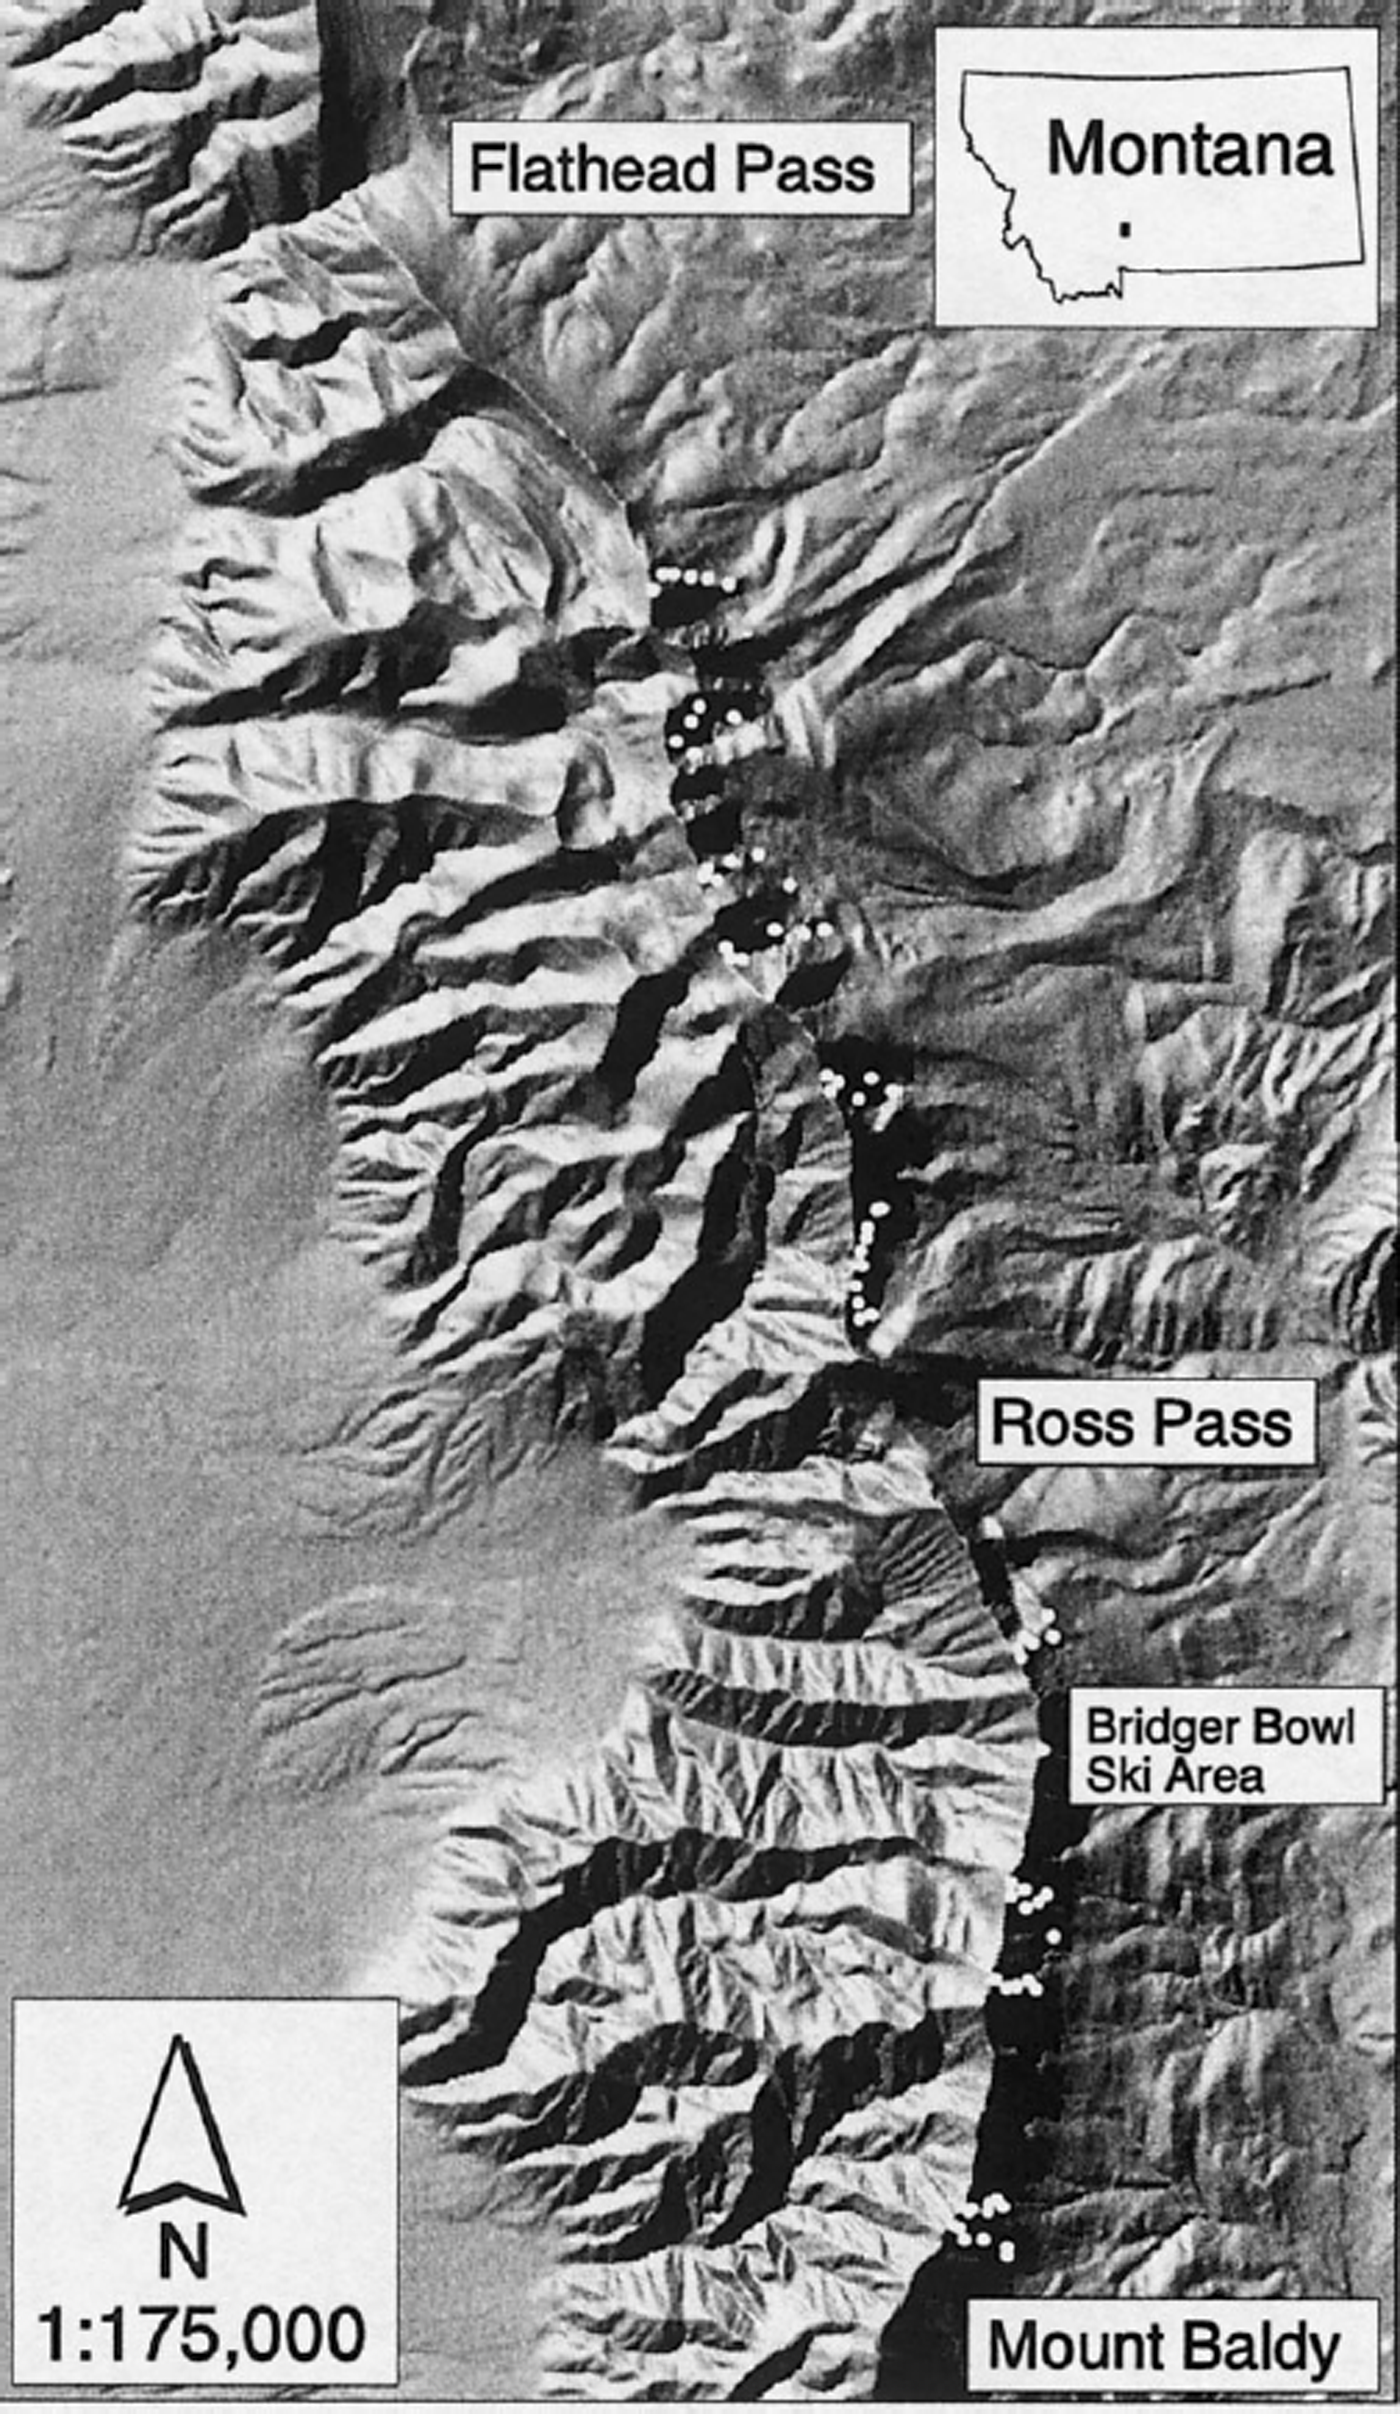
Fig. 1. Hillshade map of the Bridger Range, located approximately 5 km northeast of Bozeman, Montana. Twelve ridge-top helicopter landing zones allowed teams to sample more than 70 locations (represented by the white dots) each day. Map generated from U.S. Geological Survey 30 m digital elevation models with a vertical exaggeration of two.
Data collection
A helicopter shuttled six two-person sampling teams around the Bridger Range, expediting data collection and improving safety. Teams took part in pre-season training to standardize data-collection techniques. Sampling locations were biased to the eastern side of the range due to problems with unsafe low-elevation landing zones on the west side, and difficulty in getting sampling teams out if the sampling day was shut down midday due to bad weather. On the east side of the range, objective hazards (such as cliff bands) and avoiding Bridger Bowl Ski Area further reduced the area considered for sampling. A planimeter was used to roughly determine that about 35% of the total avalanche terrain in the range was acceptable for sampling. This terrain was accessible from 12 reasonable ridge-top landing zones.
Complete randomization of sampling locations resulted in unacceptably dangerous sampling routes. Therefore, I took early-season photographs of all slopes and chose reasonably safe routes from an avalanche-hazard standpoint, but routes that allowed the teams to sample a variety of aspects and elevations on slope angles typical of avalanche starting zones (generally 30–45° (Reference PerlaPerla, 1977)) while traveling efficiently. This sampling scheme allowed for a reasonable stratification of the elevations and aspects represented by each site, and took most of the sampling-location decision-making out of the hands of individual team leaders, while allowing active decision-making in terms of team safety. Teams sampled nearly the same locations on both sampling days, though some sites had to be slightly relocated to avoid ski tracks or unnecessary exposure to avalanche hazards on the second sampling day (Fig. 1).
Adverse weather during the 1996/97 winter limited the number of available helicopter sampling days. I selected sampling days based on weather, sampling-team and helicopter availability, and a snowpack unstable enough to provide reasonable stability-test results, but not so unstable that the sampling teams faced extremely dangerous avalanche conditions. The two sampling days chosen were 6 February and 2 April, and on each day we safely collected data from over 70 points.
Data variables
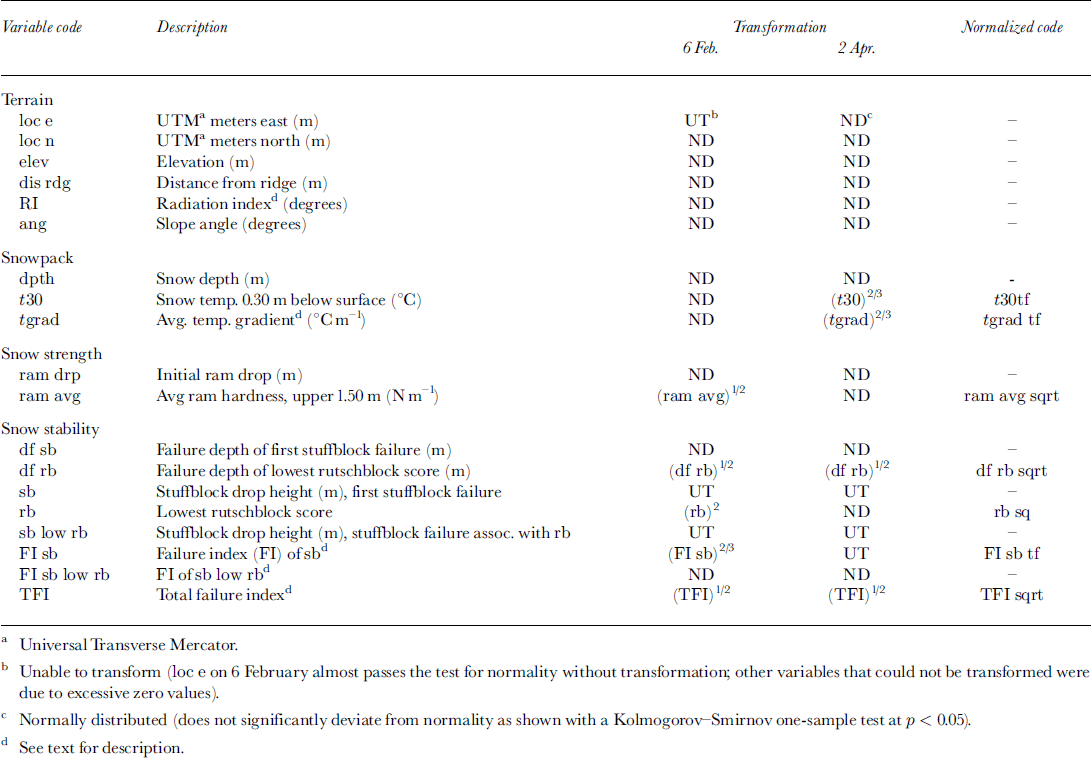
At each sampling location, teams collected data establishing variables describing terrain characteristics, general snow-pack properties, snow strength and snow stability (Table 1), with an emphasis on fast, consistent and reliable measurements. Terrain variables include location within the mountain range (in UTM meters north and east), elevation, distance from the ridge (which quantifies the distance from a major wind barrier), a radiation index (measured in degrees away from true north) and slope angle. Investigators measured slope angle and aspect with inclinometers and compasses, and ascertained elevation and location with Rockwell PLGR Global Positioning Systems.
Table 1. Variable codes, descriptions, transformations and normalized variable codes for terrain, snowpack, snow-strength and snow-stability variables.
Snow depth and snow temperature 0.30 m beneath the snow surface quantified general snowpack characteristics. Sampling teams measured depth with a folding ruler or an avalanche probe, and assigned areas with depths exceeding 4.5–4.8 m a minimum value to avoid overly time-consuming digging. Seven such sites existed on the first day and ten on the second day, for a total of about 10–14% of all depth measurements; thus, the relationship of depth with other variables should be viewed with caution, especially in areas of deeper snowpack. We measured snow temperature to the nearest °C at 0.30 m below the surface, which is below the level of diurnal fluctuations (Reference ArmstrongArmstrong, 1985). The average temperature gradient was computed by dividing the subsurface temperature by the depth from that thermometer to the ground, and assuming that the basal temperature was constant at 0°C. Though this latter assumption is not perfect, it is a reasonable approximation for this study area, and this technique for computing average temperature gradient has been used in previous research (Reference ArmstrongArmstrong, 1985; Reference DexterDexter, 1986).
Using ram penetrometers, sampling teams established two strength variables: (1) surface snow strength, and (2) average snow strength of the top 1.5 m of snow. The initial drop of the ram quantified surface snow strength, while average ram strength was computed by calculating the average ram hardness of the upper 1.5 m of the snowpack. Time constraints dictated that we only collect average ram hardness of the upper 1.5 m, and not a complete and detailed profile.
Several measures assessed stability, including the rutschblock test (Reference FöhnFöhn, 1987), the stuffblock test (Reference Birkeland and JohnsonBirkeland and Johnson, 1999), the depth to failure (representing the slab depth of potential avalanches) and stability indices based on stuffblock results and failure depths. All stability variables focus on slab avalanches. Rutschblocks test a relatively large sample of snow and have been used in previous research (Reference FöhnFöhn, 1989; Reference Jamieson, Johnston and ArmstrongJamieson and Johnston, 1993). The stuffblock test, which involves dropping a nylon sack filled with 4.5 kg of snow onto an isolated column of snow (0.30 m square) from known heights until the weak layer fractures, is more easily quantifiable and provides reasonably consistent results between observers (Reference Birkeland and JohnsonBirkeland and Johnson, 1999). Sampling teams conducted one rutschblock and one stuffblock test at each sampling location. Depth to failure is another important variable, since slab depth is a factor in determining the amount of snow released in an avalanche. In order to assess the combination of the depth to failure and the weak-layer strength together, a dimensionless stuffblock failure index (FI) was developed by dividing stuffblock drop height by depth to failure:
where sb is the stuffblock drop height (m) and df is the depth to failure (m) of a specific failure layer. Thus, smaller values of this index suggest more dangerous conditions. To objectively analyze the most significant failure at each location, I considered the lowest rutschblock score for a location to be the most significant failure and used the associated stuffblock drop height and depth to failure as two primary variables.
Stability data are hard to compare when various locations have different numbers of failure planes in the snowpack. For example, how comparable is a site with a single stuffblock failure of 0.20 m that is 0.25 m down with another site that has stuffblock failures of 0.10 m at 0.15 m and 0.30 m at 0.45 m? To facilitate such comparisons, a dimensionless total failure index (TFI) was defined. This index was developed such that the following factors result in lower TFIs: (1) decreasing stuffblock drop height, (2) increasing failure depth, and (3) increasing number of failure planes. In essence, TFI indexes avalanche danger, where avalanche danger is a rough measure of the probability, frequency and size of dry-slab avalanches. Avalanche danger increases, and TFI decreases, with increasing numbers of failure planes because of the potential to trigger an upper snowpack layer which could overload the slope and trigger a lower layer, resulting in a much larger avalanche. Realizing that the variables do not necessarily interact in the manner specified, but also realizing the value in different indices (e.g. the widely used Palmer Drought Index (Reference PalmerPalmer, 1965; Reference KarlKarl, 1986; Reference Cook, Meko, Stahle and CleavelandCook and others, 1999)), TFI is defined as follows:

where sb1, sb2, …, sb N are the stuffblock drop heights (m) for the first through Nth failures, df1, df2, …, df N are the depths to failure associated with each stuffblock failure (m), and N is the total number of failures. N is squared to emphasize the importance of multiple failure layers, allowing TFI to converge more rapidly to zero as the number of failure planes increases.
Data analyses and mapping
I used descriptive statistics to make comparisons between the two sampling days: non-parametric Spearman rank-order correlations to quantify relationships between each variable pair; and forward stepwise least-squares multiple regression analysis to demonstrate how well the dependent stability variables could be predicted by the multivariate interaction of the independent variables. Data analyses utilized a two-dimensional space/attribute data matrix for each sampling day, with the rows representing the sampling locations and the columns representing the terrain, snowpack, snow-strength and snow-stability variables described in Table 1. All variables were tested for normality using the Kolmogorov–Smirnov one-sample test (Reference MasseyMassey, 1951). Most variables do not significantly deviate from normality at p < 0.05, and a variety of transformations were used to normalize those that did significantly deviate from normality (Table 1). Transformations were based on trial and error, and an excessive number of zero values made normalizing some variables impossible.
Rutschblock scores (rb) are problematic for statistical tests because they are ordered data. Stuffblock tests also result in ordered data, but since stuffblock results relate to a linear scale of the surface impact energy necessary to cause failure (Reference Birkeland and JohnsonBirkeland and Johnson, 1999), the stuffblock is better suited to parametric statistical tests than the rutschblock. Thus, care must be taken when interpreting parametric statistical results related to stuffblock drop heights, and special care must be taken when interpreting rutschblock results.
Because the data included variables that could not be normalized, I took a conservative approach and when possible used non-parametric tests that did not rely on assumptions of normality. While conducting non-parametric tests, all non-transformed data were used, and the normalized data and more stringent significance testing were used with non-normal variables for multiple regression analyses. In addition, multiple regression is considered to be robust with respect to deviations from normality, especially as sample sizes approach 100 (StatSoft, 1994). Since this sample size is fairly large (N of approximately 70), using regression is appropriate.
When performing forward stepwise least-squares regression analyses, specific criteria determined model “validity”. Though I chose the level of explained variance of the dependent variable, the other criteria simply assured the models met the basic assumptions of regression. These criteria included the following: (1) the model must be significant (p < 0.05, or p < 0.025 for dependent variables that are either ordered or not normally distributed); (2) the model must explain at least 15% of the variance of the dependent variable; (3) all partial regression coefficients must be significant (p < 0.05); (4) the shared variance of any two independent variables must be <50%, thereby insuring that the independent variables are relatively independent and obviating problems associated with multicollinearity; (5) significant autocorrelation does not exist (Durbin–Watson statistics generally >1.5); and (6) the residuals must be normally distributed. Pearson product-moment correlations quantified the shared variance of each variable pair. Results indicated that loc n and loc e were strongly correlated, with R = 0.92, and elev and dis rdg shared just under 50% of their variance, with R = 0.68. On the second sampling day the transformed variables t30 tf and tgrad tf were also highly correlated (R = 0.78). Thus, on both days I ran models first with loc n and then with loc e, and chose the model that explained more of the variance of the dependent variable. Likewise, only elev or dis rdg was used in each model, with the superior model being chosen. Finally, on the second day, only t30 or tgrad was used as an independent variable.
Maps for this study were created using the GRID module of the geographic information system software program Arc/Info running on an IBM workstation. Using 30 m digital elevation models, hillshade maps and computed grids representing elevation, radiation index, slope angle, location east and location north at each gridpoint were generated. These grids allowed the creation of maps representing statistical relationships using ArcView.
Results
Differences between sampling days
Descriptive statistics from both sampling days for snowpack, snow-strength and snow-stability variables show how the sampling days differed (Table 2). Mean values are reported for most variables, and median values are reported for ordered data like rutschblock and stuffblock results. In essence, the snowpack on the second sampling day was deeper, warmer and stronger than on the first day. Although snowpack and snow-strength properties changed dramatically, snow stability is similar, with four of the eight stability variables showing no difference, one variable indicating deeper slab depths, and the other three showing slightly more stable conditions.
Table 2. Descriptive statistics for snowpacks, snow-strength and snow-stability variables on both sampling days.

Relationships between variable pairs
6 February
Though there are several significant correlations between slab depth and the other variables on the first sampling day, the data are more remarkable for the lack of significant correlations between snow stability and terrain, snowpack and snow-strength variables (Table 3). However, a few significant correlations exist. The relationship between the first stuffblock failure and elevation suggests that higher elevations had slightly more unstable conditions. The significant positive correlation between the stuffblock associated with the lowest rutschblock score and snowpack temperature indicates that areas with warmer snowpack temperatures appear to be slightly more stable than colder areas, while the positive correlation between the first stuffblock failure and ram drop shows that stability increases as snow surface softness increases.
Table 3. Spearman rank-order correlations between snow stability and terrain, snowpack and snow strength on 6 February 1997
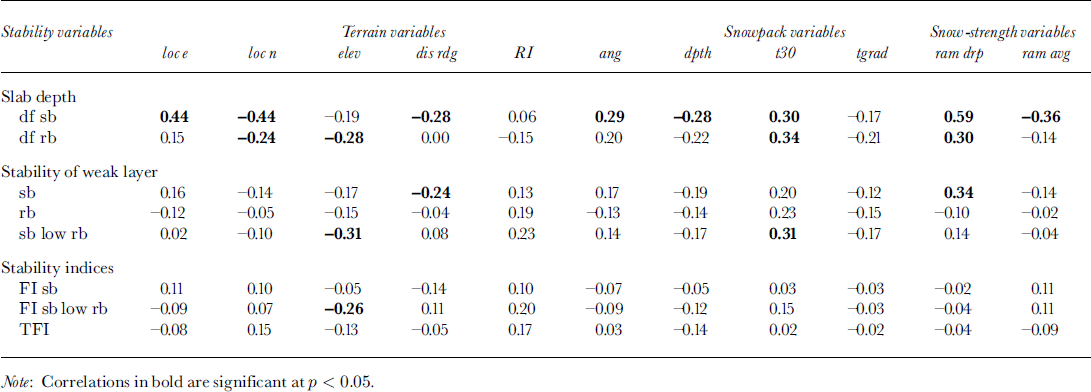
2 April
The correlation matrix for the second sampling day shows that terrain, and specifically elevation, is much more closely linked to stability than on the first day (Table 4). In fact, elev is significantly negatively correlated to every stability variable except df sb. Thus, slab depth is decreasing at higher elevations, as is weak-layer stability. However, weak-layer stability is decreasing faster than slab depth, resulting in decreasing failure indices with increasing elevation. Distance to the ridge is positively correlated to several stability variables, indicating increasingly unstable conditions closer to the main Bridger ridge. Another interesting relationship is the significant positive correlation between the failure indices FI sb low rb and TFI, and the terrain variable RI, demonstrating more stable conditions on southerly aspects. Thus, the spatial pattern of instability on this sampling day is that higher-elevation, northerly-facing slopes have the most unstable conditions.
Table 4. Spearman rank-order correlations between snow stability and terrain, snowpack and snow strength on 2 April 1997

On 2 April there is also a strong relationship between snowpack and stability variables (Table 4). Only df rb is not significantly correlated to at least two of the variables. In general, weak-layer strength decreases with increasing depth and increasingly cold temperatures, a result mirrored in the relationship between the failure indices and the snowpack variables. The correlation between stability and tgrad is negative, indicating that areas with larger temperature gradients are more unstable. As with the comparisons with terrain, the relationship of stability variables to snowpack variables results in a fairly clearly defined pattern, with areas with deeper and colder snowpacks having more unstable conditions.
Finally, on this sampling day there is a significant relationship between ram drp and all of the stability variables, while ram avg is only significantly related to slab depth, with areas of stronger snow showing thinner slab depths (Table 4). The initial ram drop is positively correlated to slab depth and negatively correlated to both weak-layer stability and the failure indices, indicating that, on this particular day, areas with softer surface snow had more unstable conditions. A scatter plot of TFI and ram drp shows this relationship, and is typical of scatter plots of many of the other data-variable pairs (Fig. 2). Though a relationship exists, considerable scatter is evident, demonstrating the importance of using additional variables for stability prediction. Consequently, a multivariate approach was taken during subsequent multiple regression analyses.
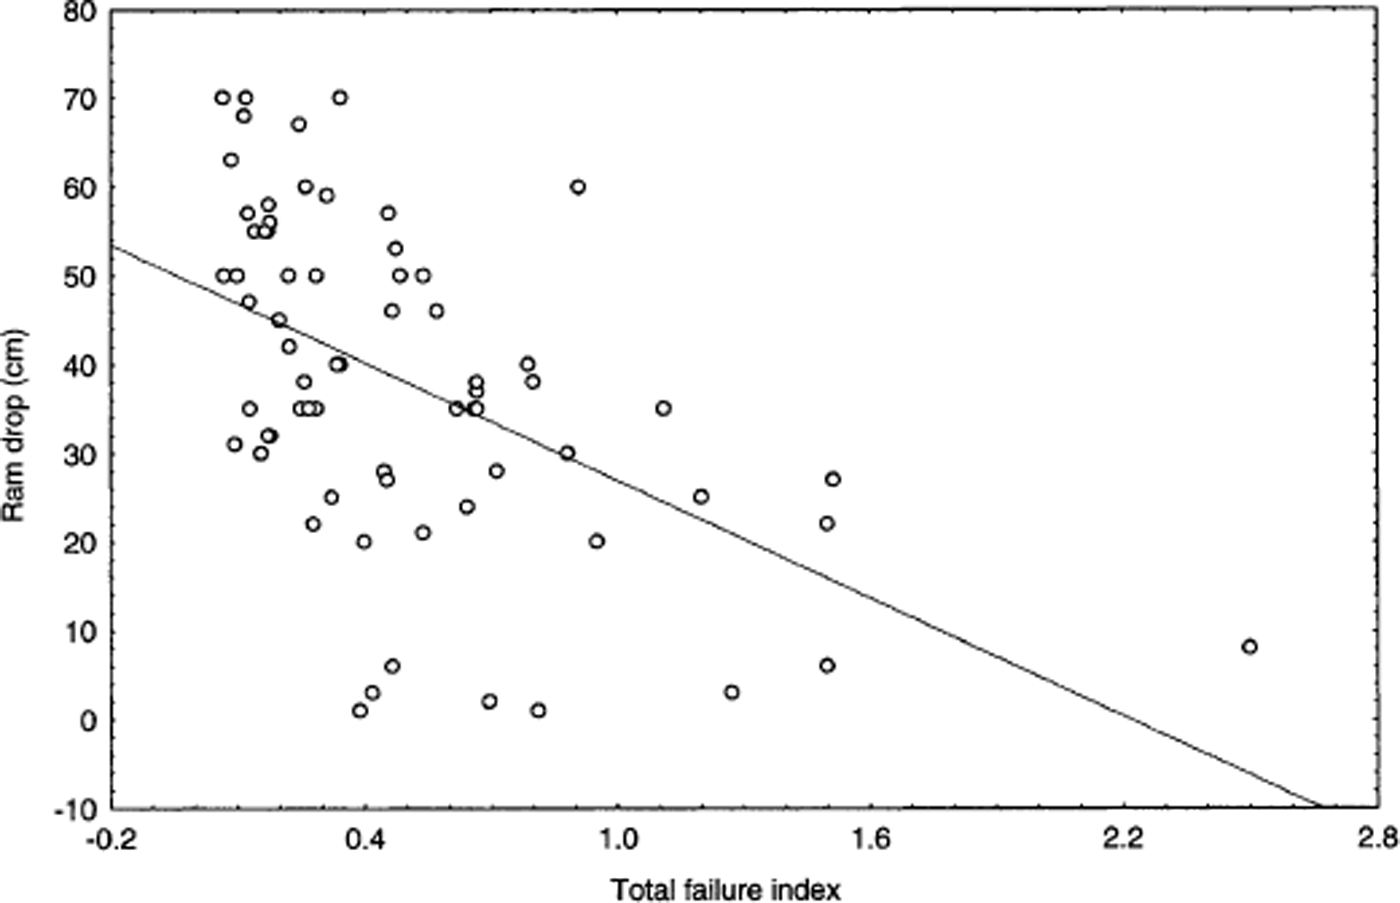
Fig. 2. Scatter plot of the TFI vs ram drop for data from 2 April, with a least-squares fit line.
Predictive modeling using multiple regression analysis
Forward stepwise least-squares multiple regression was used for predicting snow stability given terrain, snowpack and snow-strength variables. Initially, attempts to predict the various stability variables used only terrain as the independent variables. Subsequent analyses added snowpack and then snowpack and snow-strength data to determine if these additional independent variables improved the predictability of the models. On 2 April one data point repeatedly arose as a significant outlier with inordinate leverage (as measured by Cook’s distance (Statsoft, 1994)) on the regression models. At this site the weakest (and only) failure occurred at a slab depth of 0.05 m and a stuffblock drop height of 0.40 m, resulting in a TFI of 8, with the next nearest TFI being 2.5 and most TFIs being <1. This result is suspect, since normally by the time the stuffblock has been dropped from 0.40 m it has compressed the snowpack well below 0.05 m. Thus, the 2 April dataset for regression did not include this case.
6 February
No valid stability models could be generated using terrain data as the independent variables for 6 February. Adding snowpack to terrain as the independent variables, and selecting the stability variables as the dependent variables, produced a single valid regression model that explained just over 20% of the variance in FI sb low rb using elevation (standardized partial regression coefficient = −0.43), subsurface temperature (standardized partial regression coefficient = 0.35) and location east (standardized partial regression coefficient = −0.53). The model implies that stability is decreasing at higher elevations, colder subsurface snow temperatures and more easterly locations within the Bridger Range. Adding snow strength to the independent variables did not change the regression model for FI sb low rb, but it did result in a valid model for the transformed variable TFI sqrt. This model explained 15% of the variance of the dependent variable, but was based on different variables than those used to predict FI sb low rb, with location north (standardized partial regression coefficient = 0.40), radiation index (standardized partial regression coefficient = 0.35) and initial ram drop (standardized partial regression coefficient = 0.40) brought into the equation. The standardized partial regression coefficients show that all three variables are similar in their relative importance in predicting TFI sqrt, and implies that stability increases in a northerly direction, on more southerly-facing slopes and in areas with softer surface snow. However, lack of other valid models and the low R 2 values indicate the links between stability and the independent variables are relatively weak on this particular sampling day.
2 April
In contrast to 6 February, successful models were generated for several stability variables using only terrain as the independent variables on 2 April (Table 5). Valid models were generated for rb, sb low rb, FI sb low rb, and TFI, though no model explained >30% of the variance of the dependent variable. Elev appeared in three of the four models and was the most important variable in each model for predicting stability; the model that did not include elev used dis rdg, which is highly correlated to elev. Negative standardized regression coefficients for elev demonstrate decreasing stability at higher elevations. Three of the four models also used RI, with the positive partial regression coefficients indicating more stable conditions on sunnier slopes. Finally, one model used loc e in addition to elev and RI, to predict rb, showing more unstable conditions in areas farther east in the study area. In short, the regression models all emphasize decreasing stability at higher elevations and on more northerly aspects.
Table 5. Standardized partial regression coefficients and coefficients of determination (adjusted R 2) on 2 April 1997 for multiple regression models run with dependent stability variables and independent terrain variables (regression No. 1), independent terrain and snowpack variables (regression No. 2) and independent terrain, snowpack and snow-strength variables (regression No. 3)

Of the models produced, the model predicting rb is interesting because this study represents the first regional-scale quantification of this popular measure of snow stability. Though results should be viewed with caution due to the ordered nature of rutschblock data, a closer look at this model is warranted. The terrain-based equation, which explains 28% of the variance of rb is:

where rb is the lowest rutschblock score, loc e is the location in UTM meters east, elev is the elevation (m) and RI is a radiation index based on aspect (where RI is the number of degrees away from north). Since this model is terrain-based, a visual representation can be mapped over the Bridger Range using a digital elevation model (Fig. 3). A limitation of this map is that it includes more terrain than was actually sampled, such as the terrain west of the main ridge, so the statistical relationship may not hold for all the terrain mapped. Still, the obvious effect of elevation is apparent since the most unstable conditions (represented in black) are found close to the main ridge.

Fig. 3. Map of the statistical relationship between lowest rutschblock score (rb) and terrain. The darkest areas on the map represent the smallest rutschblock scores (and most unstable conditions) while the whitest areas represent the largest rutschblock scores (and most stable conditions).
The terrain-based model for TFI is also interesting, since TFI is an index of the overall stability of a particular location, and this study represents the first quantification of such a measure at the regional scale. The equation, which explains 20% of the variance of the transformed TFI, is:
where TFI sqrt is the square root of the TFI, elev is the elevation (m) and RI is a radiation index based on aspect (where RI is the number of degrees away from north). Similar to the representation for rb, a map of TFI sqrt is dominated by the effects of elevation, with the highest elevations along the main Bridger ridge demonstrating the most unstable (represented by black) conditions (Fig. 4). This map, however, shows the effects of aspect more clearly than the map for rb, in which aspect and location east share secondary importance in predicting stability.

Fig. 4. Map of the statistical relationship between the transformed TFI (TFI sqrt) and terrain. The darkest areas on the map represent the smallest values of TFI sqrt (and most unstable conditions), while the whitest areas represent the largest values of TFI sqrt (and most stable conditions).
Including snowpack as independent variables results in valid regression models for all stability variables except slab depths, with 20–33% of the variance of the dependent variables explained (Table 5). With snowpack added, four of the six models brought in the variable loc n. Though less important than other variables in the model, the positive standardized regression coefficients for loc n indicate that the areas farther north had increasingly stable conditions. Three of the six models (for sb, FI sb and FI sb low rb) included the transformed variable t30 tf, and in every case this was the most important variable in the model. Negative standardized regression coefficients again emphasize more unstable conditions in areas with colder snowpacks. Two models (for sb and sb low rb) used dpth as a predictor of stability. In both cases, stability decreased with increasing depth.
Adding snow-strength variables into the regression models resulted in valid models for every stability variable, with models explaining anywhere from 20% to almost 50% of the variance of the dependent variable (Table 5). Five of the eight models used ram drp as an independent variable, and in every case ram drp was the most important variable for predicting the variance of the dependent variable. No two models used the same independent variables, and only dis rdg, ang and ram avg were not used in any model. The usage of the various independent variables was remarkably even. Of the eight models, ram drp was brought into five of them, t30 tf and dpth were each brought into four models, elev and loc n were each brought into three models, while loc e, RI and tgrad tf were each used in one model.
The model for TFI sqrt explained more of the variance of the dependent variable than any other model. The following model explains 47% of the variance of TFI sqrt:

where ram drp is the initial ram drop (m), dpth is the total snow depth (m) and tgrad is the average temperature gradient (°C m−1). This is the first quantitative representation of a stability index over an area the size of the present study.
As with all the models listed in Table 5, the validity of Equation (5) was further checked by examining the residuals. These were normally distributed, as tested by the Kolmogorov–Smirnov one-sample test (Reference MasseyMassey, 1951). Further, no significant relationship exists between the residuals and several other variables such as distance along the ridge, distance from the ridge, radiation index and elevation (Fig. 5). If such relationships existed, they could indicate a locational bias of the model. Since they did not, this further strengthens the validity of this model.

Fig. 5. Residual analysis for the regression model predicting TFI sqrt (Equation (5)) further demonstrates the validity of the model: (a) The residuals approximate a normal distribution, and passed the Kolmogorov–Smirnov test for normality, (b) The residuals were plotted against several variables, with no significant relationships observed. As an example, here they are plotted against elevation with a least-squares fit line (Pearson’s r = 0.038).
Regression results on 2 April strengthen previous conclusions that the most unstable conditions existed on high-elevation, northerly-facing slopes with deep, cold snowpacks that had weaker surface snow. There is also evidence that conditions were more unstable in the eastern and southern parts of the Bridger Range.
Discussion
The snowpack on the second sampling day was deeper, warmer and stronger than on the first day (Table 2). Such trends are commonly observed from mid-to late season in the mountain snowpack, and have been documented previously (e.g. Reference Armstrong and IvesArmstrong and Ives, 1976; Reference DexterDexter, 1986). Interestingly, although snowpack and snow-strength properties changed dramatically between the two days, snow stability is similar, with four of the eight stability variables showing no difference, one variable indicating decreased stability (df rb), and the other three showing slightly more stable conditions. The significant changes in snowpack and snow strength, without dramatic changes in stability, illustrate the dynamic nature of stability changes in comparison to the more slowly changing snowpack and strength variables.
On 6 February only a subtle relationship existed between snow stability and terrain, snowpack and strength variables. There are few significant correlations between variable pairs (Table 3) and few valid regression models. The nature of the relationships can largely be explained by the weather leading up to the sampling day; a more detailed climatology of the winter is included in Reference BirkelandBirkeland (1997). In essence, the weather from November to February consisted of prolonged storms with consistent snowfall and wind. Few significant weak layers existed in the snowpack, and differences between north and south aspects were minimal since the sun rarely shone. Weather conditions in the early season mimicked a more coastal avalanche climate, with more snow, less sun and fewer weak layers than are typical for the Bridger Range. These relatively uniform weather conditions led to similarly uniform stability conditions, as reflected in the data. However, in spite of the relative homogeneity of the snowpack, some subtle patterns do emerge from the data, with more unstable conditions on high-elevation, northerly-facing, colder slopes.
By 2 April more changeable weather conditions prevailed prior to sampling (Reference BirkelandBirkeland, 1997). Though February and March were stormy, there were more sunny periods interspersed with storms that dropped increased snowfall at upper elevations. Further, the sun affected southerly-facing slopes more dramatically by April because of increased insolation compared to earlier in the season. These weather conditions created increasingly discernible differences in the snowpack, as reflected in the data. There are statistically significant correlations between many variable pairs (Table 4), and numerous valid regression models (Table 5). Results confirm that increasingly unstable conditions existed at higher elevations, on more northerly aspects, in areas with deeper, colder snow and in areas with softer surface snow on 2 April.
Though the statistical strength of snow stability’s relationship with terrain, snowpack and strength variables varies between the sampling days, the relationships observed are surprisingly similar. On both days more unstable conditions existed in the southerly and easterly parts of the mountain range, and on upper-elevation, northerly-facing slopes. Quantifying this latter relationship is interesting, since avalanche forecasters have long suspected and observed more unstable conditions on shady, high-elevation slopes. Not only are higher-elevation areas exposed to more wind, which implies that there is more wind loading, deeper slabs and more load on the weak layer, but they are also colder. Snow changes form quickly, but the rate of change is highly temperature-dependent, so weaker layers tend to persist longer in those colder locations. However, it is important to remember that this research merely provides two quick snapshots of an extremely dynamic system. Though more unstable conditions are often observed at higher elevations and on more northerly aspects, avalanche forecasters often face atypical conditions where stability patterns are different and may even change on a daily basis. For example, Reference Schweizer, Jamieson, Skjonsberg and HestnesSchweizer and others (1998) documented a layer of surface hoar that formed only within a specific elevation range, thereby creating dangerous instabilities at mid-elevations and more stable snowpacks at higher elevations.
Regression models generated for all eight dependent stability variables on 2 April explained 20–50% of the variance of any one variable. Much variance remains unexplained, and may be due to a number of factors. First, small-scale terrain variability undoubtedly introduced unexplained variance into the data. Second, though I made every effort to limit differences between sampling teams, unavoidable observer inconsistencies undoubtedly added to the variability and inexact nature of the models. Finally, some of the data relationships may not be strictly linear. For example, though depth typically increases with elevation, high-elevation wind-exposed areas (that are also prone to avalanching) may have either extremely shallow snowpacks (areas of wind scour) or excessively deep snowpacks (areas of wind deposition). In spite of the limitations, the generation of valid regression models for snow stability on a particular day is encouraging given such a large and diverse area. Still, it is clear that such modeling cannot be used for practical avalanche forecasts in the near future due not only to the unexplained variance and limitations of our understanding of the system, but also to the excessive data requirements and the difficulty in collecting such data from potentially dangerous avalanche terrain.
One interesting result from this research is that the numerous regression models generated for the 2 April data each used different inputs to predict stability when given the same array of independent variables (Table 5). The stability variables are similar, and one would expect that the models generated to predict them would be similar. The differences between the models emphasize the underlying data complexity, and some of the difficulties that avalanche scientists face when trying to understand and predict avalanches. When Reference LaChapelleLaChapelle (1980) asked various avalanche forecasters with similar forecasting success rates to identify the data they used for avalanche forecasting, and which data were the most important, they chose different variables and weighed them differently. He concluded, “There is more than one way to predict avalanches given conventional means”. The data from this research suggest that, quantitatively, there is more than one way to predict snow stability. The low coefficients of determination also indicate that many more complicating factors than the ones measured in this research might have to be considered by avalanche forecasters to arrive at accurate forecasts, and that additional variables or combinations of variables have to be considered by snow scientists to better understand patterns of stability.
Summary
This research investigates snow-stability patterns as a function of terrain on the eastern side of a small mountain range on two days in one winter. Previous spatial studies of snow stability investigated patterns of stability at the scale of single slopes, but this is the first field-based work to address larger-scale patterns (on the order of hundreds of square kilometers). Snow stability decreased on each of two sampling days with increasing elevation and increasing northerly aspect. Results must be viewed with caution since other research (Reference Schweizer, Jamieson, Skjonsberg and HestnesSchweizer and others, 1998) and informal observations indicate that instability patterns often change significantly from season to season, month to month and even day to day. Still, the pattern of increasingly unstable conditions on high-elevation, northerly aspects is commonly observed in the mountain snowpack, and this is the first time these common observations have been quantitatively demonstrated.
Though this research takes a valuable first step in exploring the nature of spatial patterns and temporal variations in snow stability, much research remains to be done in order to better explain the spatial distribution of snow stability. One factor inadequately addressed in this investigation is the effect of the wind on various snowpack, snow-strength and snow-stability variables. Perhaps a mesoscale wind model using ground and upper-air wind inputs could be combined with a blowing-snow model to arrive at a variable that approximates wind deposition and scouring in various areas. This variable might provide valuable insight into the spatial patterns of depth, strength and stability. Another factor adding to the unexplained variance is the small-scale variability in snowpack and snow stability due to microscale variables such as wind effects, substrate or vegetation. Such variability poses serious difficulties for snow-stability studies at the scale of the present research since differences between adjacent points may be significant (e.g. Reference Birkeland, Hansen and BrownBirkeland and others, 1995; Reference JamiesonJamieson, 1995; Reference Arons, Colbeck and GrayArons and others, 1998). No methods currently exist to clearly define sample locations that might provide an “average” stability measure of the current slope. More work at this local scale is needed to insure that measurements made in regional-scale studies such as the present research are actually representative of a particular slope.
In spite of the difficulties, the present research makes progress in quantifying patterns of snow stability, and forms an encouraging baseline for future research concerning variations in snow stability at the regional scale. Further, there are practical implications suggested by the insights provided into the structure and complexity of the data used for avalanche forecasting. First, this work demonstrates some of the variability that exists in the relationship between snow-stability variables and snowpack and snow-strength variables. Until we better understand the linkages between all the variables, this emphasizes the critical importance of high-quality snow-stability (so-called low-entropy (Reference LaChapelleLaChapelle, 1980) or Class I (Reference McClung and SchaererMcClung and Schaerer, 1993)) data for accurate avalanche forecasts. Second, the differences observed between the sampling days imply that relationships between variables, and perhaps the scale at which variables can be extrapolated, may vary depending on the snow climate. Therefore, the size of a region that can be effectively covered by a regional avalanche forecast might vary depending on the snow climate of the area or even the weather during a particular winter. Finally, this work shows how the already complex relation ships between variables also change over time. The dynamic nature of snow stability confirms the importance of the holistic, iterative approach used by conventional avalanche forecasters. Thus, the best way to improve avalanche-forecasting techniques in the short term continues to be to provide additional tools to aid the conventional forecaster, rather than definitive decision-making models. Several such tools have been and are currently being developed (e.g. Reference Buser, Bütler and GoodBuser and others, 1987; Reference McClung and AgrawalMcClung, 1994; Reference Schweizer and FöhnSchweizer and Föhn, 1996; Reference Durand, Giraud, Brun, Merindol and MartinDurand and others, 1999; Reference Lehning, Bartelt, Brown, Russi, Stockli and ZimmerLehning and others, 1999). For the long term, a better understanding of both the relationships between the data variables used for avalanche forecasting and the controls on the spatial patterns of snow stability at the regional scale are needed for the development of more sophisticated models to aid avalanche forecasters.
Acknowledgements
I am grateful to M. Marcus for helping to inspire and encourage this study. W. Graf, L. Dexter, T. Brazel and R. Balling provided helpful comments and suggestions in regard to this research, and I also had several useful discussions with G. Birkeland, R. Johnson and K. Elder. Thanks also to the reviewers of this paper and to the editors (J. Johnson and M. Sturm) for their many useful comments. Numerous individuals helped with field-data collection, and Bridger Bowl Ski Area provided data and helped with the coordination of field days. K. Elder loaned some of the equipment used. The U.S. National Science Foundation (Dissertation Improvement Grant No. SBR-962830) provided funding for this research.


