

The aim of discriminant analysis is to divide X vector-predictors into classes by an optimal method according to the prescribed predictant classes; the discriminant function makes it possible to determine the class of any X that is not included into the archive.
The simplest solution of the problem concerning the division of the object into classes is obtained with normally-distributed continuous predictors, identical covariant matrices within both classes of the object, and with inequality of mathematical expectations within the classes. In this ease the problem is solved by means of a linear parameter discriminant function U(X) that may be considered as some one-dimensional variable with normal distribution. The equality of the covariant matrices of different classes is a rather strong limitation, but it essentially simplifies the computational technique.
Non-significance of the differences between them is defined empirically, and then one matrix is constructed by averaging (taking the weights into consideration) the same elements. Another limitation is connected with the deviation from normal distribution that is conventional for some parameters.
Discriminant analysis methods are widely used in hydrometeorology (Reference GruzaGruza, 1967; Reference SuzukiSuzuki, 1969; Reference Bois and ObledBois and Obled, 1973). Its application is simplest for forecasting of phenomena which assume alternative formulation. In this case the linear discriminant function at the limit of classes is:

where M 1 and M 2 are vectors of mathematical expectations within classes ϕ1 and ϕ2 respectively; II1 and II2 are a priori probabilities of classes ϕ1, and ϕ2; C 1 and C 2 are values of erroneous classification of the first and the second kind, their relation is assigned according to a priori probabilities of classes and valuability of correct prediction of each class; C 1 is the value of the erroneous classification of the first kind which means that the X vector belonging to the first class is referred to the second one; C 2 is the value of the erroneous classification of the second kind which means that the X vector belonging to the second class is referred to the first one. These errors arise due to the fact that the probability density of different classes is in some way recovered by each other. By means of the C 2 /C 1 correlation it is possible to improve results of correct identification of one class by deterioration of results of identification of the other class. The prime is the transposition sign and A is a vector of linear coefficients
where S denotes the mean covariant matrix.
Whether the concrete realization of the X vector belongs to classes ϕ1, and ϕ2 is determined by the following decisive rule: if U(X) ≥ R, then class ϕ1 is forecast (i.e. avalanching is expected); if U(X) < R, then class ϕ2 is forecast (i.e. avalanching is not expected).
R denotes the threshold value of the discriminant function

The purpose of the study was to classify the situations into avalanching and non-avalanching ones during snowfall (zero earliness forecast or diagnosis of the fresh-snow avalanches which slipped during snowfall or within the next two days when there was no rise in temperature). The concept “zero earliness forecast” can be explained as follows. Let us analyse the object which is described by observing parameters y = (y1, y2, …,ym); these observations can be referred to the different moments of time tyi, j = 1, …, m. Suppose that we have clarified the physical nature of this object and can describe it by another one X = (x1, x2, …, xn ), i.e. the characteristics of the X objects are also referred to different moments of time txi, i = 1, …, n If

Otherwise extrapolation in time and, consequently, the prediction is not possible. Let us assume that when


The case when the requirement
Investigations were carried out on the basis of observed data obtained from snow-avalanche stations in Central Asia. For the analysis samples consisting of 500 cases of avalanching (class ϕ1) and 1 300 cases of non-avalanching (class ϕ2) were used. All data were differentiated into two altitude zones (higher and lower than 3 000 m) and into three sectors in each altitude zone. The first sector united cases of situations observed on slopes of southern aspect (S., S.E., and S.W. expositions), the second one covered cases with western and eastern aspects, and the third sector united cases observed with northern aspects (N., N.E., and N.W. expositions). The values of the vector-predictor in each zone differs in the variable quantity X 8 (the sum of the total daily radiation during the period of snowfall, which depends on the slope aspect). The whole totality of avalanches was considered as one case, if some avalanches were observed in similar height conditions and orographic aspect.
A vector whose components are analogue data on meteorological conditions in which the formation of a fresh snow layer occurs and which have decisive influence on avalanche formation in fresh snow, is taken as a predicting vector (predictor) X = (x1, x2, …, xk ), k = 1,…,8. The variables x1, x2, x3 are introduced into the prediction scheme to characterize indirectly the state of the old-snow surface at the beginning of snowfall. Table I gives the content of the predictor.
Table I. The meaning of the predictors used

Discriminant analysis provides for two stages according to the scheme used: training and control testing. Training implies the first stage of the experiment when the training is carried out on the basis of predictor sampling with a known division into classes, i.e. the correlational analysis is realized, the covariance matrix is constructed, the predictors are sifting, the coefficient of the discriminant function and the indicator of divisibility (NR) are assessed. The stage of control testing includes the assessment of the reliability sample forecasts on dependent and independent material. The material is referred to as “dependent” if the training is carried out including it; “independent” material is material not included in the training stage, but used for testing of the discriminant functions constructed on the basis of dependent material.
Different statistical characteristics are considered within each stage. “Double ‘Student’s’ t-criterion” determines divergence variability of
The calculations showed that considering error probability from 0. 10 to 0.05 for predictors x4–x8, the difference in ihe means of samples of classes ϕ1 and ϕ2 is mainly significant; insignificant differences prevail for predictors x 1–x 3, this indicates their low informativity according to this criterion.
Informativity of different prcdictor groups was defined by a “sifting method” that includes the definition of a division index (NR):

where
In Table II the results of “sifting” arc presented for six samples, where the predictors are set in the order of their choice at “sifting”, P T in this table denotes the theoretical probability of correct classification (Reference GnedenkoGnedenko, 1965).
Table II. Comparative informativity of different- predictors
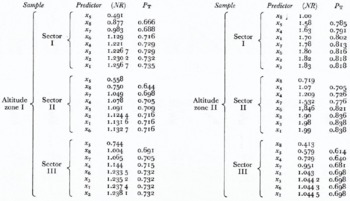
The data presented in Table II which show the degree of informativity increasing (through (NR)) as each predictor is added, allow us to conclude that the optimal informativity group (in the given complex) is obtained by means of variables characterizing the total value of precipitation, solar radiation, absolute air humidity, precipitation duration, and, in three of the six cases chosen, the sum of daily mean air temperatures. The order of these variables determined by their informativity rank was different in the two altitudinal zones.
In the altitude zone higher than 3000 m, the classification of snowfall situations depends greatly upon precipitation value, while in the zone lower than 3000 m it depends upon solar radiation. In the first zone during the third step of “sifting” the x7 variable, the sum of daily mean absolute air humidity, was chosen; in the second zone this variable entered the optimal complex only in the fourth step.
At the boundary of this group the growth of theoretical forecast reliability essentially stops. This is rather important when defining the optimal group of predictors which is included into forecast, because introduction into the prediction scheme of features insignificantly affecting the classification quality, leads to the deterioration of the reliability of the forecast on independent material, although the forecast based on dependent material can be improved to some extent.
The predictors which were not included into the optimal complex include the variables x1, x2 and x3 indirectly characterizing the state of the old-snow surface before the snowfall began.
The next stage of the experiment consisted of making a forecast on the basis of the training sample, and for this purpose the discriminant function value was found, and the classification of situations into avalanching and non-avalanching ones with different values of C 1, and C 2 was made using the rule mentioned above. The best results for satisfactory classification of situations into the two classes were obtained with the values of the erroneous classification inversely proportional to the class of the appearance probability (except sector II in the altitude zone II, where the best result was obtained with a lower ratio C 1/C 2).
Table III shows the forecast estimation based on the training sample at various C 1/C 2 ratios and with either eight- and five-dimensional vector predictors for the sectors of the first altitude zone in order to estimate the effect of the dimension Nx of the vector-predictor on the forecast result (when Nx = 5, the predictors which were not introduced in Table II, were excluded).
Table III. Estimation of success of classification of situations during snowfalls into avalanching and non-avalanching ones

The following symbols are used in Table III:
Table IV. Estimation of success of classification of situations during snowfalls into avalanching and non-avalanching ones based on independent material

This last criterion is more effective for assessing avalanche prediction, as is obvious, for instance, from the forecast result for sector II of altitude zone II, where at p = 90.9%, H equals only 0.15%. The high percentage of forecast reliability with a low value of the H criterion in this case was due to successful prediction of class ϕ2 with a comparatively small number of cases in class ϕ1.
As a rule forecasts made by discriminant functions constructed on independent material proved to have less reliability, but quite comparable with the reliability of an avalanche forecast by any other empirical method, and testifies to the usefulness of the proposed method. The forecast results on independent samples are given in Table IV.
The work is far from being completed; improvement of the given scheme implies drawing in a greater volume of material, using additional predictors, and transition to a forecast with an “earliness” which differs from zero.


