

1. Introduction
Satellite data provide a very powerful way of obtaining knowledge of the temporal and spatial variation of the albedo of the Earth’s surface. This data source is particularly useful for glaciers and ice sheets, where variations in surface albedo may have a large effect on the melt rate. Knowledge gained from satellite data can be used to improve albedo parameterizations in atmospheric and mass-balance models, and also to estimate interannual variations in the surface mass balance (Reference GreuellGreuell and Knap, 2000; Reference De Ruyter de Wildt, Oerlemans and BjornssonDe Ruyter de Wildt and others, 2002). On glaciers and ice sheets, ground-based measurements are difficult to perform due to the remoteness of the area, the harshness of the climate and, especially in the ablation area, the instability of the surface. Also, ground- based measurements may be poorly representative of the average surface albedo of larger areas.
The main drawback of the retrieval of the surface albedo from satellite data is that the processing requires several steps, each of which may introduce errors into the results. The images must be geolocated and clouds must be masked. The satellite counts must be converted into reflectances valid for the top of the atmosphere. Corrections must be applied for the atmosphere, for tilt of the surface and for anisotropic reflection at the surface. The results of all these processing steps are surface albedos in the satellite bands (so-called ‘narrowband albedos’). The narrowband albedos must finally be converted into surface albedos for the entire solar spectrum (‘broadband albedos’).
Obviously, validation of the satellite-derived albedos is required. Studies to validate Thematic Mapper (TM)- and Advanced Very High Resolution Radiometer (AVHRR)- derived albedos have been conducted by Reference Hall, Chang, Foster, Benson and KovalickHall and others (1989), Reference DuguayDuguay (1993), Reference De Abreu, Key, Maslanik, Serreze and LeDrewDe Abreu and others (1994), Reference Knap and OerlemansKnap and Oerlemans (1996), Reference Stroeve, Nolin and SteffenStroeve and others (1997, Reference Stroeve, Box, Fowler, Haran and Key2001), Reference Knap, Brock, Oerlemans and WillisKnap and others (1999) and Reference Reijmer, Knap and OerlemansReijmer and others (1999). Recently, Reference Stroeve and NolinStroeve and Nolin (2003) compared albedos derived from Multi-angle Imaging SpectroRadiometer (MISR) and MOderate Resolution Imaging Spectrometer (MODIS) with ground observations, and Reference Klein and StroeveKlein and Stroeve (2002) did the same with MODIS-derived albedos of a seasonal snowpack.
This paper is another validation study for satellite- derived albedos. For this purpose, we obtained ‘ground- truth data’ during two field experiments, one over Vatnajokull, Iceland’s largest ice cap, and one over the Kangerlussuaq transect, Greenland (referred to as ‘K- ransect’ throughout this paper; western part of the Greenland ice sheet) (see Fig. 1). Contrary to the validation studies mentioned before, where the albedo measurements were performed from a ground-based mast, we collected data using a helicopter. This brings the sensors much higher above the surface, which has the advantage that the footprint of the ground-truth measurements is comparable in size to, or even larger than, the pixel size of the satellite data. Ground-based sensors generally view areas that are (much) smaller than the pixel size of the satellite data, which makes comparisons over the inhomogeneous surfaces below and around the transient snow-line dubious. This is aggravated by uncertainty in geolocation (Reference Knap, Brock, Oerlemans and WillisKnap and others, 1999). Moreover, the total area covered by ground-based measurements is much smaller than the total area covered during our helicopter measurements. Another advantage of this validation study, relative to earlier studies, is the direct measurement of albedos in the narrowbands with ‘narrowband pyranometers’ specifically designed for this purpose. In previous studies, either spectrometer ground-based measurements had to be converted into narrowband albedos, which were then compared with satellite-derived narrowband albedos (Reference Hall, Chang, Foster, Benson and KovalickHall and others, 1989; Reference Stroeve, Nolin and SteffenStroeve and others, 1997), or satellite- derived narrowband albedos had to be converted into broadband albedos before they were compared to ground- based broadband measurements (the other validation studies mentioned in the previous paragraph). In this paper, we directly compare satellite-derived albedos with helicopter albedos in the narrowbands (in the case of MODIS a small correction will be applied to the satellite- derived albedos (see section 3.4)) and therefore we do not need equations for narrowband-to-broadband conversion (NTB conversion; see Reference Greuell, Reijmer and OerlemansGreuell and others 2002).

Fig. 1. The two locations of the helicopter experiments.
There were three reasons for selecting parts of large ice caps and ice sheets like Vatnajokull and the Greenland ice sheet for these experiments. Firstly, the slopes are mostly gentle, so corrections for tilt of the surface are generally small and reflections from surrounding terrain can be neglected. Secondly, almost all of the helicopter measurements of the outgoing fluxes were unaffected by the terrain adjacent to the ice cap or ice sheet. Finally, glaciers like those in the Alps are too small to be studied successfully using AVHRR (resolution 1.1km) or MODIS images (resolution 250 m for bands 1 and 2, and 500 m for bands 3-7).
2. The Helicopter Measurements
Reference Greuell, Reijmer and OerlemansGreuell and others (2002) described the helicopter experiments in detail, so we only give a summary here. Albedos were determined by measuring the incoming fluxes at one or two stations installed on the ice cap (or ice sheet) and by measuring the outgoing fluxes from a helicopter. The ground stations and helicopter were each equipped with five radiation sensors, namely narrowband pyranometers for TM bands 2 and 4 and for AVHRR bands 1 and 2 (Fig. 2; Table 1) and an ‘ordinary’ broadband pyranometer. This study uses the measurements in TM band 2 and both AVHRR bands as ground truth. The spectral response of the narrowband instruments matches the spectral response of the corresponding satellite sensors well.

Fig. 2. Spectral response of satellite sensors relevant for the present study. The TM, AVHRR and MODIS instruments are on board the Landsat 7, NOAA-14 and Terra satellites, respectively. Also shown are spectral albedo curves for snow and ice as generated with a simple radiative transfer model (Reference Reijmer, Bintanja and GreuellReijmer and others, 2001).
Table 1. Spectral bands of the satellite sensors used or mentioned in this study. At the given wavelengths the spectral response is 0.5. Numbers are valid for the TM, AVHRR and MODIS sensors aboard the Landsat 7, NOAA-14 and Terra satellites, respectively

We converted the measured fluxes at the ground stations and the helicopter into estimates of the fluxes at the surface underneath the helicopter by making several corrections. The largest (0-10%) was a correction to the incoming fluxes for differences in elevation (effect on path length through the atmosphere) and surface albedo (effect through multiple scattering) between the ground station and the surface beneath the helicopter. This was done with the radiative transfer model 6S (Second Simulation of the Satellite Signal in the Solar Spectrum;Reference Vermote, Tanre, Deuze, Herman and MorcetteVermote and others, 1997). We also corrected the incoming fluxes for the slope of the surface, using digital elevation models (DEMs). We then computed the albedos of the surface under the helicopter from the corrected fluxes. The uncertainty in the computed albedos is estimated to be 2%, due to errors in the calibration coefficient of the instruments and errors in the corrections.
The first experiment was conducted over Vatnajokull on 6 July 1999 (Fig. 3). We made three flights between 1200 and 1630 GMT (solar noon was at 1310 GMT), with the solar zenith angle varying between 41° and 53°. During the first flight, we observed the ice and medial moraines of the outlet Breibamerkurjokull. During the second and third flights, which started and ended over the same outlet, we also made measurements over the higher, snow-covered part of the ice cap. The total distance flown over Vatnajokull was 297 km. Throughout the experiment, the sky over the observed parts of the ice cap was almost clear, with ͬ1% of the sky covered by cumulus clouds. Helicopter measurements affected by these clouds were discarded manually.

Fig. 3. The three helicopter flights over the southern part of Vatnajökull (6 July 1999) projected onto a map of the satellitederived albedo in AVHRR band 1 (image taken at 1524 GMT, 6 July 1999). All flights started and ended at Jökulsárlόn (southeastern end of flight-lines). Brei_amerkurjökull is the outlet with albedos lower than 0.5 with the dense net of flight-lines. The non-glacierized area roughly coincides with the violet colour.
The second experiment was conducted over the K-transect on 7 July 2000 (Fig. 4). We carried out two flights, between 1300 and 1415 GMT, and between 1645 and 1800 GMT (solar noon at 1525 GMT). During these flights, the solar zenith angle varied between 45° and 51 °. Both flights were more or less from west to east and vice versa, which is perpendicular to the elevation contours of the ice sheet. We consecutively crossed the tundra, the marginal part of the ice sheet where ice was exposed, a transitional zone with ice, snow, slush and supraglacial lakes, and the zone entirely covered with snow. The total distance flown over the ice sheet was 317 km. During these flights, the sky over the observed areas was completely clear.

Fig. 4. The two helicopter flights over the K-transect (7 July 2000) projected onto a map of the satellite-derived albedo in MODIS band 1 (image taken at 1602 GMT, 7 July 2000). Both flights started and ended in Kangerlussuaq (western end of flight-lines). The non-glacierized area roughly coincides with the blue and violet colours.
The largest part of the flights was made at speeds of 25-50ms-1 at 100-300m above the surface. At any height (h) ~90% of the radiation received by a downward-looking pyranometer emanates from an area with a diameter of 6h. Therefore, from a height of 200 m, the radiation sensors have a ground instantaneous field of view with a diameter of ~-1200m. We carried out flights at lower heights (down to ~-10m) over typical surface features with small horizontal dimensions, such as medial moraines and the transitional zone around the snowline (Vatnajokull), and supraglacial streams and lakes (K-transect). Measurements were made at a rate of 1 Hz.
3. The Satellite Data
3.1. The available images
In view of the possibility of substantial changes in the surface albedo from day to day, we limited the comparison of the helicopter and satellite albedos to satellite data acquired on the days of the experiments. This requirement was fulfilled by some AVHRR and MODIS images. Unfortunately other, possibly interesting, satellite data such as TM, MISR and Advanced Spaceborne Thermal Emission and Reflection Radiometer (ASTER) images, all of which have a coverage of less than once per day, were not available for the days and locations of the experiments.
Table 2 lists the acquisition times of the AVHRR and MODIS images used in the present study, as well as the solar view geometry (see Fig. 5) and resolution of the region of the helicopter experiments on these satellite images (note that the resolution varies across AVHRR and MODIS images). There is considerable variation in the view zenith angle and the relative azimuth angle whereas the range in solar zenith angles is rather limited (42-56° for Vatnajokull and 45-49° for the K-transect).

Fig. 5. Coordinate system used to describe the solar-view geometry. The system consists of the solar zenith angle (θ s), the view zenith angle (θ v) and the relative azimuth angle (ϕ). The latter is defined relative to the solar principal plane, i.e. the Sun is at ϕ = 0°. Consequently, forward scattering corresponds to ϕ = 180° and back scattering to ϕ = 0°.
Table 2. Time of acquisition, solar-view geometry and approximate resolution of the AVHRR (across-track-along-track) and MODIS data used for comparison with the helicopter albedos

Three AVHRR images were available for each experiment (six images in total), but in four (two for both experiments) of these images, the area of the experiment was viewed from relatively large zenith angles (>54°). The original AVHRR data were resampled to a resolution of 1.0 km, which is slightly finer than the resolution of the AVHRR data for nadir view (1.1 km), so that no information was lost. The AVHRR data were all obtained from the NOAA-14 satellite and delivered as uncalibrated counts.
Because MODIS was launched after the experiment in Iceland, MODIS images were only available for the Greenland experiment. We used ‘calibrated, geolocated radiances’ (level 1B data), a product valid for the top of the atmosphere. The acquired data were ‘Version 4 data’, which according to NASA is a ‘validated product, ready for use in scientific publications, although improved versions may appear later on’. Our MODIS data were resampled to a nominal resolution of 1.0 km. The real resolution at the view angles under which the K-transect was observed is somewhat coarser.
3.2. The retrieval method
To obtain surface albedos, we processed the raw satellite data as follows:
-
1. The AVHRR images were geolocated manually, both with ground-control points and by matching the ice-cap (or ice-sheet) margin on the images with the position of the margin in DEMs. Differences between these two methods do not exceed 1 km, which is therefore considered the accuracy of the geolocation of the AVHRR data. According to the requirements, MODIS geolocation should be accurate to 0.1 pixel (~0.1 km).
-
2. In agreement with our own observations in the field, clouds were almost absent on the satellite images within the region of the helicopter experiments. The only notable exception was the AVHRR image of 1735 GMT for Greenland. At this time, cirrus clouds coming from the southeast covered the easternmost part of the flight legs. We excluded the corresponding satellite data from the comparison.
-
3. The AVHRR counts were converted into effective narrowband reflectances by means of the calibration coefficients, where ‘reflectance’ refers to the fraction of the incoming radiation reflected in the direction of the satellite (note the difference to the albedo, which is the hemispherically averaged reflectance). The AVHRR calibration coefficients were taken from Reference Rao and ChenRao and Chen (1999) and are time-dependent in order to account for degradation of the instruments. The MODIS Science Team calibrated the MODIS data before delivery.
-
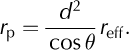
4. The effective narrowband reflectances (r eff) were converted into planetary narrowband reflectances (r p) by taking into account the effects of the solar zenith angle with respect to a horizontal surface (θ) and the varying distance between the Sun and Earth (d in astronomical units):
(1)
Here, ‘planetary’ means that the reflectances are valid for the top of the atmosphere.
-
5. We made corrections for the atmosphere and for anisotropic reflection by the surface. The directional distribution of the reflected radiation is described by bidirectional reflectance distribution functions (BRDFs). The atmospheric and BRDF corrections must be made simultaneously because the atmosphere also has an effect on the directional distribution of the signal (Reference RahmanRahman, 1996). This effect is taken into account by the radiative transfer model (6S) that we used for the calculation of the atmospheric correction. This model allows the use of custom-prescribed surface BRDFs.
For each image a relationship of the following form was established between the known planetary narrowband reflectance and the unknown surface narrowband albedo (αs):
(2)where the ci are coefficients and z is surface elevation. The coefficients depend on the solar-view geometry, atmospheric conditions and the surface type. The latter dependence is due to the fact that different surface types have different types of BRDFs. This approach was only feasible because the solar-view geometry varied little within the regions of the experiments (none of the angles characterizing the solar-view geometry varied by >3°).
We specified the atmospheric conditions as follows:
atmospheric profiles of pressure, temperature and water vapour from European Centre for Medium-Range Weather Forecasts analyses;
a mixture of 15% (by volume) dust-like aerosols, 70% (by volume) water-soluble aerosols and 15% (by volume) oceanic aerosols; no soot;
an optical thickness for aerosols equal to 0.065 at 550 nm (as measured by Reference Stroeve, Nolin and SteffenStroeve and others, 1997, at the ETH Camp), which corresponds to a visibility of 109 km;
total ozone determined with space-borne Total Ozone Mapping Spectrometers.
We made calculations, and therefore established different relationships, for three different types of BRDF:
BRDFs of melting ice according to the parameterization proposed by Reference Greuell and de Ruyter de WildtGreuell and De Ruyter de Wildt (1999);
BRDFs of melting snow according to the parameterization proposed by Reference KoksKoks (2001);
isotropic reflection.
We used the BRDFs measured in TM band 2 for AVHRR band 1 and MODIS bands 1 and 4, and the BRDFs measured in TM band 4 for AVHRR band 2 and MODIS band 2 (see Fig. 2; Table 1).
For each situation (a specific image with its solar-view geometry and atmospheric conditions, satellite band and BRDF), we ran the radiative transfer model for various values of a s ranging between 0.1 and 1.0, and various values of z (varying roughly over the range of elevations within the region of the experiment). After completing these calculations, a least-squares fit was made to Equation (2). Residual standard deviations were all ͬ0.01. Inclusion of other terms on the righthand side did not improve the performance of Equation (2). Note that the residual standard deviation is only a measure of the quality of the fit of discrete values of a s(rp), computed with the radiative transfer model, to Equation (2). It is not an estimate of the total accuracy of the atmospheric and BRDF correction since it includes neither inadequacies in the 6S radiative transfer model nor uncertainties in atmospheric conditions and BRDFs.
-
6. Finally, a correction for the effect of the sloping surface on the incoming radiation was carried out as by Reference Klok, Greuell and OerlemansKlok and others (2003):
(3)where α s and α’s are the corrected and uncorrected surface narrowband albedos, f diff and f dir the diffuse and direct fractions of the incoming shortwave radiation (computed with the 6S model) and θ s and θ the solar zenith angles with respect to the real and a horizontal surface. We computed surface orientation and tilt from DEMs with a grid size of 0.5 × 0.5 km for Vatnajokull and ~2 × 2 km for Greenland (Reference EkholmEkholm, 1996).

3.3. Accuracy of the satellite-derived albedos
In this subsection, the causes of uncertainty in the satellite-derived albedos are discussed so that possible differences with the ‘ground-truth data’ can be interpreted more easily.
-
1. Equations for time-dependent calibration coefficients for the AVHRR band 1 and 2 sensors have been proposed in various papers. They may differ substantially. For example, the coefficients for the sensors on board NOaA-14 as derived by Reference Tahnk and CoakleyTahnk and Coakley (2001) differ by up to 12% from the calibration coefficients that we used (those given by Reference Rao and ChenRao and Chen, 1999). Both Reference Rao and ChenRao and Chen (1999) and Reference Tahnk and CoakleyTahnk and Coakley (2001) take the calibration coefficients of the AVHRR sensors on board NOAA-9 as reference. Therefore, the absolute accuracy of the NOAA-9 sensors must be added to the relative accuracy of the NOAA-14 sensors, but we were unable to find this information. In conclusion, the absolute accuracy of the AVHRR coefficients is of the order of 10% or more. Compared to the AVHRR sensors, the absolute uncertainty in the calibration coefficients of the MODIS sensors is much better, namely ͬ2% (Reference JusticeJustice and others, 2002).
-
2. For individual pixels, errors in the surface albedo due to errors in the surface slope and orientation can be considerable. However, the slopes of the observed surfaces in Iceland and Greenland were generally relatively small. More importantly, for the comparisons (section 5) we considered averages of satellite-derived and helicopter albedos over distances larger than 10 km, a scale on which topographic errors cancel out because it is much larger than the grid size of the DEMs. In conclusion, errors due to insufficient knowledge of the topography are negligible (ͬ0.01).
-
3. We calculated the uncertainty in the atmospheric correction due to uncertainties in the composition of the atmosphere by performing sensitivity runs with the radiative transfer model. We did this for all the relevant AVHRR and MODIS bands and for the solar-view geometries of the satellite data used for the comparison. In the sensitivity runs, the water-vapour content of the atmosphere was reduced to 80% of its original value, the mixture of aerosol types was varied within reasonable limits, the aerosol optical thickness was halved and the ozone amount was reduced to 95% of its original value. For all the satellite bands and solar-view geometries, the effect on the surface albedo of different amounts of water vapour and ozone and of different aerosol types was <0.001, with the exceptions of water vapour in AVHRR band 2 and the soot fraction of the aerosol, both of which had an effect on the surface albedo >0.001 but <0.01. Variation in aerosol optical depth had an effect <0.01, but for the images with view zenith angles >50°, the effect could become somewhat larger than 0.01, depending on the type of BRDF chosen. Note that in regions where the atmosphere contains more water vapour and aerosols than the relatively dry and clean polar atmosphere over Iceland and Greenland, the atmospheric correction is more sensitive to uncertainties in atmospheric composition.
-
4. Reference LyapustinLyapustin (2002) assessed errors due to shortcomings in the treatment of radiative transfer in the 6S model, given perfect knowledge of atmospheric and surface conditions. He did so by comparing 6S calculations with calculations made with SHARM-3D, which is a more rigorous radiative transfer model than 6S. He showed that the differences increase with the solar and view zenith angles and he claims that ‘in cases of high surface anisotropy’, which is the case for glacier ice, ‘the error can be as high as 9-10%’. We cannot derive error estimates for our Sun-satellite target geometries and BRDFs from the examples provided by Reference LyapustinLyapustin (2002).
-
5. It is not possible to make a meaningful estimate of the uncertainty caused by inadequacies in the applied BRDFs. The BRDFs for melting ice as employed in this study are parameterizations based on measurements at three different sites, with varying amounts of near-surface meltwater, all on Morteratschgletscher, Switzerland. These BRDFs have a maximum in the forward direction which becomes more pronounced with increasing solar zenith angle. Certainly, varying amounts of dust and debris as they occur especially on Vatnajokull have a completely different effect on the BRDFs than varying amounts of meltwater. Moreover, along the K-transect, the ice within 10-20 km of the ice-sheet margin was characterized by bumps and valleys of considerable steepness (typically 10-20°) and height (up to 10m). For a surface that is an isotropic reflector on a scale smaller than that of the surface roughness elements, such elements cause maximum reflection in the backward direction and minimum reflection in the forward direction. Therefore, the effect of surface roughness at any scale larger than the length scaleof the surface over which the BRDFs were measured (≈10 × 10 cm) is to reduce the amount of anisotropy found in the measured BRDFs (see also Reference Warren, Brandt and O’Rawe HintonWarren and others, 1998). Under large solar zenith angles, very rough snow and ice surfaces should even have a maximum in the backward direction, instead of the maximum in the forward direction for horizontal terrain. The problem is that the AVHRR and MODIS data used in this study do not contain any information about the surface characteristics in terms of amounts of meltwater, concentrations of dust and debris, or surface geometry. In addition, BRDFs of ice surfaces with variable concentrations of dust and debris and variable surface geometry have not been established. Similar arguments apply to the uncertainty in snow BRDFs. For snow, the variable characteristics that affect the BRDFs are probably grain- size, water content, dust content and surface geometry. In conclusion, quantification of BRDF-related errors is currently impossible, but the error can be of the order of magnitude of 0.10 or larger.
In summary, errors in the satellite-derived surface albedo due to inaccuracy in the description of the surface topography and in the assumed composition of the atmosphere are small (<0.01). At view zenith angles >50°, unknown aerosol loads can cause errors slightly more than 0.01. The largest error sources are probably inaccuracy of the calibration coefficients of the satellite sensors (only for AVHRR: 10% or more) and insufficient knowledge of surface BRDFs (0.10 or more). Errors due to shortcomings in the radiative transfer model (6S) could be up to 10%, but will certainly be less for our images obtained at small view zenith angles.
3.4. Ground truth for MODIS sensors
We did not perform helicopter measurements in MODIS bands, but Figure 2 shows that MODIS bands 4, 1 and 2 are situated more or less in the middle of TM band 2, and AVHRR bands 1 and 2, respectively (see also Table 1). The question is, therefore, whether the helicopter measurements in the AVHRR and TM bands can be used as ground truth for surface albedos derived from satellite data in the corresponding MODIS bands. The answer is positive if the corresponding narrowband albedos (e.g. MODIS 4 and TM 2) have ratios that are independent of the type of snow and ice. To check this, we generated 70 spectral albedo curves with a simple radiative transfer model (Reference Reijmer, Bintanja and GreuellReijmer and others, 2001). These curves represent snow ranging from fine- to coarse-grained, ice ranging from clean to very dirty, and blue ice. Figure 2 shows two examples. The generated curves match measured curves (Reference Reijmer, Bintanja and GreuellReijmer and others, 2001) very well. Next, we computed narrowband albedos (αnb) for these 70 fictitious snow and ice surfaces, using the following equation:

where α(λ), R(λ) and G(λ) are the spectral albedo, the spectral response of the sensors (Fig. 2) and the spectral incoming radiative flux, respectively. Table 3 gives statistics of the ratios ![]() Averages are close to 1 (1.001, 0.999 and 1.006, respectively) and, more importantly, the standard deviations and ranges are much smaller than the differences between the helicopter and the satellite albedos (see section 5). This is especially true for
Averages are close to 1 (1.001, 0.999 and 1.006, respectively) and, more importantly, the standard deviations and ranges are much smaller than the differences between the helicopter and the satellite albedos (see section 5). This is especially true for ![]() because within these bands the spectral albedo is almost constant. Therefore, we used the albedos in TM 2 and AVHRR 1 measured from the helicopter as ground truth for the satellite albedos in MODIS bands 4 and 1, respectively. The variation in
because within these bands the spectral albedo is almost constant. Therefore, we used the albedos in TM 2 and AVHRR 1 measured from the helicopter as ground truth for the satellite albedos in MODIS bands 4 and 1, respectively. The variation in ![]() is larger than the variation in the other two ratios because the spectral albedos of snow and ice vary dramatically within AVHRR 2. Nevertheless, we used the helicopter albedos for AVHRR 2 to validate the satellite-derived albedo in MODIS 2 after dividing the satellite albedos by the mean ratio of 1.006. The associated uncertainty (0.015) should be kept in mind.
is larger than the variation in the other two ratios because the spectral albedos of snow and ice vary dramatically within AVHRR 2. Nevertheless, we used the helicopter albedos for AVHRR 2 to validate the satellite-derived albedo in MODIS 2 after dividing the satellite albedos by the mean ratio of 1.006. The associated uncertainty (0.015) should be kept in mind.
Table 3. Statistics of ratios of narrowband albedos for different types of snow and glacier ice. The ratios were computed for 70 types of snow and ice (see text)

4. Surface Conditions during the Experiments
Calculations with energy-balance models (Reference Greuell, Reijmer and OerlemansGreuell and others, 2002) suggest that all the ice and snow surfaces observed during the experiments were melting. The ice of the K-transect was relatively clean (broadband albedo 0.35-0.50), whereas much volcanic dust and debris from nunataks covered the ice of VatnajOkull (broadband albedo 0.10-0.30). The ice of the K-transect was also much wetter than the ice of Vatnajokull. These differences in surface characteristics affected the temporal variation in the albedo during the measurements.
In Iceland, we repeated one flight leg over the ice- exposed area of BreiSamerkurjokull during each of the three flights. On average, the differences in the broadband and narrowband albedos obtained during these three flights over the same area appeared to be negligible (ͬ0.005).
In Greenland the situation was different. Figure 6 shows the albedos in the two AVHRR bands, as a function of longitude for the first and the second helicopter flights. Only results from the flights upwards over the ice sheet are shown. Parts of the helicopter flights over the ice-exposed area that coincide exactly (9 km long) reveal albedo decreases of 0.05 in TM 2, 0.09 inTM 4, 0.06 in AVHRR 1, 0.08 in AVRHRR2 and 0.07 in the broadband during the 3.5 hours between the two flights. This can only be attributed to increased accumulation of meltwater on the surface during the day (see Reference GreuellGreuell, 2000). Along the rest of the transect, where the helicopter flight paths did not exactly coincide, there is more scatter in the differences between the albedos of the two flights, but the tendency is the same.

Fig. 6. Surface albedos in AVHRR bands 1 and 2 measured along the K-transect during two helicopter flights upwards over the ice sheet performed at different times of the day (7 July 2000). Albedos are plotted as a function of longitude. Though the flight-lines did not coincide exactly, the albedos clearly tend to decrease with time along the entire observed part of the transect. The part where the two helicopter flight-lines coincided almost exactly is indicated.
The observed decreases for snow at the K-transect are smaller than for ice and can be ascribed to increased wetting of the snow during the day. For the snow at Vatnajokull, we could not compare albedos to investigate variation with time because the two flights over snow were made in different areas (Fig. 3). We expect a decrease similar to that found for the snow of the K-transect occurred.
In summary, we have evidence that during the course of the experiments the ice albedo decreased along the K-transect, whereas it remained constant at Vatnajokull. Along the K-transect the snow albedo decreased in time, though less than the ice albedo.
5. Validation of the Satellite-Derived Albedos with the Helicopter Albedos
5.1. Introduction
In this section we compare the satellite-derived albedos with the helicopter albedos. Figures 7-10 show albedos as a function of the distance along the flight-lines. The albedo curves, for both Vatnajokull and the K-transect, tend to show two levels, one for ice and one for snow. Therefore, we have computed and compared the averages of the satellite- derived and the helicopter albedos over entire flight portions above ice and snow (see Table 4).

Fig. 7. Comparison of the surface albedo along the K-transect as measured from a helicopter with surface albedos derived from satellite data acquired on the day of the helicopter measurements (7 July 2000). The upper two panels are for AVHRR band 1 and MODIS band 1. The lower two panels are for AVHRR band 2 and MODIS band 2. The two panels to the left represent the flight before solar noon; the two panels to the right represent the flight after solar noon (see also Fig. 4). The legend gives the times at which the data were acquired.

Fig. 8. Same as lower right panel of Figure 7, but here satellite albedos are derived with two different assumptions about the BRDFs.

Fig. 9. Same as lower right panel of Figure 7, but satellite albedos are derived from three AVHRR images obtained from the view angles given in the legend.

Fig. 10. Comparison of the helicopter-measured surface albedo in AVHRR band 2 over Vatnajökull with surface albedos derived from satellite data in the same band and acquired at 1524 GMT on the day of the helicopter measurements (6 July 1999). The three panels correspond to different flights over the ice sheet (see Fig. 3). Satellite albedos retrieved with and without BRDF correction are shown.
Table 4. Comparison of helicopter-measured surface albedos along the K-transect (7 July 2000) and of Vatnajoökull (6 July 1999) with surface albedos derived from AVHRR and MODIS images acquired on the days of the helicopter measurements. Satellite albedos retrieved with and without BRDF correction are given. The values shown (one for snow and one for ice) are averages over the given flight distances. For the K-transect, we only considered those flight portions that were made within roughly half an hour of the acquisition time of the images. Also, data obtained from a helicopter height of <100m above the surface were omitted

5.2. The Kangerlussuaq transect
Figure 7 shows albedos along the K-transect in AVHRR bands 1 and 2 and MODIS bands 1 and 2. For the computation of the satellite-derived albedos we used the complete retrieval method as described in section 3.2, including the correction for anisotropic reflection at the surface. No satellite-derived albedos are shown for the transitional areas with a mixture of snow and ice, because ice and snow BRDFs are different. For AVHRR, we considered only the image with the smallest, and therefore most favourable, view zenith angle (16°). However, we did not consider this image for the snow-covered area because of the presence of clouds at the time of the satellite overpass. The differences between the various albedos in the ice-covered area can possibly be explained by temporal variations in the real surface albedo (see section 4, Fig. 6) in the following way. Until 1600 GMT, the albedo decreased due to increased accumulation of meltwater. After that time, the albedo increased again. Perhaps the amount of meltwater had already been decreasing between 1600 and 1735 GMT (note that solar noon is at 1525 GMT). Errors in BRDF corrections could also explain the apparent increase in albedo. Real changes in albedo due to an increase in the solar zenith angle are unlikely to play a role at the relatively small solar zenith angles (45° at 1602 GMT and 49° at 1735 GMT). In order to remove the complication of the temporal variations in the albedo, Table 4 contains only averages of the helicopter measurements over those flight portions of the K-transect that were made within roughly half an hour of the acquisition time of the images used in the comparison. The differences are small: satellite-derived albedos corrected with BRDFs differ from the helicopter albedos by 0.01 in both AVHRR bands, by 0.03 (ice and snow) in MODIS band 1, and by 0.00 (ice) and 0.02 (snow) in MODIS band 2. In MODIS band 4, the differences are 0.02 (ice) and 0.01 (snow).
The required accuracy of the surface albedo in climate models and in models simulating the mass balance of glaciers and ice sheets is of the order of 0.05. So, in the light of that requirement, the satellite-derived albedos discussed in the previous paragraph are ‘validated’. This could mean that each of the steps of the retrieval method is accurate enough. However, it is not proof of that, because there could be compensatory effects (e.g. errors in the calibration coefficients that compensate for errors in the BRDF corrections).
It is noteworthy that in the cases discussed so far (all the K-transect comparisons in Table 4), the BRDF correction produced an improvement. This is shown in Figure 8 for AVHRR band 2 and MODIS band 2,where satellite-derived albedos with and without BRDF correction are compared with helicopter albedos.
Figure 9 considers all of the three AVHRR images (band 2) of the K-transect. The albedos derived from the image of 1735 GMT have been discussed above (Figs 7 and 8). Here we focus on the two images acquired at relatively large view zenith angles (68° and 57°). This implies larger footprint sizes (Table 2). Portions of the curves within one footprint size of the ice margin were omitted because the tundra influenced those data. Surface albedos derived from the image of 1415 GMT (view zenith angle = 68°) agree very poorly with the helicopter albedos. The data were acquired from a forward direction (relative azimuth angle = 146°), where, according to the BRDFs that we used, the radiance varies strongly with view direction. Therefore, the uncertainty in the BRDF correction is relatively large in all areas (snow, bare ice and transition from snow to bare ice). In addition, errors in the calibration coefficients of the satellite sensors and in the 6S model might play a significant role. The uncertainty related to the composition of the atmosphere, including aerosol optical thickness, is too small, by one order of magnitude, to explain the discrepancy. In fact, the albedo curve for the image of 1415 GMT suggests strong spatial smoothing, but note that this occurs on a scale that is much larger than the resolution of the image (still only ~3 km in the helicopter flight direction).
The agreement between the helicopter data and the data of the image of 1554 GMT is reasonable for large portions of the flights, but there is a significant mismatch in the bare ice area, which increases towards the margin. This may be an unaccounted BRDF effect caused by bumps and valleys with a steepness that increases towards the margin. We conclude that satellite data obtained at too large view zenith angles are not suitable for retrieval of the surface albedo. The threshold lies at a view zenith angle between 43° (albedos derived from the MODIS image acquired at this angle are in good agreement with the helicopter albedos; see Fig. 7) and 57° (AVHRR image of 1554 GMT).
5.3. Vatnajökull
For Vatnajökull, three AVHRR images were available (but no MODIS images). Figure 10 compares the satellite-derived albedo with the helicopter albedo for the image obtained from a near-nadir view direction and band 2. Table 4 summarizes the comparison for both AVHRR bands and two images, excluding the image of 1706 GMT because its view zenith angle (65°) is larger than the threshold determined from the data of the K-transect. We averaged the helicopter data, measured over snow and ice during the entire day, to obtain single snow and ice values. This is justified by the fact that, in contrast to the situation along the K-transect, the surface albedo of the ice did not change during the helicopter measurements (see section 4). A small decrease in albedo probably did occur over the snow, in analogy with the situation along the K-transect.
We first compare Vatnajokull’s ice albedos. There are four samples (two images x two bands). The differences between the helicopter and satellite albedos corrected for anisotropic reflection at the surface are 0.06, -0.01, 0.03 and -0.05 (Table 4). These differences may seem small in an absolute sense but they are large in a relative sense, with measured albedos of 0.29 for band 1 and 0.22 for band 2. Errors in the calibration coefficients of the satellite sensors and errors in the atmospheric composition can be ruled out in explaining the differences, as errors in the albedo due to these factors are more or less linear in the albedo and the albedo is relatively small. For the same reason, shortcomings in the 6S model probably have only a small effect (Reference LyapustinLyapustin, 2002, gives errors in terms of percentages). This leaves the BRDF corrections as the main factor to explain the discrepancies. These corrections are large (0.05-0.07) because the albedo itself is small and the corrections increase in absolute magnitude with decreasing albedo (see Reference Greuell and de Ruyter de WildtGreuell and De Ruyter de Wildt, 1999). It is striking that in three out of the four cases, the satellite albedo derived with the assumption of isotropic reflection is nearer to the helicopter albedo than the satellite albedo that is corrected with the BRDFs. Figure 10 displays one such case (AVHRR band 2, image 1524 GMT). This suggests that the ice BRDF parameteriza- tions used in this study are not applicable for Vatnajokull. Indeed, the BRDF parameterizations represent surfaces with varying amounts of meltwater. Therefore, they might be applicable to the wet and clean surfaces of the K-transect but not to the dry and dirty ice of Vatnajokull. We conclude that, since the uncertainties in the BRDF corrections are of the same magnitude as the corrections themselves, the differences between the helicopter and the satellite-derived ice albedos could actually be caused entirely by erroneous BRDFs.
We also had four samples of helicopter and satellite- derived albedos to be used in a comparison for the snow of Vatnajokull. They differ by 0.03, 0.06, -0.03 and 0.04 (Table 4). As argued above, uncertainties due to atmospheric composition are ͬ0.01. A sensitivity experiment showed that this was also true for the uncertainty in aerosol optical depth and the image of 1343 GMT, even though the view zenith angle of this image is relatively large (54°). Because the albedos of snow are higher than the albedos of ice, the uncertainties due to the calibration coefficients of the satellite sensors are significant (0.09 in band 1 and 0.07 in band 2 for an error of 10% in the coefficients), and errors due to shortcomings in the 6S model could also be important. The uncertainty due to the use of incorrect BRDFs is difficult to quantify but could be as large as the uncertainty due to the calibration coefficients (~10%). Possibly, errors in the calibration coefficients, in 6S and in the BRDFs all have a significant effect on the satellite- derived snow albedo. With our small number of samples, it is impossible to tell which of these three error sources is the most important in explaining the differences between the helicopter albedos and the satellite-derived albedos.
6. Summary, Conclusions and Discussion
We have used surface albedos of snow and ice measured from a helicopter to validate albedos derived from AVHRR and MODIS data. Whereas the uncertainty in the helicopter albedos is relatively small (2%), uncertainties in the satellite- derived albedos are much larger. We conclude that the main contributions to this uncertainty stem from the calibration coefficients of the AVHRR sensors (10% or more, but only 2% for MODIS), the BRDFs and the radiative transfer code. The latter two sources of error increase with the solar and the view zenith angle and they are difficult to quantify, but the orders of magnitude are 0.10 and 10%, respectively. Reference StroeveStroeve (2001) drew a similar conclusion for retrieval of the surface albedo of the Greenland ice sheet from AVHRR data, though she mentioned unknown aerosol amounts as an important factor instead of shortcomings in the radiative transfer model.
MODIS images were only available for the experiment at the K-transect. The agreement between the helicopter and satellite albedos is within 0.02 for MODIS bands 2 and 4 and within 0.03 for MODIS band 1. The agreement is also very close (0.01) for surface albedos derived from AVHRR data obtained from a near-nadir view angle. For AVHRR data obtained at larger view zenith angles (57° and 68°), the agreement between the helicopter and satellite albedos is poor (differences of up to 0.10). Differences for AVHRR- derived albedos are also considerable for Vatnajokull (up to 0.06), especially in a relative sense (as the mean ice albedos are as low as 0.29 in AVHRR band 1 and 0.22 in AVHRR band 2). This is also true for data obtained from a near-nadir view angle.
From all these results, we conclude that images obtained from large view zenith angles (i.e. above 50-55°) are not suitable for the retrieval of the surface albedo. On such images, transitions like that from ice to snow are smoothed to an extent that cannot be ascribed to the resolution at these view angles. The smoothing already resides in the delivered data and is possibly an ‘adjacency effect’: part of the signal is not reflected by the surface area to which the sensor is pointing but by the adjacent area, and is consequently scattered towards the sensor by the atmosphere. Another problem at large view zenith angles is insufficient knowledge of BRDFs. Though this is a problem for all solar view geometries, the uncertainties increase with increasing view (and solar) zenith angles because the gradients in the BRDFs increase with the zenith angles. Note that our choice of ice BRDFs might explain why the satellite-derived ice albedos for the K-transect are in closer agreement with the helicopter albedos than the satellite ice albedos for VatnajOkull. As explained, these BRDFs might be more suitable for wet and clean ice surfaces (such as along the K-transect) than for dry and dirty surfaces (as on Vatnajokull). We conclude that more knowledge of BRDFs for ice and snow with various optical properties is needed to improve the retrieval of the surface albedo from satellite data.
It is not possible to use our results to draw conclusions about the accuracy of the calibration coefficients of the AVHRR sensors. The reason for this is that at least two of the other steps of the retrieval method, namely the BRDF correction and the radiative transfer code, cause considerable uncertainty in the satellite-derived albedos. Moreover, analysis of the role of errors in the calibration coefficients is hampered by the fact that the coefficients change in time. According to the formulation by Reference Rao and ChenRao and Chen (1999) used in this study, the coefficients of the sensors on board NOAA- 14 change by 4.5% (band 1) and 3.5% (band 2) per year, which is the time-span between the two helicopter experiments. Reference Tahnk and CoakleyTahnk and Coakley (2001), however, give other rates of change in the same coefficients, so the values of Rao and Chen may be disputable.
Compared to most of the studies in the existing literature dealing with validation of satellite-derived albedos of snow and ice, the present study has two advantages. The first is essentially the spatial coverage of the airborne measurements, which is much better than that of ground-based data. The second is the use of narrowband pyranometers, which avoids the complication of NTB conversion or the calculation of narrowband albedos from spectral measurements. But the helicopter measurements also have practical disadvantages. Our data were collected on two days only. Gathering of ground-based data can be continued over long periods of time, which allows the observation of temporal variations in surface conditions. To perform a much larger number of helicopter experiments would be almost impossible due to the associated high costs, and the requirements of clear skies and the availability of a helicopter.
The comparisons presented in this paper should be repeated, either when we believe the retrieval method has been improved or when improved versions of the MODIS data become available.
This paper does not deal with NTB conversion. This processing step must be made after determination of the narrowband surface albedos. Using the helicopter data of this study, plus ground-based data from a glacier in the Alps and from Antarctica, we have shown in a previous paper (Reference Greuell, Reijmer and OerlemansGreuell and others, 2002) that NTB conversion causes only minor uncertainty (~0.01) in the broadband albedo.
Acknowledgements
We are very grateful to the following people and institutions that enabled us to carry out the helicopter measurements. H. Snellen was in charge of all electronics and did much of the work in the field; J. Brand and E.-J. de Jong constructed the frame holding the sensors; S. Tijm was always ready to provide the latest weather forecasts; and Thyrluthjonustan HF and Gronlandsfly placed their helicopters at our disposal on the days we really needed them. We also thank P. Jonker, R. Wolfe and D. Hall for their help with reading the MODIS data, E. Vermote for his assistance in interpreting the 6S manual and F. Dentener for his advice about atmospheric aerosol loads. We appreciate the comments by L. Klok, C. Reijmer and R. van de Wal on an earlier version of this paper and the language corrections suggested by A. Souren. The Dutch National Research Programme on Global Air Pollution and Climate Change (NOP-II project 013 001236.10) financed the project.


