


Introduction
Endoparasites are well-known disease-causing organisms in different livestock species. The endoparasites that are commonly found globally in sheep and goats are (i) lungworms such as Dictyocaulus sp. and Muellerius capillaris; (ii) gastrointestinal tract worms including Trichostronglidae family-like Haemonchus contortus, Teladorsagia ostertagii, and Trichostrongylus axei; and coccidia such as Eimeria or Isospora; and (iii) liver worms such as Fasciola hepatica (Tóth et al. Reference Tóth, Khangembam, Farkas, Oláh, Vass and Monori2019). Gastrointestinal parasites are the most disease-causing worms in different livestock species. Among the gastrointestinal parasites, Haemonchus contortus is considered as one of the fatal parasites causing severe loss of blood and productivity (Regassa et al. Reference Regassa, Birhane, Getahun and Chalchisa2024).
Haemonchus contortus (HC) is a blood-sucking parasite of the rennet-bag or abomasum causing Haemonchosis in animals (Arsenopoulos et al. Reference Arsenopoulos, Fthenakis, Katsarou and Papadopoulos2021). This parasite is also very common to sheep, being one of the major gastroenteric nematodes they suffer from. Due to the blood-feeding behaviour of HC, symptoms like reduction in weight gain, decrease in packed cell volume (PCV), anaemic conditions, and mortality have been reported, which negatively impact animal production (Flay et al. Reference Flay, Hill and Muguiro2022). Upon the occurrence of HC infection, a 10–20% mortality rate has been reported in sheep (Brik et al. Reference Brik, Hassouni, Elkharrim and Belghyti2019). One HC worm has been reported to consume 0.05 ml of blood from its host per day (Angulo-Cubillán et al. Reference Angulo-Cubillán, García-Coiradas, Cuquerella, De la Fuente and Alunda2007).
The HC infection occurs when a pasture contaminated with its third-stage larvae (L3) is consumed. Faecal egg count (i.e., counting parasite eggs in sheep faeces) is a parasitological parameter for HC diagnostic purposes and is also the major method of measuring parasite burden. The HC infection is usually treated with conventional anti-anthelmintic drugs. The ample and untargeted use of these drugs may develop increased resistance in parasites (Dziduch et al. Reference Dziduch, Greniuk and Wujec2022). Some strategies that can be used as a solution to the problem are the use of genotypes of animals that are immune to parasitic infections and vaccines that are specific against gastroenteric nematodes (Alba-Hurtado and Muñoz-Guzmán Reference Alba-Hurtado and Muñoz-Guzmán2013).
Another solution is to classify the genes responsible for the inherited resistance in sheep against gastrointestinal parasites (Crawford et al. Reference Crawford, Paterson, Dodds, Tascon, Williamson, Thomson, Bisset, Beattie, Greer and Green2006). Genetic resistance against endoparasites has been studied in different sheep populations. In this regard, the immune response against parasitic infection has been considered. The most dominant immune system responses seen as a result of HC infection are blood clotting, wound healing, and platelet adhesion (Benavides et al. Reference Benavides, Sonstegard and Van Tassell2016). Instead of a few genes that play an important function against infection, several genes with varied effects determine the genetic resistance of the host against HC (Benavides et al. Reference Benavides, Sonstegard and Van Tassell2016). The immune genes that activate during HC infection include IFN-γ, genes that play a role in the formation of key cytokines (IL-3 and IL-6), DRB from major histocompatibility complex (MHC), Toll-like receptor (TLR) genes, TNF-α gene, suppressor of cytokine signalling 2 (SOCS2) gene, Platelet derived growth factor receptor alpha (PDGFRA) gene, Tyrosine protein kinase (KIT) gene, Chemokine (CXC) motif ligand (CXCL9, 10, 11, 13) genes, and Mucine (MUC7) gene (Benavides et al. Reference Benavides, Sonstegard and Van Tassell2016; Beraldi et al. Reference Beraldi, McRae, Gratten, Pilkington, Slate, Visscher and Pemberton2007; Gutiérrez-Gil et al. Reference Gutiérrez-Gil, Pérez, Álvarez, Martínez-Valladares, de la Fuente, Bayón, Meana, San Primitivo, Rojo-Vázquez and Arranz2009).
The SOCS2 gene, together with IgE and eosinophilia, is responsible for IL3 regulation; IL-3 further generates a typical host response to helminth infection through mastocytosis (Madden et al. Reference Madden, Urban, Ziltener, Schrader, Finkelman and Katona1991). This and other evidence suggest that SOCS2 could play a vital role in improving sheep’s immune response against gastrointestinal parasites (Benavides et al. Reference Benavides, Sonstegard and Van Tassell2016). Analysis of the abomasum of resistant sheep with HC infection has shown upregulation of several TLR genes, including TLR4 (Estrada-Reyes, Tsukahara, Amadeu et al. Reference Estrada-Reyes, Tsukahara, Amadeu, Goetsch, Gipson, Sahlu, Puchala, Wang, Hart and Mateescu2019). Resistance against HC infection has been associated with genetic variation among different sheep populations (Benavides et al. Reference Benavides, Sonstegard and Van Tassell2016). Frequently reported quantitative trait loci against parasitic infections have been found to be located on chromosome 20 (OAR20) of the sheep’s (Ovis aries) genome (Davies et al. Reference Davies, Stear, Benothman, Abuagob, Kerr, Mitchell and Bishop2006; Douch and Outteridge Reference Douch and Outteridge1989).
In this study, we evaluated faecal egg counts of the HC-infected sheep. We categorized the infected sheep into high- and low-infection groups based on the counts of HC eggs in their faeces. Genetic polymorphism of the SOCS2 gene was analyzed in these categories, which was associated with the HC infection to identify potential genetic markers for resistance in sheep.
Materials and methods
Animal selection
All the following animal experiments were performed as per guidelines laid by the Pakistan Animal Welfare Society and with prior approval of the Institutional Animal Care and Use Committee of the Institute of Biotechnology and Genetic Engineering, The University of Agriculture Peshawar.
Unrelated individuals of Purebred sheep aged 2–5 years were randomly selected and purchased from their breeding tracts located in different regions of the Khyber Pakhtunkhwa province of Pakistan (Ibrahim et al. Reference Ibrahim, Ahmad, Bangash, Alam, Sultana, Abbas, Khan and Sultana2023). These sheep were transferred to the University of Agriculture Peshawar Dairy Farm and raised under the same conditions in an open shed. The sheep were allowed to graze for 5–6 hours daily and fed with concentrates, wheat straw, and green fodder at stall. Proper care and veterinary facilities were provided when needed. The number of animals was kept minimum (10 animals per breed) to ensure proper care and maintenance and to reduce their number for experimental purposes.
The disease data were regularly monitored and recorded from the flock for each breed. Based on the prevalence record of gastrointestinal parasites and HC infection in the sheep flock, three sheep breeds (Balkhi, Ghalji, and Michni) showing high and low prevalence were selected. All the 30 sheep individuals (10 sheep per breed) of the three sheep breeds were selected for this experiment. The detailed experimental approach was as follows.
Experimental design
From the farm records, the sheep breeds were classified based on the prevalence of gastrointestinal parasite infection into highly infected and low infected. Based on that information, three sheep breeds – namely Balkhi, Ghalji, and Michni – were selected, showing differences in prevalence of gastrointestinal parasitic infection. Each individual of the three selected sheep breeds was further analyzed for variation in the parasitic load of HC through faecal egg count (FEC). Based on FEC data, the animals within each breed were grouped under high-infection and-low infection categories. Genomic DNA was isolated from the blood samples of the selected individuals. The desired region of the SOCS2 gene was amplified through PCR using specific primers. The PCR products were then sequenced using next-generation sequencing to identify polymorphism in the SOCS2 gene.
Collection of HC infection data
For collecting worm infection data, FEC was performed as a parasitological parameter for analyzing HC infection, as it is one of the established methods for recording parasite burden. Fresh faecal samples from the selected individuals of each sheep breed were collected and transferred to the laboratory in zip bags. An equal amount of the faecal samples were weighed (2 gm) and mixed with 10 mL of normal saline water. A 100-μL volume from the mixture was transferred to the slide (in three replicates), and the number of parasitic eggs within each sample was counted under a compound microscope. Stoll’s Egg Counting method (Stoll Reference Stoll1943) was used to calculate the number of eggs per gram of faeces. The HC eggs were identified under the microscope using an egg chart as a reference. General health signs (faecal consistency, body condition, mucosa colour, and nasal secretions) for each of the sheep individuals were recorded at the time of faecal sample collection.
Blood collection
For collecting the blood samples, conventional protocol was followed. Strict biosafety protocol was followed during the sampling process, including the wearing of protective disposable gloves and the use of sterile disposable syringes, to be protected against infectious transfers. The area around the sheep’s jugular vein was clipped and disinfected with methanol before sampling. About 3 mL of blood from the jugular vein of each individual was taken using a sterile disposable syringe. The samples were immediately transferred to EDTA-containing sterile tubes to prevent clotting. The blood samples were kept in an ice-box until they were shifted to the laboratory from the sampling area. In the laboratory, samples were stored in a freezer at –20°C, and were thawed before DNA extraction.
DNA isolation
For isolating DNA from the collected blood samples, the NucleoSpin Blood, DNA extraction kit (Mqcherey-Nagel; Product No.74051.250) was used. The process involved the use of proteinase K and lysis and washing buffers. In the final step, the buffer BE was used for eluting the DNA, and the purified DNA was transferred to sterile Eppendorf tubes in 40 μL nuclease-free water. Nanodrop and 1% agarose gel were used to confirm its purity and concentration.
Primer design
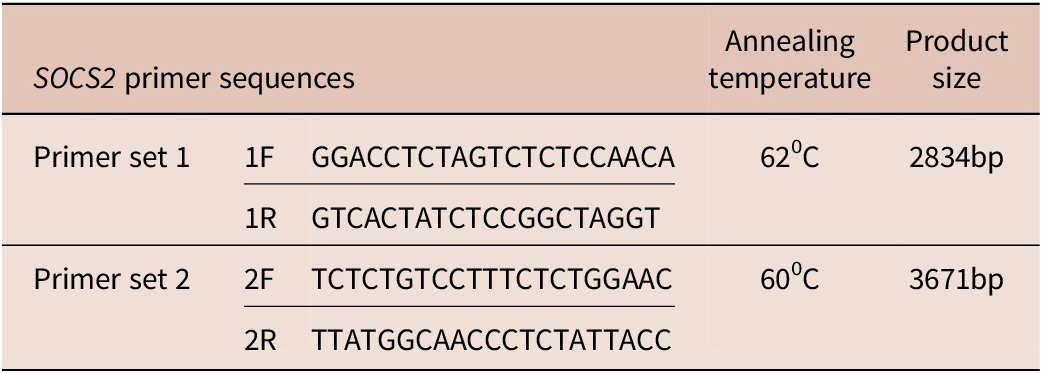
Primers were designed using NCBI, Primer 3 tool, UCSC browser, and primer BLAST tool. Two sets of primers were designed to cover the whole 5164 bps of the SOCS2 gene (Table 1). SOCS2 gene’s FASTA sequence was obtained using NCBI. Primer 3 tool was used to design the primers by adjusting all the conditions i.e. the size of the product, size of primer, Tm of primer, GC % of primer, max self-complementarity, max poly-X, and GC clamp. For confirmation of the designed primers, UCSC browser and UCSC Insilico PCR tool were used. For checking the specificity of the primers, primer BLAST tool was used.
Table 1. Forward and reverse primer sequences to amplify SOCS2 gene
Polymerase chain reaction
SOCS2 gene was amplified through polymerase chain reaction (PCR) using the designed primers. For the PCR, ABM Kodaq (cat# G497, ABM, Kampenhout, Belgium) PCR master mix was used. The numbers of samples for PCR were six from Balkhi (three high-infection and three low-infection), seven from Ghalji (five high-infection and two low-infection), and 10 from Michni (eight high-infection and two low-infection). A PCR reaction of 15 μL volume was run with the amplification conditions of initial denaturation at 94°C for 3 min (one cycle), followed by 30 cycles of denaturation at 94°C for 30 seconds, Annealing at primer-specific temperature (Table 1) for 30 seconds, and extension at 72°C for 4 min. The last cycle was followed by a final extension step at 72°C for 5 min (one cycle).
Next-generation sequencing
For double-stranded sequencing analysis, NGS technology was used. NGS libraries for paired-end sequencing (300bp insert size) were constructed from the extracted DNA by using a Library Preparation Kit (Illumina’s Nextera XT, Cat # FC-131-1096, Inc. San Diego, CA, Illumina) following the manufacturer’s protocol. To guarantee the reliability of the data, at each step of the procedure, quality control (QC) was performed. Libraries were normalized and used for Next Generation Sequencing through NGS equipment, MiSeq (Inc. San Diego, CA, Illumina).
NGS data analysis
The read qualities of fastq files were verified using the FastQC tool (v0.11.8). To remove low-quality base calls (Q<30) and index adapter sequences from both ends of sequenced reads, the Trimmomatic tool (v0.39) was used. The filtered reads were lined up to the latest reference genome of sheep (Oar_rambouillet_v1.0, Accession # GCF_002742125.1) using the Burrows-Wheeler Aligner (BWA, v0.6) algorithm along the default settings. PCR duplicates were removed from reads using Picard tools (v2.21.6). To resolve the issues that arise in mapping due to the presence of small InDels, mapped reads were analyzed by using command-line tools, ‘RealignerTargetCreator’ and ‘InDelRealigner’ of the Genome analysis toolkit (GATK v. 3.3.0). To fix the low or high quality of base, score analysis caused by different technical and standardized sequencing artifacts, GATK’s ‘BaseRecalibrator’ was utilized for base quality score recalibration (BQSR). GATK tool ‘HaplotypeCaller’ was used for calling SNPs and InDels through a local de-novo assembly of haplotypes in the deviation-presenting regions. GATK ‘Variant Filtration’ was used to remove possible false variants from the raw variants callset using default settings.
Data analysis
Means and standard errors of total parasitic eggs and HC eggs counts per gram faeces (EPG) in the faecal samples of different sheep breeds were analyzed using SPSS. One Way ANOVA was performed to analyze differences among the three sheep breeds and high- and low-infection groups within each sheep breed. Variations in the mean egg counts among sheep with different body conditions, mucosa color, faecal consistency, and nasal secretions were also evaluated using SPSS.
Sequence data obtained for the SOCS2 gene from the NGS analysis was analyzed to assess polymorphism among different sheep breeds, as well as among HC infection groups within each breed. The data were analyzed to calculate FST, allele frequencies, and shared and unique genotypes among infection groups using POPGENE. Variation in HC infection among different sheep breeds was correlated with genetic variation in the SOCS2 gene using Principal Component Analysis through SPSS to identify potential variants associated with high and low HC infection in sheep.
Results
The results showed a variation in the number of HC eggs in the faecal samples of different sheep breeds. Sheep with differences in HC egg counts in their faeces also showed variation in physical characteristic (i.e., general body condition, mucosal colour, faecal consistency, and nasal secretions). Variations were also observed in the sequence of SOCS2 gene among different categories of sheep showing association with HC infection. The detailed results are given in the following sections.
Faecal HC egg count varied among the sheep breeds
Microscopic pictures of the parasitic eggs and adult HC parasite are presented in (Figure 1). The numbers of HC eggs in the faecal samples of different sheep breeds are presented in Figure 2. The HC egg count was higher in the faeces of the Ghalji sheep (4022 ± 1162 EPG), followed by the Michni sheep (1988 ± 367 EPG), while Balkhi sheep showed significantly less HC egg count (1535 ± 553 EPG) in their faecal samples compared to the Ghalji sheep breed (p<0.05). The number of HC eggs in the faecal samples of Ghalji and Michni sheep breeds was statistically similar.

Figure 1. Microscopic pictures of Haemonchus contortus worms and their eggs. (A and B) Eggs of Haemonchus contortus. (C and D) Trichostrongylus eggs. (E) Adult Haemonchus contortus parasites isolated from the abomasum of sheep during post-mortem.
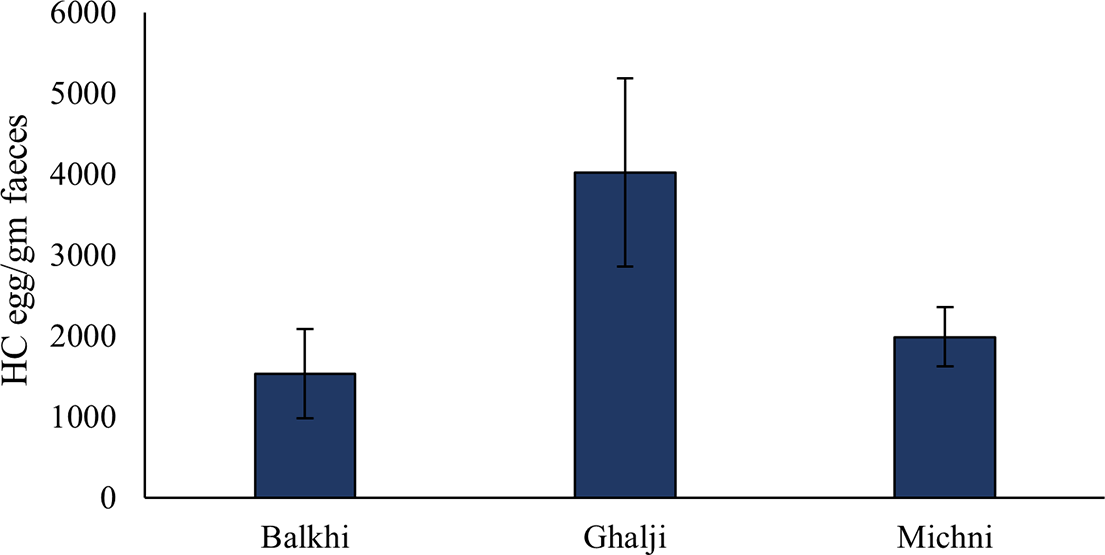
Figure 2. HC egg counts in the faecal samples of the three sheep breeds. Error bars indicate standard error. Numbers of observations were 10 for Balkhi, 10 for Ghalji, and 10 for Michni.
Based on the number of HC eggs in the FEC, the individuals within each sheep breed were categorized into high- and low-infected groups (Figure 3). Large proportions of Michni (80%) and Ghalji (77.8%) individuals were categorized as highly infected having HC egg count more than 1000 EPG. Comparatively, fewer (40%) Balkhi sheep individuals were categorized as highly infected based on the threshold value of HC egg count in their faeces. These high- and low-infection groups in each breed were further analyzed for variation in the sequence of the SOCS2 gene.
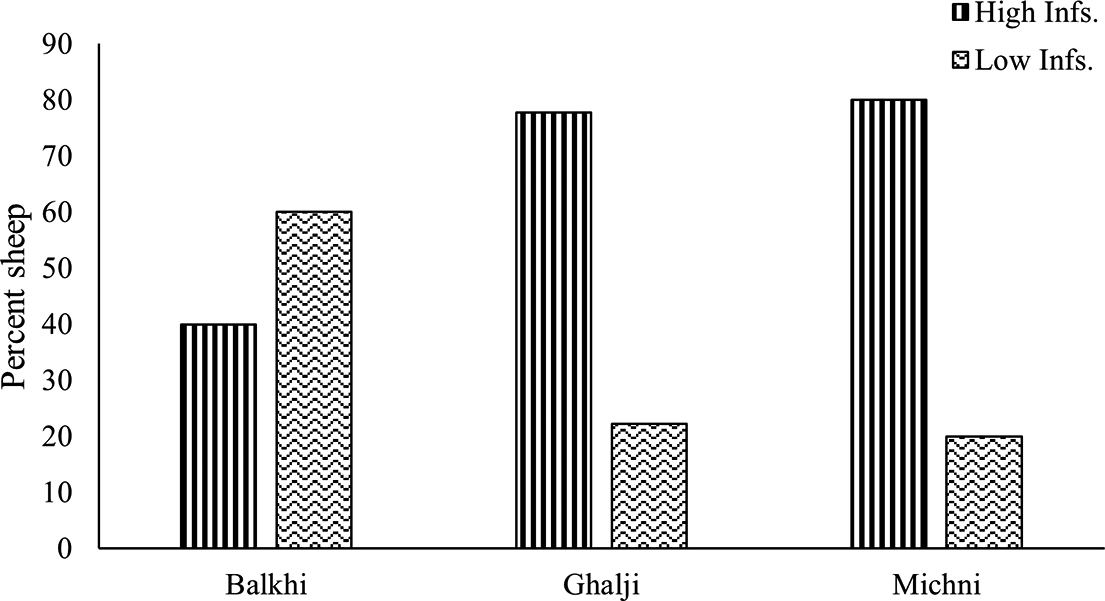
Figure 3. Categorizing sheep breeds on the basis of the HC eggs counts in faecal samples.
Sheep physiology affected by higher HC infection
The phenotypes affected by the number of HC eggs in the faecal samples include faecal consistency, sheep body condition, mucosa colour, and nasal secretions.
Faecal consistency affected % HC and total parasitic load
The mean number of HC eggs and total EPG in the faecal samples were calculated in sheep with different faecal consistency recorded at the time of sampling for each individual. Sheep with hard faecal consistency showed a higher number (4125 ± 1433 EPG) of HC eggs (Figure 4), while sheep having normal and soft faecal consistencies showed comparatively less percentage of HC eggs. Similarly, differences in total EPG were also associated with faecal consistency (Figure 4).
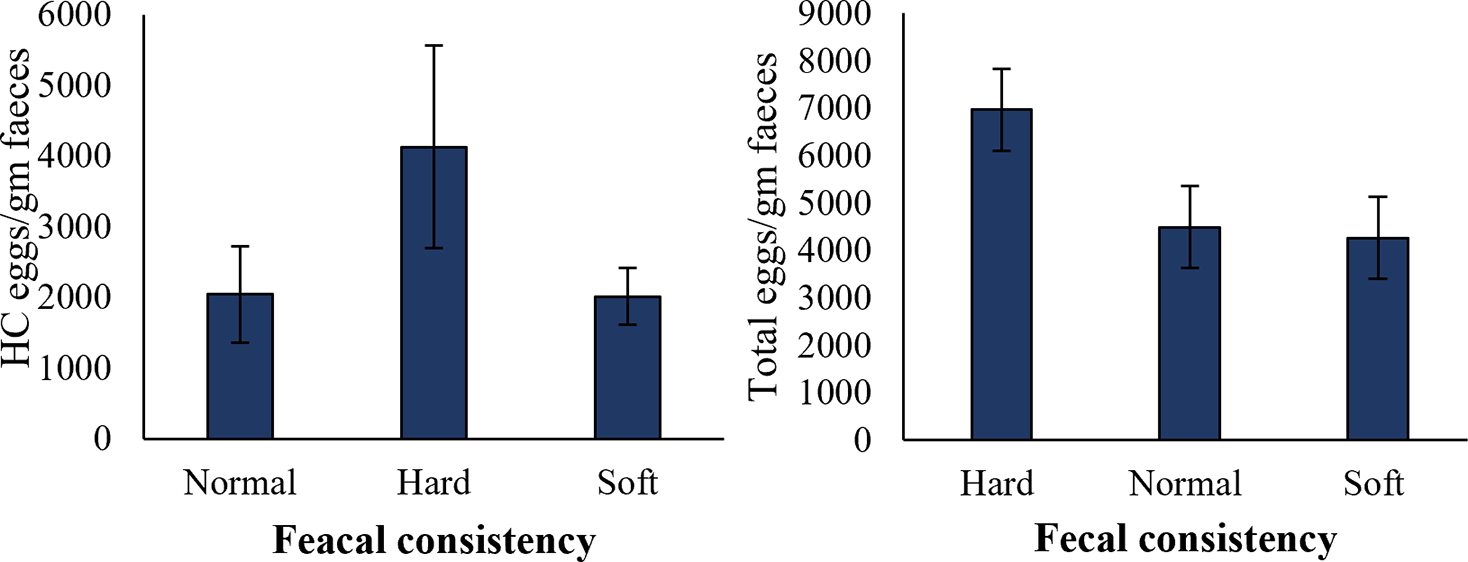
Figure 4. Variation in physical parameters of faecal samples based on the number of HC eggs and total parasitic eggs in faecal samples. Error bars indicate standard error. Number of observations for normal, hard, and soft faecal samples was 13, 8, and 9, respectively.
Faecal egg counts in sheep with different body conditions
The body condition (normal, healthy, and weak) of individual sheep was associated with the HC egg counts and total EPG in the faecal samples. The results showed no significant difference in the HC egg count among the sheep with different body conditions. Weak sheep showed an HC egg count of 2231 ± 392 EPG in their faecal samples, followed by healthy sheep (2486 ± 879 EPG). The number of HC eggs in the faeces of normal sheep was 2623 ± 913 EPG (Figure 5). Total EPG was also similar in the sheep with different body conditions (Figure 5).
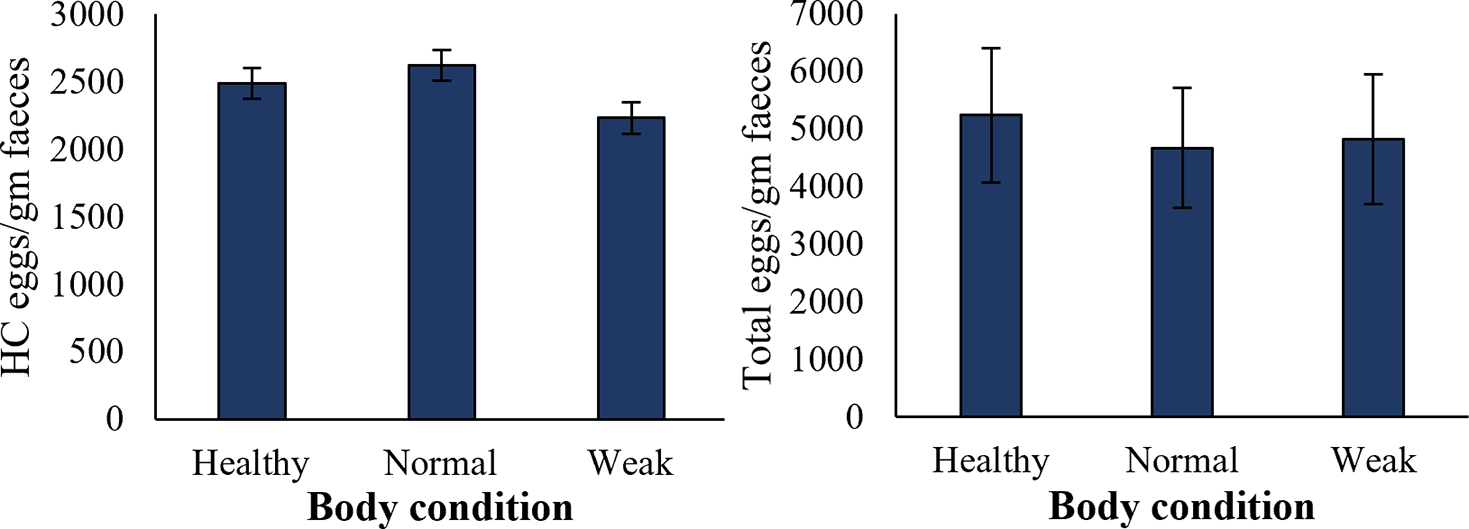
Figure 5. Effect of total parasitic load and HC egg counts on the body condition of sheep. Error bars indicate standard error. Number of observations were 10 for normal animals, 11 for healthy, and 8 for weak animals.
HC infection affects the mucosa colour of sheep
Sheep with different mucosa colour were evaluated for the number of HC eggs and total EPG in the faecal samples. The mucosa colour of the sampled individuals was categorized as pink, light pink, and pale. The results showed a higher number of HC eggs (3350 ± 100 EPG) in the faecal samples of sheep with pale mucosa colour (Figure 6). The sheep with light pink mucosa colour and pink mucosa colour showed comparatively less number (3006 ± 773 and 1480 ± 491, respectively) of HC eggs in their faecal samples. Total EPG was relatively higher in sheep having light pink mucosa colour (5977 ± 1101) compared to the sheep having pale (4167 ± 413) and pink mucosa colour (3703 ± 522); however, the differences were not significant (Figure 6).
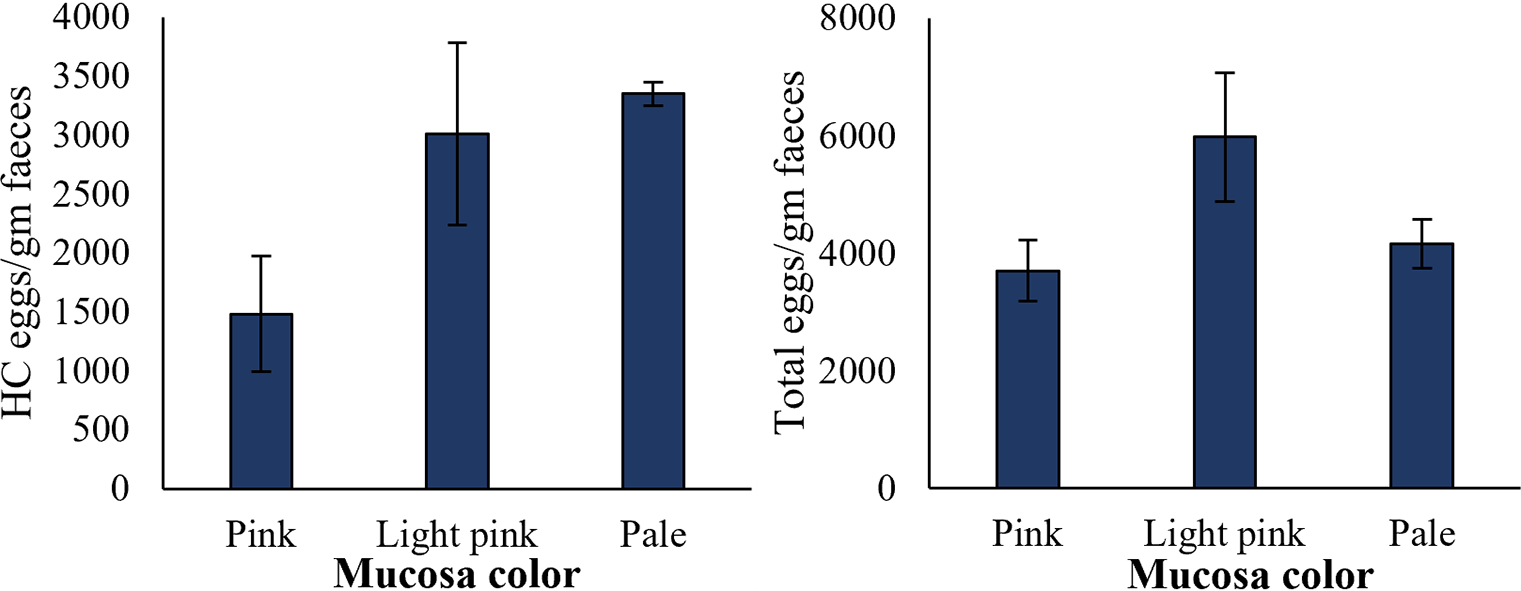
Figure 6. HC eggs counts and total parasitic eggs per gram faeces in sheep with different mucosa colour. Sample size was 11 for pink mucosa colour sheep, 15 for light pink, and 4 for pale mucosa colour sheep. Error bars indicate standard error.
Determining HC egg counts and total EPG based on nasal secretions
Based on nasal secretions, the number of HC eggs and total EPG were determined in the faecal samples of sheep. The sheep with no nasal secretions showed a slightly higher mean number of HC eggs in the faecal samples (2534 ± 484 EPG) than the ones with nasal secretions (1500 ± 1200 EPG); however, the difference was not significant (Figure 7). Total EPG was also non-significantly higher (5064 ± 661) in sheep with no nasal secretions and low (3075 ± 1825) in sheep with nasal secretions (Figure 7).
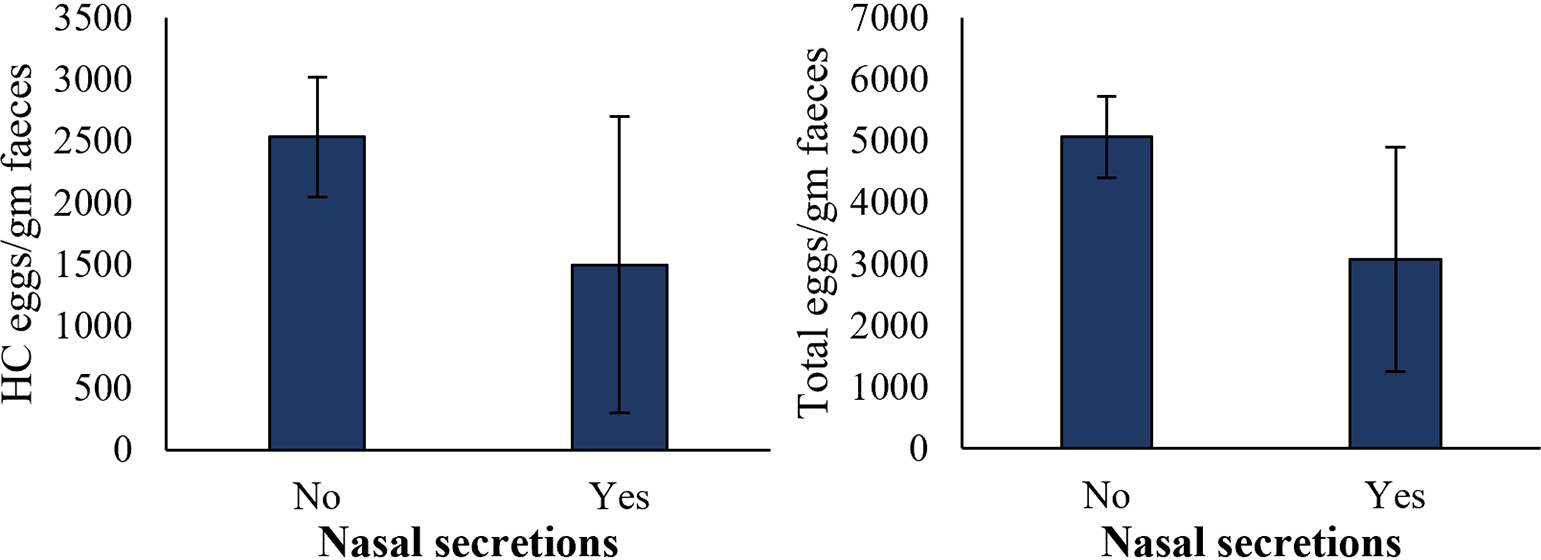
Figure 7. Determining HC eggs counts and total parasitic eggs counts in sheep’s faeces based on nasal secretions. Sample size for sheep with nasal secretions was 2, and 28 for sheep with no nasal secretions. Error bars indicate standard errors.
Genomic variants in the SOCS2 gene among the three sheep breeds
The sequencing results of the SOCS2 gene from the sheep categorized as high- and low-infection groups based on HC egg counts showed variation among the two categories. A total number of six genic variants were observed, of which three were SNPs, one was insertion, and two were deletions. Five of the total variants were in the intronic region, and one was in the 3′-UTR region. In Balkhi sheep, a total number of six variants were observed, of which four variants were commonly found in both high- and low-infection categories. The deletion c.485delTTT was found only in low-infection Balkhi sheep, while the deletion c.1083delGCA was found in the high-infection Balkhi sheep. Two intronic SNPs in Balkhi were in the homozygous form in low-infection sheep, while heterozygous in high-infection Balkhi sheep (Table 2).
Table 2. Genomic variants among different categories of sheep within each breed
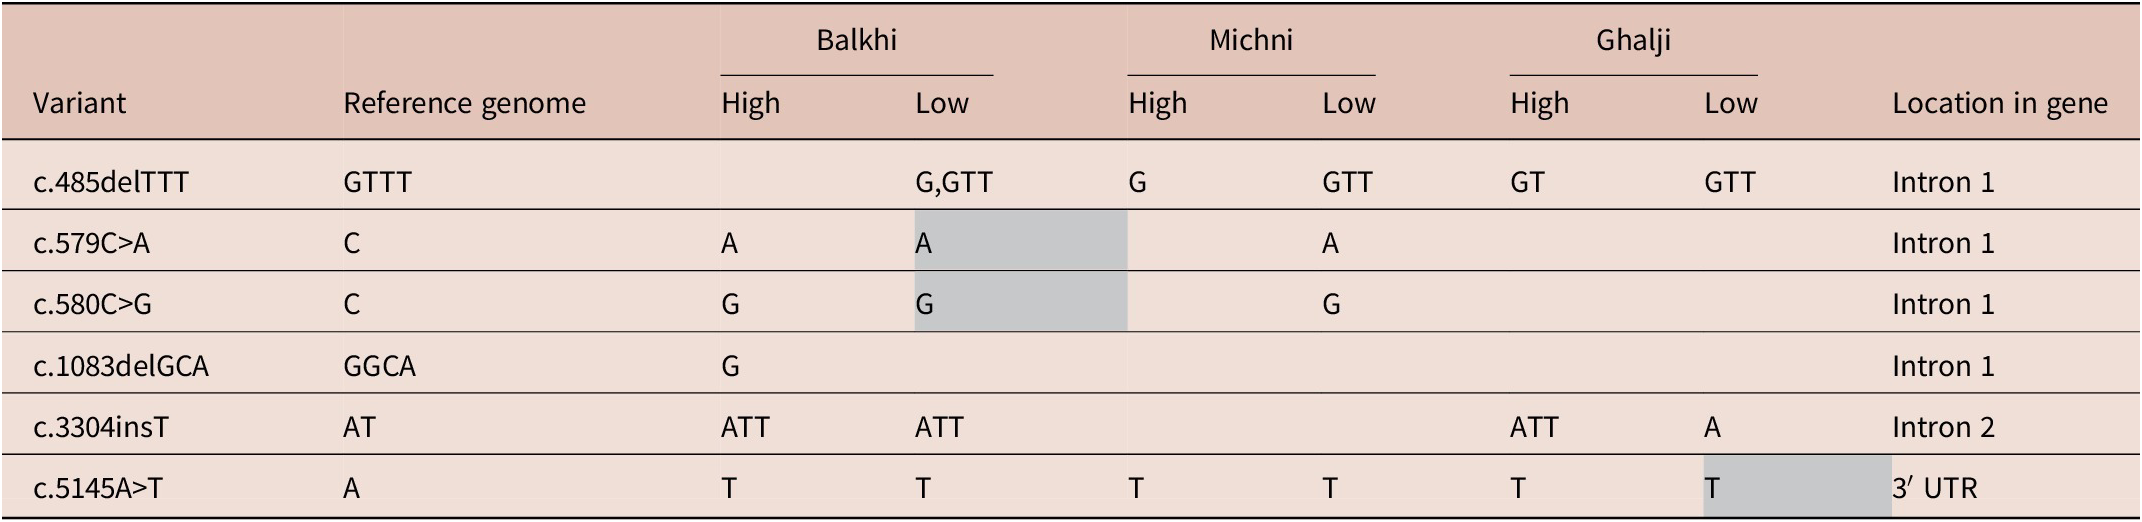
Grey boxes indicate homozygous variants.
A total of four variants were observed in Michni sheep. Two of the SNPs (c.579C>A and c.580C>G) were observed only in low-infection Michni sheep. Ghalji sheep showed variants at three loci in the SOCS2 gene. Variations were observed among high- and low-infection Ghalji sheep in the number of nucleotides at two intronic loci (c.485delTTT and c.3304insT) and in the heterozygosity status of the 3′-UTR variant (Table 2).
Genetic diversity in SOCS2 gene among infection groups
Genetic diversity parameters for the polymorphic loci found in the SOCS2 gene are presented in Table 3. Among the six loci, the highest numbers of alleles (4) were observed at locus 139298908 in the intronic region. Other mutations showed less polymorphism among the breeds. Observed heterozygosity was higher for two loci and was relatively lower (0.16) for locus 139299506. Mutation at this locus was observed only in Balkhi sheep. The average expected heterozygosity was lower than the observed heterozygosity. The mean observed number of alleles was 2.50 overall loci, which was higher than the mean effective number of alleles (1.92). Allele frequencies at different loci varied among the high- and low-infection categories of the sheep (Table 3). The reference alleles at positions 13929002 and 13929003 were more frequent in the high-infection group compared to the low-infection group. The frequency of the alternate allele at position 139303568 was higher in the low-infection group compared to the high-infection group.
Table 3. Genetic diversity and allele frequencies at different nucleotide positions among high- and low-infection groups
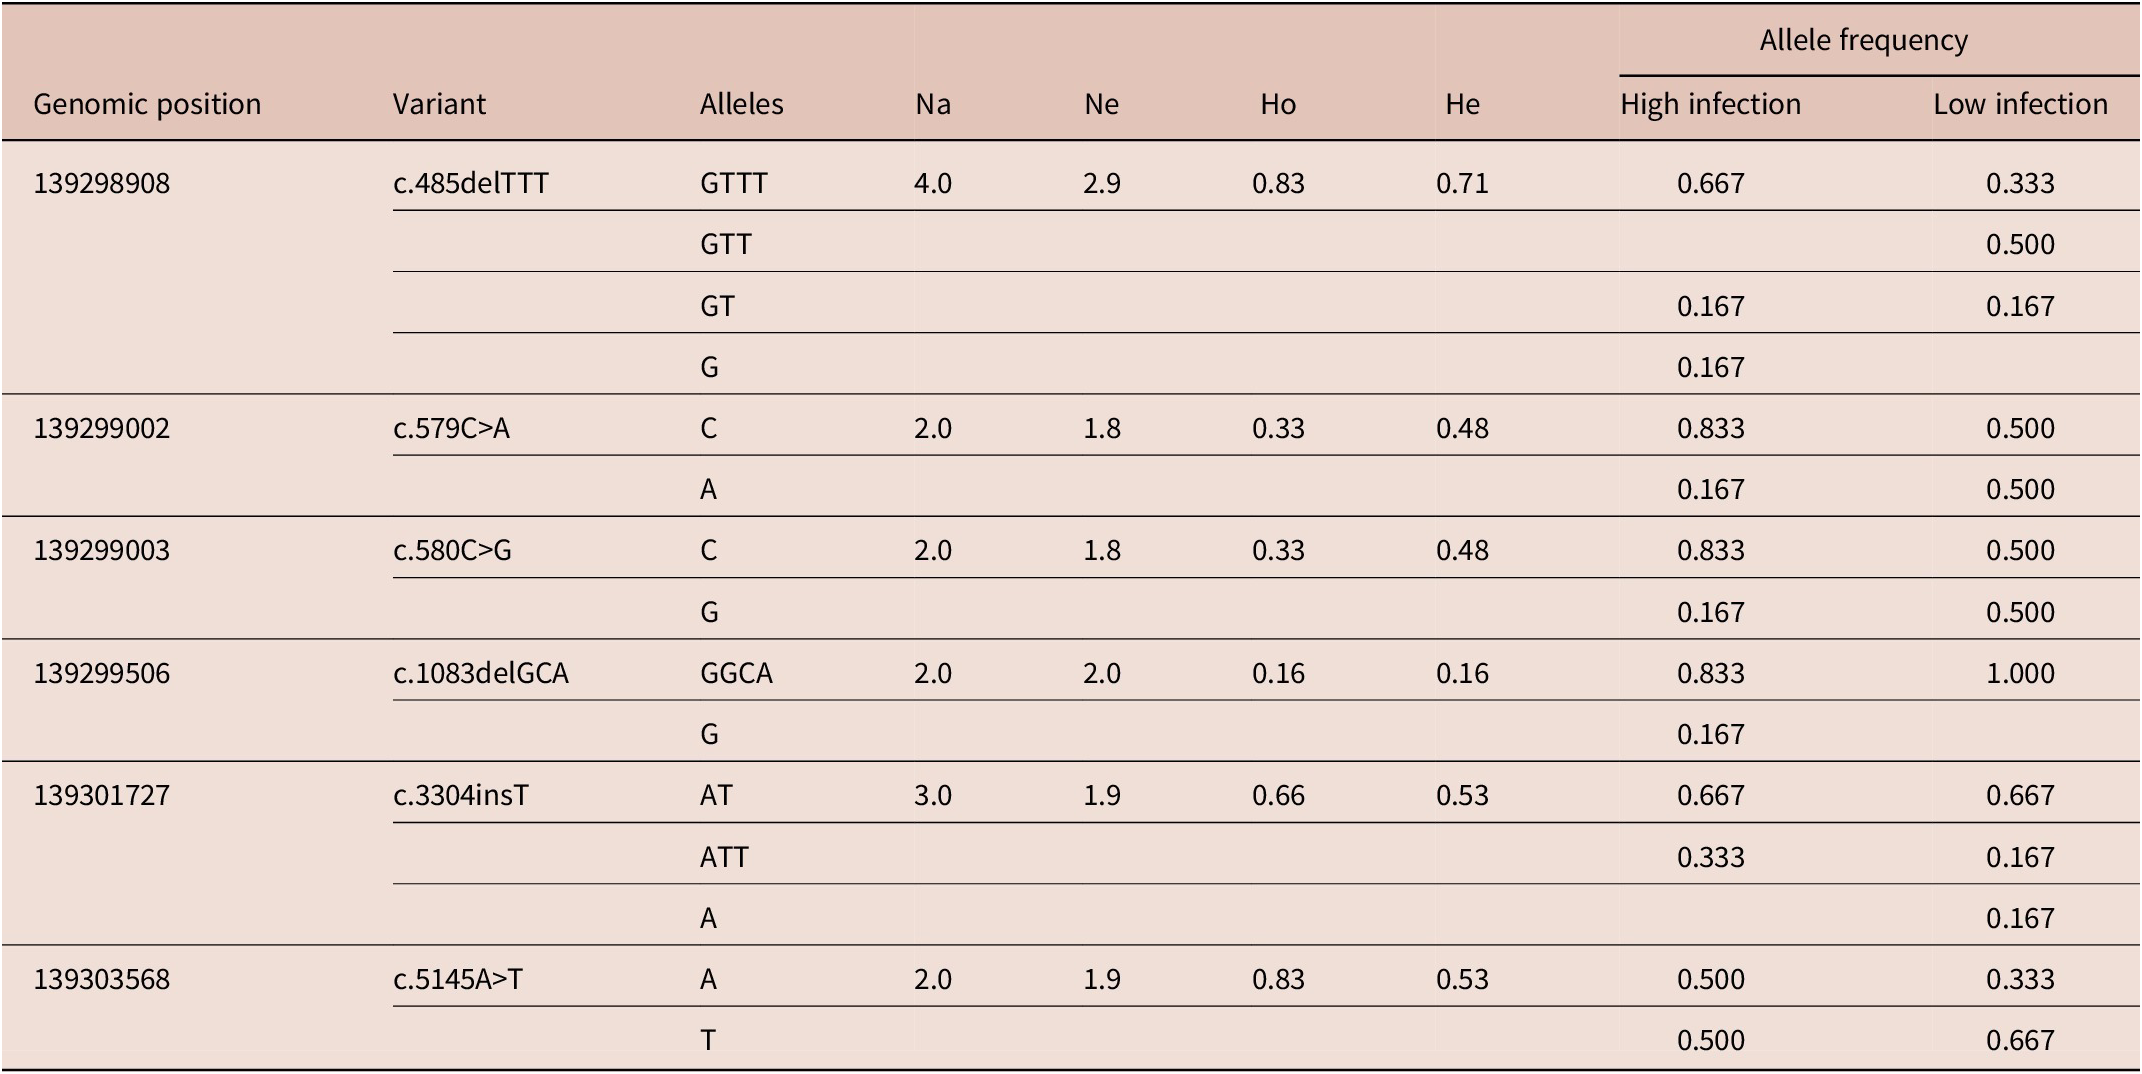
Key: Na = observed number of alleles, Ne = effective number of alleles, Ho = observed heterozygosity, He = effective heterozygosity.
Shared and unique genotypes among the infection categories
Genotypes were assigned for each of the identified variants in the SOCS2 gene. Table 4 shows the shared and unique genotypes among high- and low-infection categories of the three sheep breeds. The results showed a higher number of shared genotypes among Balkhi and Michni sheep breeds, while Ghalji sheep shared comparatively less genotypes with the other two sheep breeds. No genotype in low-infection Ghalji sheep was shared with any of the high-infection categories. Low-infection Michni sheep and highly infected Balkhi sheep shared the highest number of genotypes.
Table 4. Shared and unique genotypes among high- and low-infection categories of the three breeds
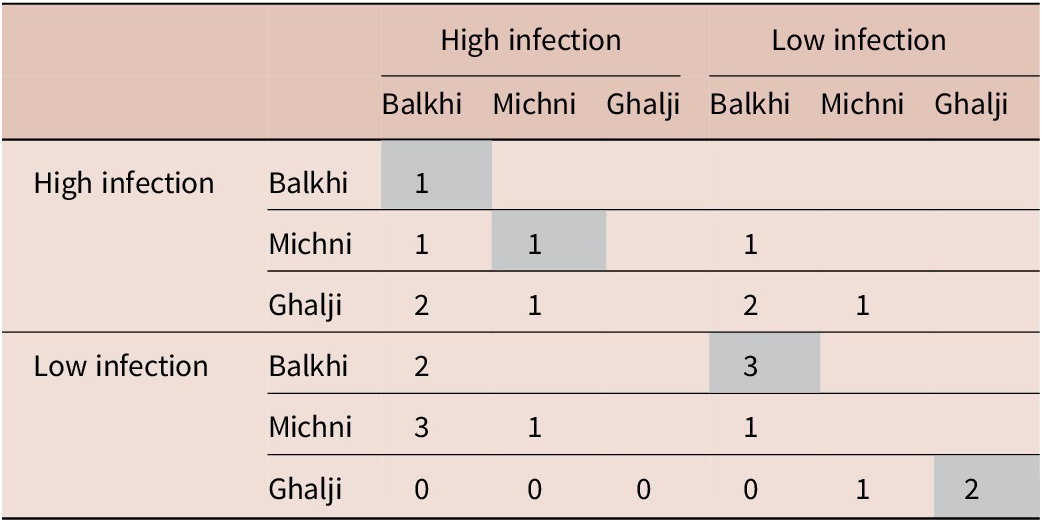
Grey cells indicate unique genotypes.
A total number of seven unique genotypes were also observed, five of which were in the low-infection categories (three in Balkhi and two in Ghalji). One unique genotype was observed in the high-infection Balkhi sheep. Another unique genotype was observed in the high-infection category of Michni sheep. Ewens-Watterson test for neutrality (Figure 8) showed that all the mutant loci were neutral for selection, suggesting no selection pressure contributed to the mutations.
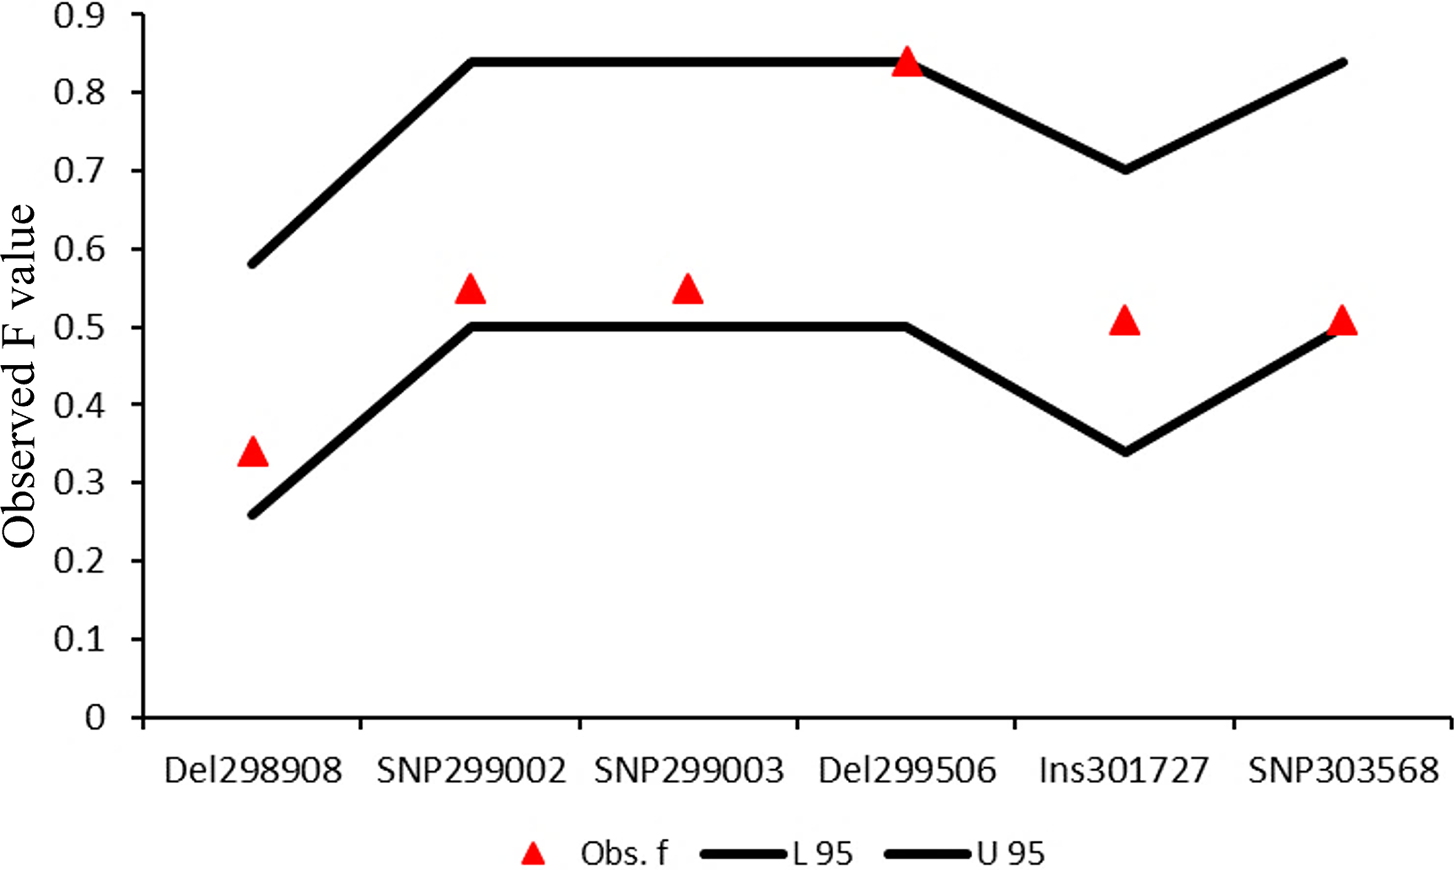
Figure 8. Ewens-Watterson test for neutrality of the identified genetic variations. The observed F values of all the loci fall within the 95% confidence interval lines, suggesting neutrality of these mutations for selection.
Population differentiation among high- and low-infection sheep based on SOCS2 gene polymorphism
Genetic differentiation based on SOCS2 gene polymorphism among high- and low-infection sheep was evaluated using POPGENE software. The results showed that two out of six loci had higher Fst values (0.71 each) in Balkhi, while another two loci showed higher differentiation (FST = 0.71) among high- and low-infection Michni sheep. Relatively lower FST values were recorded among high- and low-infection Ghalji sheep specimens. A higher mean FST (0.39) was recorded among the two groups of Michni followed by Balkhi (0.35), and the lowest mean FST (0.23) was recorded among high- and low-infection Ghalji sheep.
Association of mutations with HC infection
The results of the principal component analysis showed potential SOCS2 variants associated with HC egg count and total EPG (Figure 9). As seen in the principal component plot, the deletion c.1083delGCA, which was unique to high-infection Balkhi sheep, showed the highest correlation with HC egg count (0.833) and total egg counts (0.837). These results suggest that the high-infection Balkhi sheep may be susceptible to HC infection because of this particular deletion in the intronic region. Similarly, the insertion c.3304insT also showed a high positive correlation (0.889) with HC egg counts (Figure 9B). The ATT genotype at this locus was more frequent in the high-infection sheep compared to the low-infection sheep. The HC egg count in sheep with the ATT genotype of c.3304insT was also higher compared to the other genotypes (Figure 9C). The two SNPs (c.579C>A and c.580C>G) in the intronic region of the SOCS2 gene of Balkhi and Michni sheep and the 3′ UTR (c.5145A>T) showed a negative correlation with HC egg counts and total EPG (Figure 9). The homozygous form of these SNPs was prevalent in the low-infection sheep, while in the high-infection sheep, these were in heterozygous state.
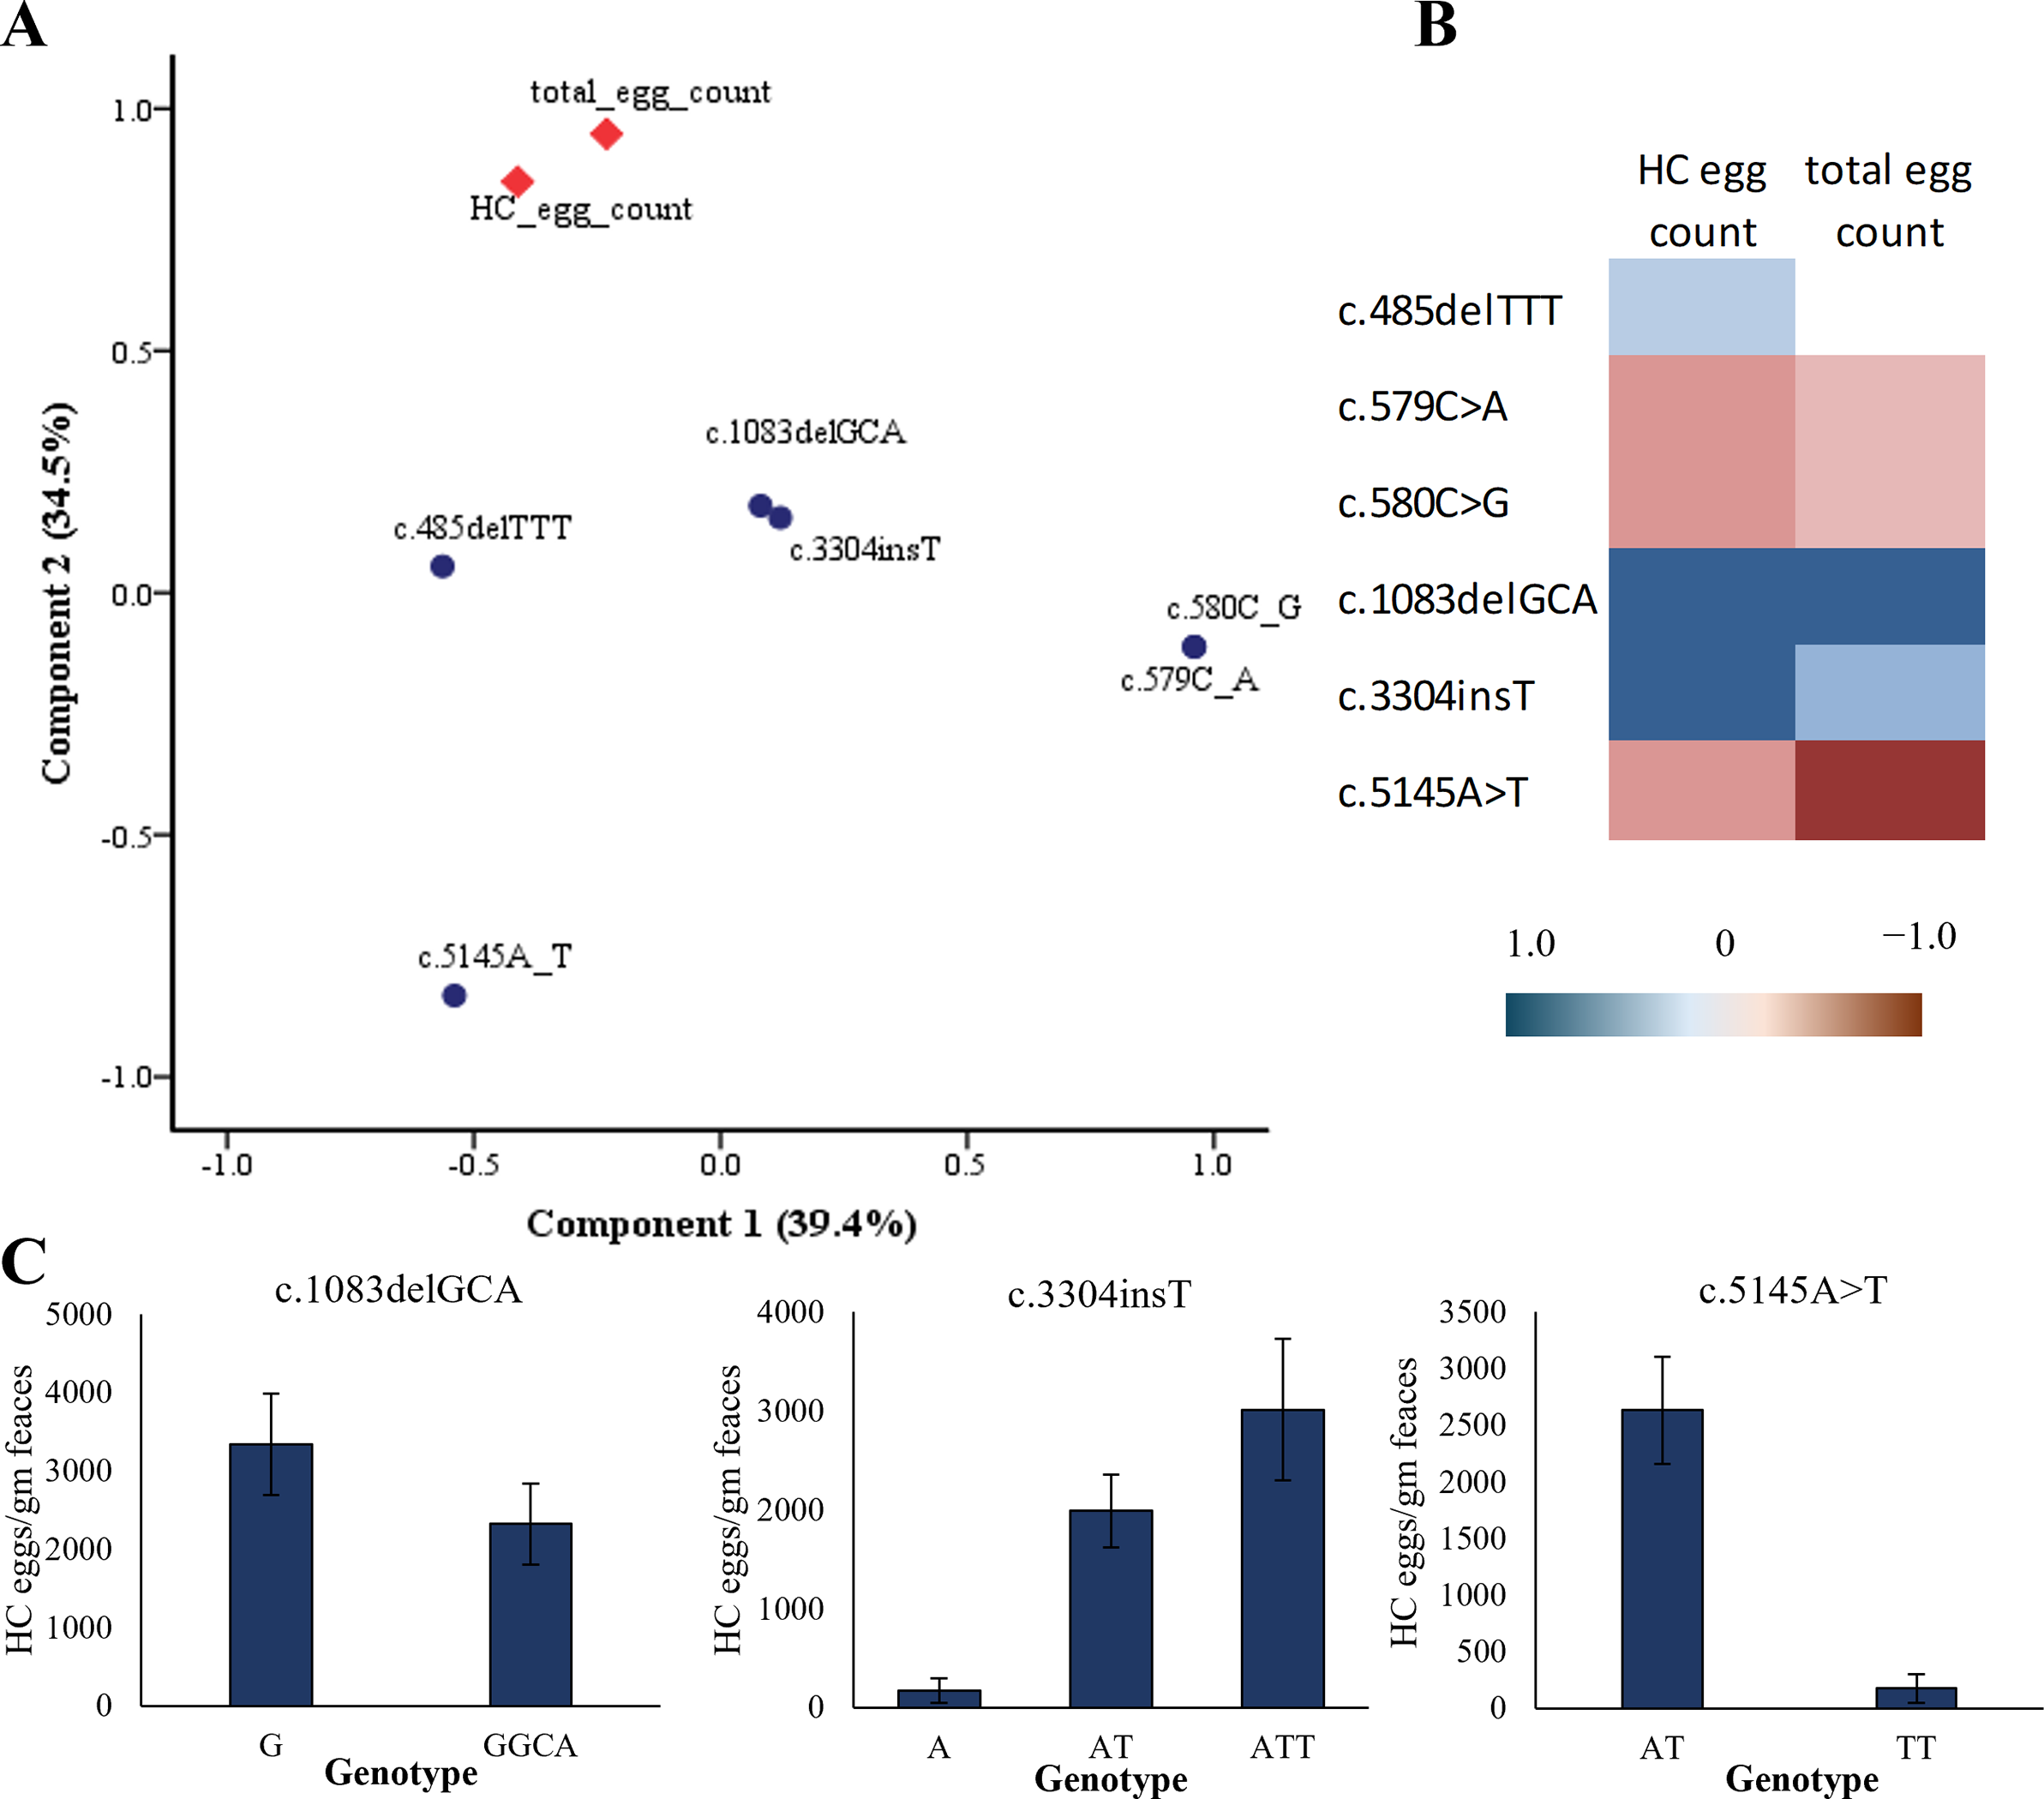
Figure 9. SOCS2 gene variants association with HC egg counts in sheep. (A) Principal Component Analysis plot showing grouping of faecal egg counts and gene variants. (B) correlation matrix among SOCS2 gene variants and faecal egg counts. (C) Mean and standard errors of HC egg counts in the faecal samples of sheep having different genotypes at associated loci.
Discussion
Variations were observed in the HC egg counts among the three sheep breeds in the current study. Breed effect on parasitic infection in sheep has been previously recognized (Alba-Hurtado and Muñoz-Guzmán Reference Alba-Hurtado and Muñoz-Guzmán2013). The highest eggs per gram faeces were observed in Ghalji (5861) and Michni (5163) in this study. These results are in accordance with the previous studies in which 6248, 5325 EPG has been reported in the Suffolk sheep breed (Alba-Hurtado et al. Reference Alba-Hurtado, Romero-Escobedo, Muñoz-Guzmán, Torres-Hernández and Becerril-Pérez2010) and Florida Native sheep breed (Zajac et al. Reference Zajac, Krakowka, Herd and McClure1990), respectively. A lower parasitic infection (3479 eggs per gram) has been reported in other sheep breeds (Saint Croix) compared to the results in the current study (Gamble and Zajac Reference Gamble and Zajac1992). In contrast, higher parasitic infection (FEC: 8,486 and FEC: 12,564) has been reported in Red Masai and Dorper sheep breeds (Alba-Hurtado and Muñoz-Guzmán Reference Alba-Hurtado and Muñoz-Guzmán2013).
The lowest number of total parasitic eggs per gram faeces (3850) in the current study was observed in Balkhi sheep. Similar to this breed, in previous studies, 3479 eggs per gram faeces have been reported in the Saint Croix sheep breed of the U.S. Virgin Islands (Gamble and Zajac Reference Gamble and Zajac1992). Studies reported Red Masai sheep breed showing lower packed cell volume (20.5 PCV) was resistant to HC, while the Dorper sheep breed showing higher PCV (25.5) was susceptible to HC infection (Mugambi et al. Reference Mugambi, Audho and Baker2005). Previous studies have also reported that FEC was used as a parasitological parameter for diagnosis purposes (Crawford et al. Reference Crawford, Paterson, Dodds, Tascon, Williamson, Thomson, Bisset, Beattie, Greer and Green2006). In the current study, based on the number of HC eggs in the faecal samples, Ghalji sheep were among the high-infection group compared to Michni and Balkhi sheep breeds.
The total EPG and HC egg counts were further associated with the difference in the mucosa colour of the sheep in the current study. The highest number of HC eggs was recorded in the faecal samples of sheep with pale mucosa colour. These results are in accordance with a study in which the validation of FAMACHA eye colour chart has been performed for detecting anaemia in goats and sheep due to parasitic infection (Kaplan et al. Reference Kaplan, Burke, Terrill, Miller, Getz, Mobini, Valencia, Williams, Williamson and Larsen2004). Highly significant (P< 0.001) correlations between PCV and eye scores, PCV and FEC, and FEC and eye scores for both sheep and goats have been observed in previous studies. PCV values of ≤19 or ≤15 and eye score values of 3, 4, and 5 or 4 and 5 have been considered anaemic based on data from FAMACHA scores and PCV (Kaplan et al. Reference Kaplan, Burke, Terrill, Miller, Getz, Mobini, Valencia, Williams, Williamson and Larsen2004).
Variation in the SOCS2 gene was found to be correlated with the HC egg counts and total EPG in the faecal samples of sheep in this study. These results suggest that genetic variability may be responsible for the susceptibility of the sheep against HC infection. In a previous study, loci with divergent allelic frequencies in a candidate gene panel of 100 genes were identified in three sheep breeds exposed to HC infection (Estrada-Reyes, Tsukahara, Amadeu et al. Reference Estrada-Reyes, Tsukahara, Amadeu, Goetsch, Gipson, Sahlu, Puchala, Wang, Hart and Mateescu2019). Population differentiation in the current study, among the three sheep breeds, was calculated, and the highest mean FST was recorded for the Michni sheep breed. FST outliers have been estimated in a previous study using two approaches (frequency and Bayesian) in three sheep breeds exposed to HC (Estrada-Reyes, Tsukahara, Amadeu et al. Reference Estrada-Reyes, Tsukahara, Amadeu, Goetsch, Gipson, Sahlu, Puchala, Wang, Hart and Mateescu2019). Previously, resistance of sheep breeds against HC has been studied. A total of 13 SNPs within seven genes (one being the SOCS2 gene) of their candidate gene panel were identified as related to HC exposure, and their study concluded that resistance to HC is likely to be controlled by many loci (Estrada-Reyes, Tsukahara, Goetsch et al. Reference Estrada-Reyes, Tsukahara, Goetsch, Gipson, Sahlu, Puchala and Mateescu2019). Results from this study demonstrate that within breed, high- and-low infection categories showed genetic variations, suggesting the low-infection categories possess significant loci associated with HC resistance.
Variations in the exon 2 and 3′ UTR regions of the SOCS2 gene have previously been identified in resistant (Katahdin) vs. susceptible (Dorper) sheep (Estrada-Reyes, Tsukahara, Amadeu et al. Reference Estrada-Reyes, Tsukahara, Amadeu, Goetsch, Gipson, Sahlu, Puchala, Wang, Hart and Mateescu2019). Similarly, in the current study, a variant in the 3′ UTR regions of the SOCS2 gene was found to be associated with HC susceptibility. The other associated variants found in the intronic regions of the SOCS2 genes in the current study have not been reported in previous studies. Variations at different loci in other genes have also been associated with average daily weight gain, antibody levels, and faecal egg count of different sheep breeds to identify the potential markers responsible for immune response traits against HC (Estrada-Reyes, Tsukahara, Goetsch et al. Reference Estrada-Reyes, Tsukahara, Goetsch, Gipson, Sahlu, Puchala and Mateescu2019).
Conclusions
Genetic background largely affects susceptibility to HC infection, as two sheep breeds Ghalji and Michni were found to be highly infected, while Balkhi was not despite sharing the same environment. HC infection also affects the overall body conditions and mucosal colour of the infected sheep. Resistance to HC based on SOCS2 polymorphism was mostly breed-dependent. Polymorphisms in the SOCS2 gene were observed among low-infection and high-infection sheep categories. Deletions, insertion, and SNPs at different loci of the SOCS2 genes could be correlated with HC susceptibility in sheep. Polymorphisms in the SOCS2 gene may further be analyzed to find the variations in the immune responses of sheep against other endoparasites.
Financial support
The financial support for this study was provided by the NRPU program of HEC under project No. 6306/KPK/NRPU//R&D/HEC/2016.
Competing interest
The authors declare there are no competing interests.


 Open access