

INTRODUCTION
Top scientists and business people such as Stephen Hawking and Bill Gates have warned of mass unemployment due to the rise of Smart Technology, Artificial Intelligence, Robotics, and Algorithms, which we term STARA (Bort, Reference Bort2014; Lynch, Reference Lorentziadis2015). It is estimated that one-third of jobs that exist today could be taken by STARA by 2025 (Frey & Osborne, Reference Feng and Graetz2013; Thibodeau, Reference Thibodeau2014). This is due to significant improvements in robotic dexterity and intelligence, coupled with inexpensive autonomous units that have the potential to outperform humans at many manual and conceptual tasks (Frey & Osborne, Reference Feng and Graetz2013).
Examples of these types of technology can be seen with the popularisation of retail self-checkouts, smartphone applications, automation in accounting, the internet of things, and future developments in driverless vehicles. The cost–benefit or payback on these types of technology makes it difficult to consider the continuation of human employees in some roles. For example, a supermarket self-checkout system costs $125,000 (this cost is expected to fall and vary from country to country) for four lanes (Human-Use Experience, Reference Haar, Russo, Suñe and Ollier-Malaterre2015). Depending on the country, this is generally lower than or equal to paying four minimum wage employees for an average 40-hr week for a year. Considering the self-checkout system can work 24 hr per day, 7 days a week, and the employer does not have to pay taxes, pensions, health benefits, other benefits, or give breaks to the self-checkout, it is clear which option is more economically viable for the retailer. The same will be applied to driverless vehicles once the technology is refined.
Interestingly, STARA is not being implemented into just low-paid, low-skilled positions. Sophisticated algorithms are being used in legal research: for example, the Clearwell system was programmed to analyse and sort 570,000 documents in 2 days (Frey & Osborne, Reference Feng and Graetz2013), a job that would have normally been conducted by lawyers and paralegals. In addition, report-writing algorithms within business and news media will become more common. Furthermore, the costs of robots with high-precision dexterity are falling significantly (Frey & Osborne, Reference Feng and Graetz2013).
A study of 702 occupations detailed the probability of computerisation (i.e., STARA) taking jobs. For example, jobs at risk include accountants, market research analysts, commercial pilots, customer service, sales staff, and office/administration workers, etc. (Frey & Osborne, Reference Feng and Graetz2013). STARA could also have a significant effect on medical (Bloss, Reference Bloss2011; Lorentziadis, Reference Krumboltz2014), education (e.g., with online mass learning), transportation, farming, forestry, and fishing industries. Overall, this seminal research suggested that 47% of jobs are at risk of being taken by STARA (Frey & Osborne, Reference Feng and Graetz2013). Many of these jobs are not low-skilled positions, but high-paying middle-class jobs, and many of these jobs are in the service sector. This comes at a time where income inequality is on the rise (Goos & Manning, 2007; Goos, Manning, & Salomons, Reference Goos and Manning2009; David & Dorn, Reference David and Dorn2013). This is a significant problem given ‘household wealth in New Zealand was concentrated in the top 20 percent of New Zealand households, which held about 70 percent of total household net worth’ (Statistics New Zealand, Reference Spohrer and Maglio2016: 1). This report shows the widening divide between the ‘Haves and the Have Nots’ (McCammon, Reference Maslach and Jackson2016).
If the profession does not fall into the high-risk category it can still be disturbed by STARA within other industries. For example, the need for driving instructors and licence testing officers could be made redundant with driverless cars, as well as insurance assessors, panel beaters, etc. (since driverless cars have the potential to lower crash rates). In addition, it has been proposed that personal motor vehicles will be able to drive through the night while people sleep, putting strain on the accommodation and airline industries (Zaldivar, Reference Zaldivar2015). The Economist (2014) warns that new technologies may take jobs that will not be replaced. Based on these potential workplace changes, the main purpose of this research is to (1) develop a measure that captures STARA awareness; (2) test STARA awareness to determine whether employees perceive it as a threat to their job/career; and (3) determine what effect (if any) STARA has on a range of job and well-being outcomes of current employees. We draw on the career planning literature in relation to STARA perceptions.
Literature Review
Industrial revolutions: history repeating?
Significant changes to the workplace have been seen before, and are considered to be the norm. Broadly speaking, the primary (farming/mining) sector and secondary (manufacturing) sector have shrunk dramatically in many developed nations (Dennis, Reference Dennis1978; Charles, Hurst, & Notowidigdo, Reference Charles, Hurst and Notowidigdo2013). Typically, in these economies, many of the displaced employees transitioned into the tertiary (service) sector over time as new jobs were created (Spohrer & Maglio, Reference Spell and Arnold2008). Mechanisation of textiles, steam power, improvements in transportation, production lines, specialisation of labour, electricity, greater communication, and many other factors have driven these revolutions (Jensen, Reference Inkson1993). Electrification within manufacturing was a key driver in ‘hollowing out’ the skills distribution (Gray, Reference Gould2013). Gray (Reference Gould2013) suggested that when low-skilled jobs were lost in this way the demand for clerical and management staff jobs was created. However, this might not be the case with our next revolution. The increase of efficiency from technology like STARA creates a situation where middle-class jobs are disappearing from the market (Feng & Graetz, 2015). The incentive to replace employees within the service sector is the greatest, as the wages of middle-class professions often account for a large amount of the overheads within a given business. What is more concerning is that affected workers within the service sector may not have a ‘fourth’ industry sector or range of new jobs to transition into immediately. The effect of STARA in the service sector will be like a new industrial revolution and will take decades to play out (Brynjolfsson & McAfee, Reference Brynjolfsson and McAfee2011).
The effect of technology has created skill and wage polarisations within the labour force since the 1950s (Mishel, Schmitt, & Shierholz, Reference Mirvis and Hall2013). David and Dorn stated that ‘polarization stems from the interaction between consumer preferences, which favor variety over specialization, and the falling cost of automating routine, codifiable job tasks’ (Reference David and Dorn2013: 1553). The present study works from the assumption that we are on the cusp of a new revolution within the service sector as a result of STARA. It works on the assumption that large numbers of employees could be displaced as a result of STARA relatively soon as per Frey and Osborne (Reference Feng and Graetz2013). It is not known if more and different jobs will be created as a result, or the middle- and low-skilled workers will be worse off as a result. However, at this point, experts such as Stephen Hawking have pronounced ‘warnings’ that at the moment robots are taking human jobs and are moving society towards more inequality (Rathi, Reference Prenda and Lachman2015). Regardless of what the future holds, the present study suggests that there is little empirical research regarding the level of employee awareness of these potential changes. Consequently, there is little known about whether employees are planning new career paths factoring in the potential for STARA. As such, we now discuss career planning and formulate our hypotheses.
Career planning and STARA
STARA awareness captures the extent to which an employee views the likelihood of Smart Technology, Artificial Intelligence, Robotics and Algorithms impacting on their future career prospects. This approach, developed for this study, is positioned within the career-planning literature with Greenhaus and Kopelman (Reference Gray1981), suggesting that career planning has several key and sequential parts. These parts are based on the information surrounding: (1) one’s interests, values, and talents, (2) the workplace opportunities, and (3) work–family/leisure interests. The individual may also have their own goals and strategies to achieve their desired career outcomes. Overall, career planning ‘refers to individuals’ outlining future career developments and to their setting and pursuing career goals’ (Zikic & Klehe, Reference Zikic and Klehe2006: 393). It is important to note that career planning is an ongoing process that is assessed and carried out over one’s lifetime. Early career-planning research by Gould (Reference Goos, Manning and Salomons1979) suggested that employees with higher levels of career planning had more effective careers.
The impact from STARA is also likely to increase the prominence of the boundaryless career. Boundaryless careers are seen and defined as ‘the opposite of “organizational careers” – careers conceived to unfold in a single employment setting’ (Arthur & Rousseau, Reference Arthur and Rousseau2001: 5). They are particularly relevant and prominent when organisations and employees are trying to ‘adapt to the modern economic era’ (Arthur, Reference Arthur1994: 296), due to cost pressures and disruptive technology. Inkson summarised what is happening to careers by stating that ‘the old picture of stable employment and associated organizational careers is fading’ (2006: 297). The way we view careers needs to be dynamic, ever changing, and unexpected. However, we could see these changes to careers as opportunities that could be capitalised on (Krumboltz, Reference Kelloway, Gottlieb and Barham2009).
Given that STARA is likely to change employment in a profound way, it is expected that the very nature of career planning is at a pivotal time. For example, if we take the future predictions from Frey and Osborne (Reference Feng and Graetz2013) and look at them based on the traditional model of career planning (Greenhaus & Kopelman, Reference Gray1981; i.e., assessing values, talents, workplace opportunities, and work–family/leisure interests), there is a large disconnect. This is important because Baruch discussed the rate of change with technology, and how these changes ‘have wide implications for the management of people at work, and in particular the planning and managing of careers’ (Reference Baruch2004: 58).
If the predictions of Frey and Osborne (Reference Feng and Graetz2013) are even partly correct, workplace opportunities could be reduced significantly, making it harder to plan one’s career. This in part makes an employee’s values and talents, as well as work–family/leisure interests, irrelevant to the career-planning process. For example, an employee with a personal love of vehicles and a talent for driving long periods can still be replaced by driverless vehicles. Within the career-planning process, we consider STARA awareness to be an extension or a part of how an employee considers their future career prospects within their current job, workplace and industry. We now develop our hypotheses.
STARA and job outcomes
The career-planning model put forward by Aryee and Debrah (Reference Aryee and Debrah1993) highlighted the effect that career planning has on other aspects of work. For example, successful career planning leads to a strategy being formed to meet one’s goals, which in turn affects career satisfaction. Career satisfaction then promotes self-esteem at work and overall commitment to one’s career (Aryee & Debrah, Reference Aryee and Debrah1993). The following section highlights how STARA could affect a range of job outcomes (i.e., organisational commitment, career satisfaction, and turnover intentions).
Chen, Chang, and Yeh (Reference Chen, Chang and Yeh2004) focussed on the effects of career-development programmes and career needs within research and development firms. Overall, they found that when there was a gap between career-development programmes and career needs, the employees’ job attitudes were affected, for example, by having higher turnover intentions. Employees need to feel that their employer is providing them with adequate training, support, and other developmental programmes that enable them to move forward with their careers. Although Chen, Chang, and Yeh (Reference Chen, Chang and Yeh2004) did not measure this empirically, they also suggested that bridging the gap between career-development programmes and career needs could also affect productivity and organisational commitment. Indeed, career planning is linked to important job attitudes (Steffy & Jones, 1988).
We expect STARA awareness to have a similar detrimental influence on the key job outcomes of organisational commitment, career satisfaction, and turnover intentions, as STARA can threaten a person’s overall career development and make it more challenging to fulfil one’s needs. For example, working for an employer who actively explores and trials robotics to replace employees is likely to be perceived by an employee that they are undervalued and not regarded highly by their employer. This is likely to lead to lower organisational commitment and higher turnover intentions. In effect, it becomes harder for the employee to feel like they are ‘part of the family’ (Meyer, Allen, & Smith, Reference McCammon1993) if management is exploring ways to replace workers with STARA. It has also been found that commitment to one’s career can be negatively related to job withdrawal intentions (Aryee & Tan, Reference Aryee and Tan1992). With STARA potentially signalling that an employee’s job is in jeopardy, this could encourage the consideration of alternative employment.
Finally, amongst the job attitudes, the present study also focusses on career satisfaction. Aryee and Debrah found that a ‘career plan was related to the development and implementation of career strategy which in turn, was related to career satisfaction’ (Reference Aryee and Debrah1993: 120). They also suggested that this reinforced the idea that this individual had control over their external environment. We expect that STARA awareness will pose a threat to feelings of control – with the external environment potentially influencing an employee’s perceptions of attaining their career goals. This is likely to have a negative influence on career satisfaction. Based on the various findings in the career-planning literature, we suggest STARA awareness will be detrimental to job outcomes and posit the following.
Hypothesis 1: STARA awareness will be negatively associated with organisational commitment.
Hypothesis 2: STARA awareness will be negatively associated with career satisfaction.
Hypothesis 3: STARA awareness will be positively associated with turnover intentions.
STARA and well-being outcomes
We suggest that STARA awareness will not only influence job outcomes, but also well-being outcomes. The way an employee builds their identity with their career and measures their own career success can have an impact on psychological well-being (Mirvis & Hall, Reference Meyer, Allen and Smith1996; Wiese, Freund, & Baltes, Reference Wiese, Freund and Baltes2002). It is expected that when one’s future prospects are lessened, well-being will suffer. For example, job insecurity within the workplace can have a significant effect on employees’ mental health. Research from Dekker and Schaufeli (Reference Dekker and Schaufeli1995) focussed on an organisation during a time of significant organisational change, and they observed that job insecurity was a predictor of psychological health (i.e., psychological stress and burnout). Overall, Dekker and Schaufeli came to the conclusion that long-term uncertainty in a job was more detrimental than knowing whether one was going to be made redundant, stating that the ‘silence from above surely erodes the extent to which workers experience control over the future of their jobs’ (Reference Dekker and Schaufeli1995: 62).
It is clear that this uncertainty around the future of work and career could be harmful for some employees. Chen, Chang, and Yeh (Reference Chen, Chang and Yeh2004) suggested that when needs are unsatisfied within one’s career options there could be a development of nervousness and stress within a workplace. We expect STARA awareness to contribute to this development of nervousness and stress. However, at the opposite end of the scale, those who are blissfully unaware of the changes that are taking place may cope better than those who know their career prospects could be limited due to STARA. Mirvis and Hall stated that ‘One prominent way that working people have coped with disillusionment is by sliding into cynicism … in doing so they lower their expectations of commitments to an employer’ (Reference Meyer, Allen and Smith1996: 377). We thus explore two well-being outcomes: depression and cynicism. Depression has been thought of as ‘low pleasure and low arousal’ (Axtell et al., Reference Axtell, Wall, Stride, Pepper, Clegg, Gardner and Bolden2002: 222), while cynicism relates to ‘indifference or distant attitude of work, and having a callous and cynical attitude to work’ (Roche & Haar, Reference Pryor, Amundson and Bright2013: 519). We therefore argue that STARA awareness will leave an employee with lower levels of arousal and pleasure (e.g., ‘an inanimate object – a robot – may do my job better!’) and similarly lead to cynicism and indifference at work (e.g., ‘why bother with this job, once the robot is programmed I’ll be given the boot’). This leads to the next set of hypotheses.
Hypothesis 4: STARA awareness will be positively associated with depression.
Hypothesis 5: STARA awareness will be positively associated with cynicism.
Moderation effects
The present study also tests the moderation effects of age. Career planning is very important for high school students (Bardick, Bernes, Magnusson, & Witko, Reference Bardick, Bernes, Magnusson and Witko2007), and this process can even begin in early childhood (Magnuson & Starr, Reference Lynch2000). One’s age is an important factor to consider when focussing on careers (Morrow & McElroy, Reference Mishel, Schmitt and Shierholz1987). A study of future planning by Prenda and Lachman (Reference Podsakoff, MacKenzie, Lee and Podsakoff2001) found that people planned for the future less as they got older. Thus, the importance of career planning is much more salient for a 25 years old than for a 60 years old. Overall, the career-planning process is ongoing, and it is widely accepted that younger individuals, being at the start of their careers, plan more than older employees, who are at the end of their careers, and will likely stay in their current profession until retirement (Morrow & McElroy, Reference Mishel, Schmitt and Shierholz1987). We suggest that younger employees are more likely to be considering career planning and are more likely to be aware of potential future disruptions, such as STARA. In addition, it is expected that younger employees are more likely to be researching and considering their career options with more vigour as they enter the workforce.
A meta-analysis with age and career found that ‘the relationship between commitment and turnover (actual and intended) is stronger in the early career stage than in the mid and late-career stage’ (Cohen, Reference Cohen1991: 253). Furthermore, we suggest that younger employees are more likely to be savvy about technology and, relatedly, have a greater understanding of its potential. Chan-Olmsted, Rim, and Zerba (Reference Chan-Olmsted, Rim and Zerba2013) report that young people are more accepting of mobile technology, while Niehaves and Plattfaut (Reference Morrow and McElroy2014) confirm that technology use is higher amongst younger people. As such, we suggest that younger employees are more likely to be aware of technology and thus the potential for STARA to take their jobs. Hence, we hypothesise that younger employers will have higher STARA awareness than older employees and that age will moderate the influence of STARA awareness on outcomes, with a stronger and more detrimental influence being shown amongst younger employees. This leads to our last hypothesis.
Hypothesis 6: STARA awareness will be significantly higher amongst younger employees than older employees.
Hypothesis 7: Age will moderate the effects of STARA awareness on outcomes, with younger employees having more detrimental effects from STARA than older employees.
METHOD
Research context
The following research took place in New Zealand, which is a highly developed country both socially and economically, and is ranked as the seventh most highly developed country in the Human Development Index (Geohive, Reference Frey and Osborne2013). Like many developed Western nations, New Zealand has moved away from employing large numbers of people in agriculture and manufacturing, to employing large numbers of people in the service sector. This is reflected in the country’s gross domestic product (GDP), which shows steady declines in the primary and manufacturing industries from the 1970s onwards (Statistics New Zealand, Reference Spell and Arnold2012). There has been significant growth in the service sectors (i.e., retail, real estate, finance, insurance, scientific, and technical services) since the 1970s (Statistics New Zealand, Reference Spell and Arnold2012). The service sector currently accounts for 71% of GDP (The New Zealand Treasury, Reference Steffy and Jones2012).
Procedure
The present study used research assistants to distribute surveys. These research assistants used a combination of online and paper-based surveys (both surveys were identical) to collect the data. Purposeful sampling was undertaken to attract a broad range of employees within the service sector (Coyne, Reference Coyne1997). The service sector was targeted in this study because of its prominence within New Zealand, as within many other Western nations. Furthermore, it is expected that the effects of STARA will be felt greatest within the service sector. This is because the primary and secondary sectors have already seen the effects of automation, as well as the exportation of jobs offshore to countries with low-cost labour.
Over 200 organisations within New Zealand were approached, including private businesses. The purpose of the study and its requirements were explained to participants by the research assistants and a survey cover letter. Exact numbers of the number of surveys distributed were recorded by the research assistants. In total, 420 online and physical surveys were distributed, and 120 participants responded to the survey, the response rate for this study was 28.6%. Research on the differences between paper-based and online surveys showed there to be little difference between the overall mean scores and variance within the data (Deutskens, de Ruyter, & Wetzels, Reference Deutskens, de Ruyter and Wetzels2006). Ethics approval was granted by the first author’s University ethics office (Massey University).
Sample
On average, participants were 32.0 year old (SD=12.3 years), married or in a relationship (54.2%), female (69.2%), and had job tenure of 4.9 years (SD=5.8 years). On average, respondents worked 34.9 hr per week (SD=12.0 hr/week). Overall, education was well spread: 37.5% had a high school qualification, 20.8% had a technical college qualification, 26.7% had a university degree, and 7.5% had a postgraduate qualification. Due to a significant decline in union membership in New Zealand (Ryall & Blumenfeld, Reference Rathi2014), the majority of employees are working on individual rather than collective agreements. In our study, 89.2% of respondents were on individual employment agreements.
Like the majority of employees studied, all questions were asked in the same survey at the same time, thus creating potential for common-method variance. One test of common-method variance (Podsakoff, MacKenzie, Lee, & Podsakoff, Reference Östlund, Kidd, Wengström and Rowa-Dewar2003) is Harman’s One Factor Test and the factor analysis (unrotated) resulted in seven factors, with the largest factor accounting for less than 30% of the overall variance. This suggests that common-method variance is not an issue (Podsakoff & Organ, Reference Niehaves and Plattfaut1986).
Measures
Organisational Commitment was measured with a 6-item scale (Meyer, Allen, & Smith, Reference McCammon1993), coded 1=‘strongly disagree,’ to 5=‘strongly agree’. A sample item from this measure is ‘I do not feel “emotionally attached” to this organisation’. The present study found this measure to be robust (α=0.75). Career Satisfaction was measured using a 5-item scale (Greenhaus, Parasuraman, & Wormley, Reference Greenhaus and Kopelman1990), coded 1=‘strongly disagree,’ to 5=‘strongly agree’. The sample question was ‘I am satisfied with the success I have achieved in my career’ and ‘I am satisfied with the progress I have made toward meeting my overall career goals’. The present study found this measure to be robust (α=0.89). This is consistent with another study that used that measure within New Zealand (Haar & Brougham, Reference Greenhaus, Parasuraman and Wormley2013). Turnover Intentions were measured with a 4-item scale (Kelloway, Gottlieb, & Barham, Reference Jensen1999), coded 1=‘strongly disagree,’ to 5=‘strongly agree’. Sample items from this measure are ‘I am thinking about leaving my organisation’ and ‘I intend to ask people about new job opportunities’. The present study found this measure to have excellent reliability (α=0.94).
Depression was measured with three items from the Axtell et al. (Reference Axtell, Wall, Stride, Pepper, Clegg, Gardner and Bolden2002) scale. The question stem was presented: ‘Thinking of the past few weeks, how much of the time has your own job made you feel each of the following?’ and was followed by three adjectives: ‘Depressed’, ‘Gloomy’, and ‘Miserable’. The present study found this measure to be very robust (α=0.95). This is consistent with another study that used the short measure within New Zealand (Brougham & Haar, Reference Brougham and Haar2013), and the full measure has been validated internationally (Spell & Arnold, Reference Roche and Haar2007a, Reference Ryall and Blumenfeld2007b). Cynicism was measured with a 5-item scale (Maslach & Jackson, Reference Magnuson and Starr1981). A sample item is ‘I have become less interested in my work since I started this job’ and ‘I have become more cynical about whether my work contributes anything’. The present study found this measure to be robust (α=0.86).
STARA Awareness was measured using four items developed for this study, based on the job insecurity measure by Armstrong-Stassen (Reference Armstrong-Stassen2001). We initially defined STARA for respondents stating ‘Smart Technology, Automation, Robotics and Artificial Intelligence (STARA) are expected to change some workplaces and jobs within the next 10 years’. This was then followed by the question stem: ‘Thinking of your current job, please answer the following’. The items asked and analyses are shown in Table 1.
Table 1 Results of exploratory factor analysis for Smart Technology, Artificial Intelligence, Robotics, and Algorithms (STARA) awareness

Note. FL=factor loadings; ITC=corrected item-total correlations (item scores correlated with the sum of all other item scores).
To confirm the factor structure, we conducted factor analysis (principal components, varimax rotation) and the 4 items loaded onto a single factor with eigenvalues >1 (2.874) accounted for a sizeable amount of variance (71.9%) and achieved very good reliability (α =0.85).
Corrected item-total correlations were all >0.50, with a mean corrected item-total correlation of 0.62, and all factor loadings of all items were >0.50, ranging from 0.700 to 0.922. As these results are similar to the analysis by Allen regarding a new measure created, we argue that ‘the results provided support for the reliability of the measure and indicated that the items were measuring a single global construct’ (Reference Allen2001: 423).
The moderator Age was measured in years. Control variables included a range of typical demographic variables: gender (1=female, 0=male), education (1=high school, 2=technical qualification, 3=university degree, 4=postgraduate qualification), ethnicity (1=white, 0=nonwhite), organisational tenure (years), and hours worked (per week). Finally, Job Insecurity was measured with a 3-item scale by Armstrong-Stassen (Reference Armstrong-Stassen2001), coded 1=‘strongly disagree,’ to 5=‘strongly agree’. A sample item from this measure is ‘Are you personally worried about your job security?’. The present study found this measure to be robust (α=0.82). We control for job insecurity because traditional psychological contract theory is one where employees are provided with job security in return for hard work and performance (Virtanen, Kivimäki, Virtanen, Elovainio, & Vahtera, Reference Virtanen, Kivimäki, Virtanen, Elovainio and Vahtera2003). However, we expect those employees with a greater understanding of STARA to feel less secure about their jobs, as they can see the potential for their job being codified and automated. In this regard, there is no security for working hard. A designer or programmer may create a robot/algorithm to do what an employee does and then their job is simply replaced.
Analysis
We used hierarchical multiple-regression analysis (Cohen & Cohen, Reference Cohen and Cohen1983) to test the influence of STARA awareness on job and well-being outcomes. In total, five models were run, with control variables (gender, education, organisational tenure, hours worked, and job insecurity) entered in Step 1. Step 2 held the STARA awareness construct and Step 3 age (as the moderator). Step 4 held the interaction between STARA awareness and age. The centring procedure (Aiken & West, Reference Aiken and West1991) was followed where all interacting variables were z-scored.
Open-ended question
The present study also used an open-ended question to capture participants’ comments regarding STARA awareness, how it affects their current job and also how it might impact on their future career prospects. Mixed-method research is growing in popularity, and enables the best aspects of both quantitative and qualitative research (Creswell & Plano Clark, Reference Creswell and Plano Clark2007; Östlund, Kidd, Wengström, & Rowa-Dewar, 2011). Of the 120 participants, 67 participated in this open-ended question (53 left it blank). A thematic analysis (i.e., both authors independently and then together coded responses) generated three broad thematic categories: (1) No threat (participants do not envisage STARA affecting their current job or career), (2) Potential threat (participants can envisage STARA playing a role in their future job or career), and (3) The threat is real (participants are aware of STARA being used within their current job and/or being deployed in the very near future).
RESULTS
Descriptive statistics for all the study variables are shown in Table 2.
Table 2 Correlations and means of study one and study two variables

Note. N=120.
STARA=Smart Technology, Artificial Intelligence, Robotics, and Algorithms.
*p<.05, **p<.01.
Table 2 shows that STARA awareness is low, with a mean score of 1.7 (SD=0.77) and a mid-point of 3. As such, the overall perception of technology replacing employees’ jobs appears low. That said, as expected STARA awareness is significantly correlated with outcomes in the expected direction: organisational commitment (r=−0.29, p<.01), career satisfaction (r=−0.32, p<.01), turnover intentions (r=0.29, p<.01), depression (r=0.25, p<.01), and cynicism (r=0.33, p<.01). STARA awareness is also significantly correlated with age (r=−0.29, p<.01).
We confirmed this by recoding age into three categories (1, ≤30 years; 2, 31–50 years; and 3, ≥51 years) and conducting an analysis of variance test in order to compare the age groups for significant differences (Haar, Russo, Suñe, & Ollier-Malaterre, Reference Haar and Brougham2014), using the recommended post hoc analysis tests of Fisher least significant difference and Student–Newman–Keuls. We found significant differences across the age groups (F=6.022, p<.01), with ad hoc analysis showing the youngest group (30 years and under) had significantly higher STARA awareness (M=1.9) compared with both other groups (both p<.05); the oldest group (over 50 years) with M=1.2, and the middle group (31–50 years) at M=1.6. Overall, this provides support for Hypothesis 6 that younger respondents would have higher STARA awareness.
The results of the moderated regression analysis for the study hypotheses are shown in Table 3.
Table 3 Moderated regression models for outcomes

Note. Standardized regression coefficients, all significance tests were two-tailed.
STARA=Smart Technology, Artificial Intelligence, Robotics, and Algorithms.
† p<.1, *p<.05, **p<.01, ***p<.001.
Direct effects
Table 3 shows that the outcomes and Hypotheses 1–5 were all supported, with STARA awareness being significantly related to organisational commitment (β=−0.21, p<.05), career satisfaction (β=−0.37, p<.001), turnover intentions (β=0.30, p<.01), depression (β=0.25, p<.05), and cynicism (β=0.34, p<.001). From Step 2 we can see that STARA awareness accounts for a small amount of variance regarding organisational commitment (4%, p<.05), more modest amounts regarding depression (6%, p<.05) and turnover intentions (9%, p<.01), and a larger amount still for cynicism (12%, p<.001) and career satisfaction (13%, p<.001). Amongst the control variables, hours worked is consistently beneficial towards all job outcomes: organisational commitment (β=0.29, p<.01), career satisfaction (β=0.31, p<.01), and turnover intentions (β=−.23, p<.05). The other significant control variable is job insecurity, which was significantly related to career satisfaction (β=−0.25, p<.05), depression (β=0.19, p<.1), and cynicism (β=0.21, p<.05). Overall, the control variables block accounted for sizeable variance, ranging from 9% (nonsignificant) to 21% (p<.01) across all models.
Moderation effects
We tested age as a moderator of STARA awareness and three significant interactions were found on the job outcomes (there was no significant interaction on well-being outcomes). The significant interaction effects were on organisational commitment (β=0.25, p<.05), career satisfaction (β=0.20, p<.1), and turnover intentions (β=−0.26, p<.05). The interaction Step accounted for an additional 4% (p<.05) to organisational commitment, 3% (p<.1) to career satisfaction, and 4% (p<.05) to turnover intentions. Graphs of the interactions are presented in Figures 1 and 2. Because the graphed effects for organisational commitment and career satisfaction are very similar, we graph these together (in Figure 1).

Figure 1 Interaction of age on Smart Technology, Artificial Intelligence, Robotics, and Algorithms (STARA) awareness with organisational commitment and career satisfaction as dependent variables
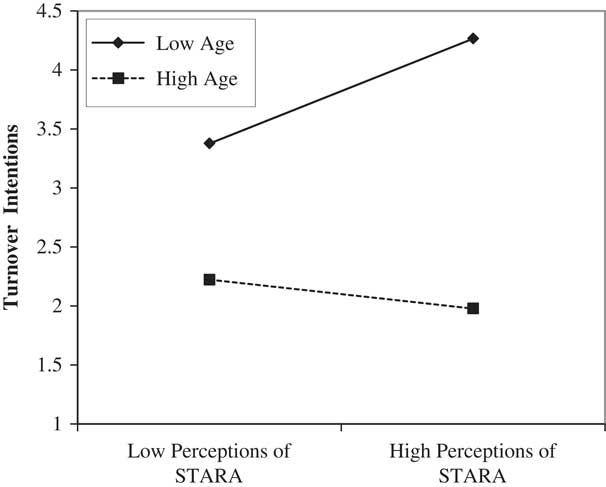
Figure 2 Interaction of age on Smart Technology, Artificial Intelligence, Robotics, and Algorithms (STARA) awareness with turnover intentions as dependent variable
Figure 1 shows that at low levels of STARA awareness there is little difference in terms of organisational commitment and career satisfaction with respect to age. However, at high levels of STARA awareness, significant differences are found. Older employees hold fairly stable levels of organisational commitment and career satisfaction, while younger respondents report a significant drop in organisational commitment and career satisfaction.
Figure 2 shows that at low levels of STARA awareness there is a significant difference in terms of turnover intentions, with younger respondents reporting much higher turnover intentions. At high levels of STARA awareness, these significant differences are exacerbated, with older employees holding fairly stable levels of turnover intentions, while younger respondents report a significant increase in turnover intentions. Combined, these findings support the hypothesis that the influence of STARA awareness would be moderated by age, with younger employees being more adversely affected.
In summary, STARA awareness was negatively associated with organisational commitment and career satisfaction supporting hypothesis one and two. STARA awareness was also positively associated with turnover intentions, depression, and cynicism supporting Hypotheses 3–5. The present study also found that younger employees had more STARA awareness which in turn moderated the effects of STARA awareness on outcomes supporting Hypotheses 6 and 7.
Qualitative results
The three thematic codes are split into sections within Table 4. The table displays 32 quotes out of a potential 67 participants who responded to this question.
Table 4 Qualitative thematic analysis on Smart Technology, Artificial Intelligence, Robotics, and Algorithms (STARA) awareness

Results from Table 4 highlight people’s perception of STARA from a wide range of professions. In total, 35 quotes were coded as 1 (no threat from STARA), 18 quotes were coded as 2 (potential threat from STARA), and 14 quotes were coded as 3 (perceived a real threat from STARA). Overall, there is a wide spread of comments amongst the responses and this reflects the quantitative data of STARA awareness somewhat (with a low M=1.7, on a 1–5-point scale). Examples of those registering no threat are all coded 1, with a specific example being ‘Because human interaction is a lot different compared to a robot and it isn’t the same and bar work and making drinks is a fine art if you do it the right way’ (No. 2, bartender). Examples of those seeing a potential threat are coded 2, and a specific example is ‘It could certainly help with aspects of the job but there is also a lot of human based aspects that would still be required, it could be a threat but I think there is still a need for human interaction’ (No. 26, travel agent). Finally, a specific example of a real threat is ‘Smart technology will assist in making transport solutions more appealing to the customer … Driving buses/taxis is already happening so operationally there is room for this’ (No. 29, manager transport services). We make additional references to the comments in the discussion.
DISCUSSION
The present study sought to explore employee STARA awareness and whether they consider new technology taking their job or changing their career. With a mean score of 1.7 (on a 1–5 scale), it would appear there is little belief in the idea of robots and automation taking over jobs in the workplace. This is also reflected in the results from the qualitative quotes (and subsequent coding of these quotes), which provide an insight into the proportion of participants who were aware of STARA in their current job or career. Whether the quantitative or qualitative responses represent ‘ignorance is bliss’ or ‘keen insight’ is currently unknown, and we must remember that the potential for STARA is simply that: potential. No one knows for certain how much the workplace and workforce will change and what role technology will play. However, the findings from the present study offer an interesting insight into how individuals view their future employment and career prospects, and how those views affect their job and well-being outcomes. Employees should consider their career opportunities and how they relate to STARA.
The results from the study show that when employees are more aware of STARA and its application to their job, they are more likely to have lower organisational commitment and career satisfaction. This falls into line with the career-planning model put forward by Aryee and Debrah (Reference Aryee and Debrah1993), who suggested that career planning can promote a positive cycle that increases career satisfaction and self-esteem at work. Consequently, the advent of STARA might spell the end to successful career planning and thus lead to the detrimental effects found here, reinforcing turbulent changes of a boundaryless career, which could become more prevalent in the future due to technology changes. In addition, employees with a higher perception of STARA are likely to have higher adverse effects on turnover intentions, depression, and cynicism. Overall, the findings from the study are not surprising considering that ‘unmet growth-related career expectations, in turn, have been associated with stress, burnout, and turnover intentions’ (Virtanen et al., Reference Virtanen, Kivimäki, Virtanen, Elovainio and Vahtera2003: 31).
Interestingly, STARA was found to not be significantly correlated to job insecurity, and this suggests it may indeed be tapping into something at the core of fundamental work and career planning. With job insecurity, an employee may face losing their job and have to look for another one. With STARA, the job and entire industry of employment might disappear. Indeed, some qualitative comments reflected strong STARA awareness but no loss of jobs. For example, No. 29 stated ‘I can’t see AI getting too involved in our sector from a management point of view … at a strategic level I can’t see it yet’. This reflects strong STARA awareness but not a personal loss of job, possibly highlighting the lack of STARA awareness and job insecurity correlating significantly.
It is clear that employee loyalty and commitment have been reduced as the prospect of lifetime employment in one organisation has slipped away (Mirvis & Hall, Reference Meyer, Allen and Smith1996): this is especially true with the rise of temporary contracts. STARA could be seen as part of this progression of undermining long-term commitment within an organisation or industry. Baruch discussed the importance of employees moving away from commitment and loyalty, stating that ‘From the individual perspective, it is a farewell to traditional commitment to the organization, moving to multiple commitments, which include merely a conditional commitment to the organization’ (Reference Baruch2004: 59). This outlook on commitment, and indeed commitment to one’s career, might have to be the future expectation for many employees. However, employees may already view traditional careers as something of the past, and be far more open to the idea of boundaryless careers that are dynamic and ever changing based on the employment context.
In addition to the contribution of linking STARA with job and well-being outcomes, there was consistent support for interaction effects on the job outcomes. Overall, at high levels of STARA awareness, older employees have little difference in commitment, career satisfaction, and turnover intentions compared with those respondents with low STARA awareness. This could be because older employees (even those who are aware of the potential of STARA) do not see STARA as a significant threat to their current job and career prospects. For example, Participants 9 and 10, both aged 60–70, stated, respectively, ‘I don’t see it impacting’ and ‘Not very much at all’. While this might reflect being blissfully unaware of these potential changes, it is more likely to represent the end of the career cycle for these employees. Hence, for older employees they have less stress and strain from their STARA awareness.
Implications
The present study has a number of implications, especially for individual employees. Current employees should research the impact and likelihood of STARA changing the line of work they are employed in, or are looking to enter. As a result, they might also need to be more mindful about the implications of STARA within their industry, and plan accordingly to accommodate these potential changes. Perhaps employees will also need to move their thoughts away from linear career systems to thinking of careers as multidirectional (Baruch, Reference Baruch2004). Given the rising cost of education, individuals need to commit to areas that are likely to provide them with employment (if employment is the desired outcome from study). As the supply of highly skilled graduates continues, with limited job prospects at the end of many of these degrees (Beaudry, Green, & Sand, Reference Beaudry, Green and Sand2013), this may create serious challenges for future job seekers. In addition, universities and training institutes need to be aware of industries that are potentially in decline and be careful to not market them as fruitful areas of employment. Bloom (Reference Bloom2014) argues that we are at a point where we need to focus on employment rather than employability at a national level.
Finally, one caveat must be noted within all of this: we do not know whether STARA will destroy or create jobs, as job creation has been the result of past industrial revolutions. STARA could potentially create more jobs than it displaces, and take the menial jobs away from the market. It might also reinvigorate the manufacturing base within many Western countries, as labour costs would be removed from the equation. For example, the advent of three-dimensional printing might make it economically feasible to produce products onshore, providing jobs for people within the country, rather than importing these goods from abroad. This new era of change could be considered a time of excitement for some employees; it could be embraced as an opportunity for exploration and personal growth. Ultimately, the future is very difficult to predict, it is interactive, emergent, and dynamic (Pryor, Amundson, & Bright, Reference Podsakoff and Organ2008).
Limitations and future research
The present study has several limitations. Future research should look to develop the sample size and also include employees from both the primary and secondary sectors. This type of research would also benefit from a longitudinal design to track individuals’ understanding of technological advancements as time progresses. Furthermore, do certain media landscapes create increased awareness of STARA? For example, if the US President makes an address on the risks to the US future workforce, or driverless cars are made mainstream, employees might consider the wider implications with more seriousness. The present study also makes the assumption (based on Frey & Osborne, Reference Feng and Graetz2013) that STARA could take away jobs. However, it is probable that more and different jobs will be created as a result. Finally, future research might include more specific questions around career planning as well as the potential for career/profession changes that employees might be considering, rather than relying on turnover intentions to capture this. Overall, we encourage more research to provide us with greater clarity and knowledge.
Conclusion
The period we are currently in has been described as a new industrial revolution. As a result we are expecting significant changes to the way we work, and what work will still be available to human employees in the very near future. This research explored how employees view their future jobs and careers in this ever changing world. Overall, the present study highlights the current state of how STARA is perceived regarding job and well-being outcomes. Future studies should be continued in this area to enable employees, employers, and government/policy makers to prepare for these potential changes. It is important that we prepare adequately, as the overall findings show that employees in general do not perceive STARA to be a threat, despite what well respected business people, scientists, and academics are predicting.


