

1. INTRODUCTION
The existing underwater acoustic navigation systems can be categorized into three main types: Long Baseline (LBL), Short Baseline (SBL), and Ultra Short Baseline (USBL). Even though USBL systems generally have the worst positioning accuracy compared to LBL and SBL systems, the advantages of low system complexity, small space requirement, and easy installation make them well suited for underwater vehicles (Kinsey et al., Reference Kinsey, Eustice and Whitcomb2006). In particular, USBL systems are effective for homing and docking operations under the ice in the Arctic region (Singh et al., Reference Singh, Bellingham, Hover, Lerner, Moran, von der Heydt and Yoerger2001).
Although the USBL system is quite effective for subsea navigation, it is subject to various potential sources of error including alignment, travel times, and angle measurements (Philip, Reference Philips2003a). With regard to the alignment error, this occurs in the installation of the USBL transceiver and separate attitude sensors. The calibration of alignment between sensors is always a problem that needs to be solved for precision navigation (Kinsey and Whitcomb, Reference Kinsey and Whitcomb2002; McEwen et al., Reference McEwen, Thomas, Weber and Psota2005; Kinsey and Whitcomb, Reference Kinsey and Whitcomb2007).
Generally the alignment calibration is performed based on the USBL observations of positioning a seabed transponder (Opderbecke, Reference Opderbecke1997). The effect of each individual angular misalignment on the USBL positioning error is related to the vessel's observation geometry (Philip, Reference Philips2003b). Various geometrical options, such as cardinal points, circular box-in, triangle, figure of eight, and hourglass have been proposed for alignment calibration (Faugstadmo et al., Reference Faugstadmo, Jacobsen and Gunhildstad2002). However, the USBL alignment calibration by using the methodologies mentioned above requires a vessel with a particular dynamic positioning (DP) capability.
It is known that the main advantage of performing survey activities by using a vessel to steam in a circle around the seabed transponder is the speed of operation. In addition, moving a vessel along circular paths offers the capability of nullifying sound speed error in the determination of two-dimensional horizontal position. In an earlier work with USBL alignment calibration, we proposed an iterative algorithm to estimate angular misalignments based on the circular survey strategy (Chen, Reference Chen2008). It has been demonstrated that the circular survey strategy can increase confidence in the correctness and validity of misalignment estimation. Moreover, even if the vessel's circular paths are eccentric, non-centred, or even distorted, the circular survey strategy still works effectively, which means that the circular survey strategy can be performed without the need to use a DP vessel. The only drawbacks of the circular survey strategy are the varying rotational acceleration and the noise generated in rotating a vessel; varying rotational acceleration will degrade the attitude sensor and the vessel noise could potentially degrade the USBL acoustic performance (Philip, Reference Philips2003b).
Compared to various geometrical options for alignment calibration, moving a vessel along a straight path is simple with respect to vessel manoeuvring. Therefore, by running a straight-line survey to locate a seabed transponder, we establish an iterative algorithm based on the positioning errors caused by heading, pitch, and roll misalignments, respectively. As a first step to the USBL line survey approach, the calibration algorithm is studied in a limiting situation such that the vessel is able to move along a desired straight course and its heading can be kept in line with the reference course while collecting USBL observations. Further corrections of USBL observations for course deviation and cross-track error will be described in Part II of the paper (Chen, Reference Chen2013).
Part I of this two-part paper is structured as follows: the mathematical expressions for the positioning errors of a seabed transponder with respect to sensor misalignments are derived in Section 2; in Section 3, a numerical algorithm for iteratively estimating alignment errors is developed; in Section 4, simulations are presented and discussed. Finally, conclusions are at Section 5.
2. USBL POSITIONING ERRORS
2.1. Coordinate systems
Figure 1 presents the geometric representation of a line survey with respect to the defined coordinate systems. The O GXGYGZG is an earth-fixed global reference frame. The O sXsYsZs is the reference frame for attitude sensors including gyrocompass and motion sensor. For simplicity of derivation, an earth-fixed frame O aXaYaZa is defined with its origin locating on the sea surface above the seabed transponder.

Figure 1. The calibration geometry and associated coordinate systems. The vessel is sailed along a pre-determined straight course while positioning a seabed transponder.
In Figure 1, the variable d denotes the horizontal distance from the seabed transponder to the vessel track (the dashed line), θ denotes the vessel heading, and (d, L) describes the position of the origin O s relative to the origin O a. To evaluate the effect of alignment error on USBL positioning, the coordinate system O tXtYtZt attached on the USBL transceiver is defined as depicted in Figure 2, in which the alignment errors of heading, pitch, and roll are denoted as α, β, and γ, respectively. According to the defined coordinate systems, the following homogeneous coordinate transformation matrices are derived for the calculation of USBL positioning errors:
 $${\bf T}_{sa} \,(d,L,\theta ) = \left[ {\matrix{ {\cos \theta} & { - \sin \theta} & 0 & { - d} \cr {\sin \theta} & {\cos \theta} & 0 & { - L} \cr 0 & 0 & 1 & 0 \cr 0 & 0 & 0 & 1 \cr}} \right]$$
 $${\bf T}_{ts}\, (\alpha ) = \left[ {\matrix{ {\cos \alpha} & {\sin \alpha} & 0 & 0 \cr { - \sin \alpha} & {\cos \alpha} & 0 & 0 \cr 0 & 0 & 1 & 0 \cr 0 & 0 & 0 & 1 \cr}} \right]$$
 $${\bf T}_{ts}\, (\beta ) = \left[ {\matrix{ 1 & 0 & 0 & 0 \cr 0 & {\cos \beta} & {\sin \beta} & 0 \cr 0 & { - \sin \beta} & {\cos \beta} & 0 \cr 0 & 0 & 0 & 1 \cr}} \right]$$
 $${\bf T}_{ts}\, (\gamma ) = \left[ {\matrix{ {\cos \gamma} & 0 & { - \sin \gamma} & 0 \cr 0 & 1 & 0 & 0 \cr {\sin \gamma} & 0 & {\cos \gamma} & 0 \cr 0 & 0 & 0 & 1 \cr}} \right]$$
where the matrix representation Tij with the subscript indicates the transformation from coordinate system j to coordinate system i. Tts(α), Tts(β), and Tts(γ) represent the transformation matrices formed from the heading, pitch, and roll misalignments, respectively.

Figure 2. Coordinate axes configurations of the sensor-fixed and the transceiver-fixed frames under different alignment errors. (a) Sensor-fixed frame, (b) Heading misalignment, (c) Pitch misalignment, and (d) Roll misalignment.
2.2. USBL positioning
The USBL positioning error arising from each of the angular misalignments is derived in this subsection. Let the position vector of the seabed transponder in the homogeneous O GXGYGZG coordinate system be PT
 $${\bf P}_T = [\matrix{ {P_{Tx},}\enspace {P_{Ty},}\enspace {P_{Tz},} \enspace 1 \cr} ]^T $$
which can be precisely estimated based on acoustic ranging and GPS observations (Chen and Wang, Reference Chen and Wang2007; Chen and Wang, Reference Chen and Wang2011). Given this, the position vector of the transponder in the O aXaYaZa homogeneous coordinate system can be written as
 $${\bf P}_a = [\matrix{ {0,}\enspace {0,} \enspace {P_{Tz},}\enspace 1 \cr} ]^T $$
In the absence of alignment error between attitude sensors and USBL transceiver, the O tXtYtZt frame coincides with the O sXsYsZs frame. In that case, the position vector of the seabed transponder measured by the transceiver in the O tXtYtZt homogeneous coordinate system is
 $${\bf P}_t = {\bf P}_{s}\,={\bf T}_{sa}\, (d,L,\theta )\,{\bf P}_a = \left[ {\matrix{ { - d} \cr { - L} \cr {P_{Tz}} \cr 1 \cr}} \right].$$
When the transceiver is mounted with a heading alignment error α, the position vector of the seabed transponder measured by the transceiver in the O tXtYtZt homogeneous coordinate system becomes
 $${\bf P}_t^\alpha = {\bf T}_{ts} \; (\alpha ){\bf T}_{sa} \; (d,L,\theta ){\bf P}_a = \left[ {\matrix{ { - d{\kern 1pt} \cos \alpha - L{\kern 1pt} \sin \alpha} \cr {d{\kern 1pt} \sin \alpha - L\cos \alpha} \cr {P_{Tz}} \cr 1 \cr}} \right]$$
where the superscript α of Ptα indicates heading misalignment. Similarly, when the transceiver is mounted with pitch alignment error β and roll alignment error γ, respectively, the position vector of the seabed transponder measured by the transceiver in the O tXtYtZt homogeneous coordinate system can be written as follows:
 $${\bf P}_t^\beta = {\bf T}_{ts}\, (\beta ){\bf T}_{sa}\, (d,L,\theta )\,{\bf P}_a = \left[ {\matrix{ { - d} \cr { - L\cos \beta + P_{Tz} \sin \beta} \cr {L\sin \beta + P_{Tz} \cos \beta} \cr 1 \cr}} \right]$$
 $${\bf P}_t^\gamma = {\bf T}_{ts}\, (\gamma ){\bf T}_{sa}\, (d,L,\theta )\,{\bf P}_a = \left[ {\matrix{ { - d\cos \gamma - P_{Tz} \sin \gamma} \cr { - L} \cr { - d\sin \gamma + P_{Tz} \cos \gamma} \cr 1 \cr}} \right]$$
2.3. Effect of alignment error on USBL positioning
Comparing Equations (8)–(10) with Equation (7), we found that heading misalignment results in an error in the X t- and Y t-coordinate measurements, pitch misalignment results in an error in the Y t- and Z t-coordinate measurements, and roll misalignment results in an error in the X t- and Z t-coordinate measurements. An example is given below to illustrate the effect of each alignment error on positioning a seabed transponder.
In the given example, a transponder is placed on the seafloor at a depth of 1000 metres and its global position is (0, 0, −1000) m. USBL positioning is performed while sailing the vessel along a predetermined straight-line path with heading θ=30°, horizontal distance d=0 m, and L ranging from −500 m to 500 m. Figure 3 presents the trajectories of the measured transponder position relative to the transceiver with and without alignment errors. The plots in Figure 3 demonstrate the following characteristics:
i. The trajectory of the measured transponder position relative to the transceiver is straight, no matter whether alignment error exists or not.
ii. The slope of the transponder trajectory on the X t-Yt plane varies only with heading alignment error. From the X t and Y t components of the position vector Ptα in Equation (8), we have the equation of the transponder trajectory on the X t-Yt plane:
(11)That is, with a heading alignment error α, the slope of the transponder trajectory on the X t-Yt plane is cot α. $$Y_t = X_t \cot \alpha + \displaystyle{d \over {\sin \alpha}} $$
iii. The slope of the transponder trajectory on the Y t-Zt plane varies only with pitch alignment error. Based on the position vector Ptβ in Equation (9), the equation of the transponder trajectory on the Y t-Zt plane is obtained:
(12)Equation (12) indicates that, with a pitch alignment error of β, the slope of the transponder trajectory on the Y t-Zt plane is −tan β.$$Z_t = - Y_t {\kern 1pt} \tan \beta + \displaystyle{{P_{Tz}} \over {\cos \beta}} $$iv. The roll alignment error has no effect on the slopes of the transponder trajectories on both the X t-Yt and the Y t-Zt planes. However, the roll misalignment introduces constant errors in the measurement of X t and Z t coordinates of the transponder position. Therefore, based on Equation (10), the alignment error γ can be obtained by solving either of the following two equations:
(13)$$X_t = - d{\kern 1pt} \cos \gamma - P_{Tz} \sin \gamma $$(14)$$Z_t = - d{\kern 1pt} \sin \gamma + P_{Tz} \cos \gamma $$
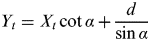
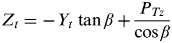
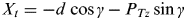
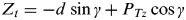

Figure 3. The plot shows an example of the transponder trajectory relative to the transceiver when performing USBL line survey. (a) Unbiased trajectory. (b) Trajectories with heading misalignment. (c) Trajectories with pitch misalignment. (d) Trajectories with roll misalignment.
3. ITERATIVE ALGORITHM
In this section, a USBL calibration procedure that takes advantage of the geometry of position errors resulting from angular misalignments is proposed. The calibration algorithm is constructed as follows:
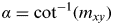
i. Observing Figure 3(b)–(d), it will be noted that the slope of the trajectory on the X t-Yt plan varies with heading alignment error only. Therefore, heading alignment error can be approximately estimated from the slope of the transponder trajectory on the X t-Yt plane. Let the slope of the transponder trajectory on the X t-Yt plane be m xy. Then, from Equation (11), it follows that the heading alignment error is estimated as:
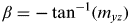
(15)$$\alpha = \cot ^{ - 1} (m_{xy} )$$ii. After heading alignment error is obtained, the raw positioning data is corrected for the heading misalignment. Then, we can assume that the corrected positioning data is biased by pitch and roll misalignments only. By examining Figure 3(c) and 3(d), it can be seen that only pitch misalignment has an effect on the slope of the trajectory on the Y t-Zt plane; the slope of the trajectory on the Y t-Zt plane does not vary with roll alignment error. Let the slope of the transponder trajectory on the Y t-Zt plane be m yz. Based on Equation (12), the pitch alignment error can be approximately evaluated as
(16)$$\beta = - \tan ^{ - 1} (m_{yz} )$$iii. Once heading and pitch alignment errors are obtained, they are used to correct the raw positioning data. We assume here that only roll alignment error has an effect on the corrected positioning data. As mentioned in subsection 2.3, the roll alignment error can be estimated from either Equation (13) or Equation (14). In the case with no USBL measurement error, the estimate of the roll misalignment obtained from Equation (13) will be the same as that obtained from Equation (14). However, in reality measurement error occurs. To evaluate the effect of the USBL measurement error on the estimation of roll alignment error, Equations (13) and (14) are rewritten as:
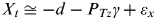
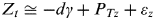
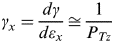
(17)$$X_t = - d{\kern 1pt} \cos \gamma - P_{Tz} \sin \gamma + \varepsilon _x $$(18)where ε x and ε z represent the USBL measurement errors in the X t and Z t coordinates, respectively. The roll alignment error is in general small enough so that Equations (17) and (18) can be simplified as$$Z_t = - d{\kern 1pt} \sin \gamma + P_{Tz} \cos \gamma + \varepsilon _z $$(19)$$X_t \cong - d - P_{Tz} \gamma + \varepsilon_{x} $$(20)According to Equations (19) and (20), we have the sensitivities of γ to the measurement errors ε x and ε z, respectively, below:$$Z_t \cong - d\gamma + P_{Tz} + \varepsilon _z $$(21)$$\gamma _x = \displaystyle{{d\gamma} \over {d\varepsilon _x}} \cong \displaystyle{1 \over {P_{Tz}}} $$(22)In practical applications, many USBL transponders use directional transducers with a limited operating beamwidth. In addition, multi-path propagation causes degradations of acoustic signals, and acoustic transmission over a vertical channel may have less multi-path spread than over a horizontal channel. For these reasons, USBL positioning is preferably operated at the condition of |d|<|PTz| to track the transponder, which results in the magnitude of γ x often being less than γ z. Consequently, for solving roll alignment error γ, Equation (13) would be a better choice than Equation (14) if there are measurement errors in USBL observations, and this feature will be demonstrated through the numerical simulations presented in Section 4.$$\gamma _z = \displaystyle{{d\gamma} \over {d\varepsilon _z}} \cong \displaystyle{1 \over d}$$iv. Note that the computations of each alignment error described above are made with the assumption that the other two angular misalignments have been completely corrected; but in reality, this is not what generally happens. Therefore, the preceding steps have to be repeated until all estimates of the alignment errors have converged.


The schematic flowchart of the calibration algorithm that describes the above process is depicted in Figure 4. The iterative scheme starts with initial guesses of α (0)=β (0)=γ (0)=0. In each iteration, the increments (∆α, ∆β, and ∆γ) in each of α, β, and γ are computed, and the alignment errors are updated in the order of heading, pitch, and roll by adding to them the corresponding increments ∆α, ∆β, and ∆γ, respectively. Note that before evaluating the increment of each alignment error, the observed raw positioning data has to be corrected based on the updated estimates of the three alignment errors. The iterative form for alignment errors is given by:
 $$\left\{ {\matrix{ {\alpha ^{(k)} = \alpha ^{(k - 1)} + \Delta \alpha} \cr {\beta ^{(k)} = \beta ^{(k - 1)} + \Delta \beta} \cr {\gamma ^{(k)} = \gamma ^{(k - 1)} + \Delta \gamma} \cr}} \right.,\quad k = 1,{\kern 1pt} 2,{\kern 1pt} 3,{\kern 1pt} \ldots $$
where k represents the kth iterate. The iterative process is continued until all estimates of α, β, and γ have converged.

Figure 4. Algorithm for finding heading, pitch, and roll alignment errors of a USBL positioning system.
4. NUMERICAL SIMULATIONS
We now present two numerical examples to demonstrate the robustness and effectiveness of the proposed algorithm. In the first example, it is assumed that the transponder position is measured without error, while in the second example measurement error in transponder positioning is considered. In both examples, the alignment errors between sensors are α=3°, β=5°, and γ=−7°, the coordinate of the seabed transponder on the O GXGYGZG frame is (0, 0, −1000)m, and the observation of USBL measurements is collected by sailing a vessel along a straight-line path with heading θ=30°, d=100 m, and L ranging from −500 m to 500 m.
4.1. Estimation without measurement error
Figure 5(a) shows the raw transponder trajectory relative to the transceiver measured with alignment errors. Note that the aspect ratio of the plots in Figure 5 is not 1:1 for the ease of visualization in the change of slope of the transponder trajectory. Based on the proposed algorithm, the following shows details of each step performed at the first iteration.

Figure 5. Simulation results of an ideal case, in which the transponder trajectory is represented by a solid line. (a) The transponder trajectory obtained with alignment errors of α=3°, β=5°, and γ=−7°. (b) Transponder trajectory corrected for heading alignment error estimated at the first iteration. (c) Transponder trajectory corrected for heading and pitch alignment errors estimated at the first iteration. (d) Transponder trajectory corrected for heading, pitch, and roll alignment errors estimated at the first iteration. (e) The corrected transponder trajectory obtained after 10 iterations.
4.1.1. Heading misalignment estimation
The heading alignment error is calculated based on the slope of the transponder trajectory on the X t-Yt plane. In Figure 5(a), the slope of the trajectory on the X t-Yt plane is m xy=24·07, and according to Equation (15), we obtain the estimate of the heading alignment error α=2·38°. Though α=2·38° is underestimated but, for the first iteration, it has been close to the exact value of 3°. The transponder trajectory corrected for the estimate of α=2·38° is shown in Figure 5(b), in which the slope of the trajectory on the X t-Yt plane is much steeper than that before correction.
4.1.2. Pitch misalignment estimation
After the transponder trajectory is corrected for the estimate of α=2·38°, the second step is to calculate the pitch alignment error based on the slope of the corrected trajectory on the Y t-Zt plane. By observing Figure 5(b), the slope of the transponder trajectory on the Y t-Zt plane is m yz=−0·093. According to Equation (16), the pitch alignment error is estimated to be β=5·32°, which is close to the exact value of 5°. The transponder trajectory corrected for the estimates of α=2·38° and β=5·32° is shown in Figure 5(c), in which the slope of the compensated trajectory on the Y t-Zt plane is close to zero.
4.1.3. Roll misalignment estimation
The third step in this iteration is to perform roll misalignment estimation based on either the X t or Z t coordinates of the corrected transponder trajectory. In the absence of measurement error in USBL positioning, the roll misalignments estimated from either X t or Z t coordinates are the same. Figure 5 (c) shows that the mean values of the X t and Z t coordinates of the transponder trajectory are −220·8 m and −980·4 m, respectively. Yet, according to Equations (13) and (14), the X t and Z t coordinates of the transponder trajectory shall be −100 m and −1000 m respectively when the roll misalignment is corrected. Therefore, by substituting either X t=−220·8 into Equation (13) or Z t=−980·4 into Equation (14), the roll alignment error is estimated to be −6·98°, which is extremely close to the exact value of −7°. The transponder trajectory corrected for the estimates of α=2·38°, β=5·32°, and γ=−6·98° is shown in Figure 5(d), which shows the X t coordinate of the trajectory has been corrected to about −100 m, and the Z t coordinate of the trajectory is close to the exact value of −1000 m.
The estimates of alignment errors obtained at the first iteration are still not exact, but close to exact. By repeating the iterative process, the estimates of α, β, and γ converge to the correct values. Figure 5(e) shows the corrected transponder trajectory obtained at the tenth iteration, in which the slopes of the trajectory on the X t-Yt and Y t-Zt planes have been corrected to approach infinity and zero, respectively. Further, the corrected trajectory has the X t and Z t coordinates almost −100 m and −1000 m, respectively. Table 1 gives the history of the estimates of three alignment errors as generated by the iterative procedure. All estimates of α, β, and γ converge to their true values. The iterative process converges fairly rapidly to the exact value; all estimates of α, β, and γ have converged to within 0·0001 degrees after four iterations.
Table 1. Iteration history of alignment error estimation for an ideal case without measurement error. The true values of α, β, and γ are 3°, 5°, and −7°, respectively.

4.2. Estimation with measurement error
In a USBL system, the position vector of a transponder is calculated by the combination of slant range and angles measured by the transceiver (Chen, Reference Chen2008):
 $${\bf P}_t = \left[ {\matrix{ {S_r \;\cos \psi \;\sin \phi} \cr {S_r \;\cos \psi \;\cos \phi} \cr { - S_r \;\sin \psi} \cr}} \right]$$
where S r represents the slant range, ϕ is the bearing angle, and ψ is the depression angle. To evaluate the effectiveness and robustness of the proposed algorithm to measurement noise, random Gaussian noise was added into USBL measurements. The measured slant range S rm, bearing angle ϕ m, and depression angle ψ m are implemented by the following expressions:
 $$\left\{ {\matrix{ {S_{rm} = S_r + S_{r\sigma}} \cr {\phi _m = \phi + \phi _\sigma} \cr {\psi _m = \psi + \psi _\sigma} \cr}} \right.$$
where S rσ, ϕσ, and ψ σ are independent additive noise terms that account for measurement errors.
The measurement noise in range and in arrival angles are modelled as being normally distributed with a zero mean. In this simulation, the standard deviations of S rσ, ϕσ, and ψ σ are assumed to be 0·2 m, 0·25°, and 0·25°, respectively. Figure 6(a) shows the observed transponder positions (circles) obtained with measurement noise and alignment errors of α=3°, β=5°, and γ=−7°. The following steps detail the procedure for calculating alignment errors at the first iteration.

Figure 6. These plots show the simulation results with the consideration of measurement error, in which the transponder position observations and their linear fit are represented by circles and a solid line, respectively. (a) The transponder observations obtained with alignment errors of α=3°, β=5°, and γ=−7°. (b) Transponder positions corrected for heading alignment error estimated at the first iteration. (c) Transponder positions corrected for heading and pitch alignment errors estimated at the first iteration. (d) Transponder positions corrected for heading, pitch, and roll alignment errors estimated at the first iteration. (e) The corrected transponder positions obtained after ten iterations.
4.2.1 Heading misalignment estimation
Heading alignment error is estimated based on the slope of the trajectory on the X t-Yt plane. By the use of least-squares approach, we fit the raw transponder observations to a straight line (the solid line in Figure 6(a)). The slope of the fitted line is m xy=24·4 which, based on Equation (15), yields the estimate of α=2·33°. The transponder positioning corrected for the estimate of α=2·33° is shown in Figure 6(b), in which its trajectory on the X t-Yt plane slopes up steeply.
4.2.2 Pitch misalignment estimation
By observing Figure 6(b), the corrected transponder positioning on the Y t-Zt plane is fitted to a straight line with a slope of m yz=−0·092. Based on Equation (16), the slope of m yz=−0·092 leads to the estimate of pitch alignment error as β=5·25°. The transponder positioning corrected for the estimates of α=2·33° and β=5·25° is shown in Figure 6(c), in which the slope of the compensated transponder trajectory on the Y t-Zt plane becomes relatively flat.
4.2.3 Roll misalignment estimation
In Figure 6(c), the mean values of X t and Z t coordinates of the calibrated transponder measurements are −221·1 m and −980·2 m, respectively. In this case, we use Equation (13) to solve for the roll alignment error. Substituting the mean value of X t=−221·1 into Equation (13), the roll alignment error is estimated to be γ=−6·996°. The transponder observations are then corrected for the estimates of α=2·33°, β=5·25°, and γ=−6·996°, and the result is shown in Figure 6(d). It can be seen from Figure 6(d) that the mean values of X t and Z t coordinates of the compensated transponder measurements are close to −100 m and −1000 m, respectively.
The results in Figure 6(b)–(d) show that, even in cases where measurement error is involved, all estimates of the three alignment errors at the first iteration are fairly close to the true values. Figure 6(e) shows the corrected transponder positioning obtained at the tenth iterations, in which the slopes of the transponder trajectory on the X t-Yt and Y t-Zt planes have been corrected to approach infinity and zero, respectively, and the corrected transponder trajectory has its X t and Z t coordinates nearly equal to −100 m and −1000 m, respectively. Table 2 presents the iterative estimates of the alignment errors, in which all estimates of α, β, and γ converge close to their true values with very small error. Furthermore the algorithm is robust even when measurement error is taken into account; all estimates have converged to within 0·0001 degrees after 4 iterations.
Table 2. Iteration history of alignment error estimation for the case with the consideration of measurement error. The true values of α, β, and γ are 3°, 5°, and −7°, respectively.

4.3. Estimation of roll alignment error
The roll alignment error obtained in Table 2 is estimated by solving Equation (13) with the mean of X t coordinates of the transponder trajectory. Based on Equation (14), the roll alignment error can also be estimated by using the mean of Z t coordinates of the transponder trajectory. That is, the roll alignment error has a coordinate dependence and can be determined in terms of either X t or Z t:
 $$\gamma = \gamma ^{(x)} (X_t, d,P_{Tz} ) = \gamma ^{(z)} (Z_t, d,P_{Tz} )$$
Yet, as indicated in Section 3, γ (x) would be a better choice than γ (z) when there is measurement error in USBL observations and the condition of |d|<|P Tz| is met.
To further verify that γ (x) is superior to γ (z) in the estimation of roll alignment error, we repeat the estimation process for 1000 sets of USBL observations with different randomly generated measurement noise. These 1000 different simulated data sets are generated by adding normally distributed random measurement noise to the ideal positioning data. The parameter values used to generate these data are the same as in the simulation in subsection 4.2: α=3°, β=5°, γ=−7°, (P Tx, PTy, PTz)=(0, 0, −1000)m, θ=30°, d=100 m, L ranging from −500 m to 500 m. The standard deviations of S rσ, ϕσ, and ψ σ are 0·2 m, 0·25°, and 0·25°, respectively. Note that in this example, the magnitude of d is less than that of P Tz, meaning that the condition of |d|<|P Tz| is satisfied. Each data set is processed by the proposed iterative algorithm to estimate three alignment errors, in which the roll alignment error is calculated separately from γ (x) and γ (z). Figure 7 shows the distributions of the estimates of γ (x) and γ (z) for the 1000 data sets. As we expected, the standard deviation of the estimates of γ (x) is significantly smaller than that of the estimates of γ (z), indicating that the γ (x) estimate is more robust against measurement error than the γ (z) estimate.

Figure 7. Distributions of the estimates of γ (x) and γ (z). The true value of the roll alignment error is −7°.
Note that the results shown in Figure 7 are obtained under d=100 m and P Tz=−1000 m. The effect of measurement error on the estimate of roll misalignment is further investigated by varying the value of d from 100 to 1000. For each value of d, the standard deviations of the estimates of γ (x) and γ (z) are calculated respectively as above, and the results are presented in Figure 8. It is shown that the standard deviation of γ (x) is almost a constant. It can be explained from Equation (21) that the sensitivity of γ to the measurement error ε x is nearly proportional to 1/P Tz which is a constant as P Tz=−1000 m. For the standard deviation of γ (z), it increases dramatically as d decreases. This can be realized through Equation (22) that the sensitivity of γ to the measurement error ε z is nearly proportional to 1/d. Further, as illustrated in Figure 8, the standard deviations of γ (x) and γ (z) are nearly identical when the absolute ratio of d to P Tz is close to unity. It can be clarified by looking at Equations (21) and (22) that the magnitudes of γ x and γ z will tend to be identical when |d|=|P Tz|. The results shown in Figure 8 agree with our earlier assertion that γ (x) is a better choice than γ (z) for estimating roll alignment error when |d|<|P Tz|.

Figure 8. Based on simulated data with measurement error, this plot shows the standard deviations of the estimates of γ (x) and γ (z), respectively, with respect to the absolute ratio of d to P Tz.
5. CONCLUSION
In this paper, we have proposed an iterative algorithm that allows effective estimation of angular misalignments between attitude sensors and an Ultra Short Baseline (USBL) transceiver. This algorithm is based on positioning errors caused by heading, pitch and roll misalignments, respectively, when running a USBL line survey with a seafloor transponder. The positioning errors arising from each of the angular misalignments have been derived. The differences of positioning error arising from each of the angular misalignments are identified and, accordingly, these differences outline a simple and intuitive iterative scheme to calibrate each misalignment angle in turn. The performance of the characteristic-based iterative algorithm has been investigated and validated by simulations. The simulation results have shown that, even when measurement error exists in USBL positioning, the estimates of alignment errors obtained at the first iteration are close to being correct. Moreover, only a few iterations are required to achieve very accurate solutions. Results in this study strongly support the superiority of the proposed algorithm, which yields a very rapid and robust convergence of the solution series. In addition, the advantage of the proposed approach is its speed of operation because only a line survey is needed for the calibration of USBL angular misalignments.
This study has also shown that, by the use of the USBL line survey, the roll alignment error can be estimated from either the X t or Z t coordinates of the transponder position relative to the transceiver. In the absence of measurement error in USBL observations, the roll alignment error estimated from γ (x) (estimation using the X t-coordinate data of USBL positioning) will be the same as that estimated from γ (z) (estimation using the Z t-coordinate data of USBL positioning). However, when there is measurement error in USBL observations and when the horizontal distance from the seabed transponder to the vessel track is less than the depth of the transponder (i.e., |d|<|P Tz|), we have shown that γ (x) is expected to be a more robust estimate than γ (z). Numerical simulations have further confirmed this finding.
ACKNOWLEDGEMENTS
The author would like to thank the Asian Pacific Ocean Research Center of National Sun Yat-sen University for supporting this research. The author also gratefully acknowledges the financial support of the National Science Council of Taiwan under contract nos. NSC99-2221-E-110-094 and NSC102-3113-P-110-004.


