
The definition of happiness or well-being can be divided into three kinds (Diener, Reference Diener1984). The first category emphasizes that well-being has been defined by external criteria such as virtue or holiness, and the criterion of happiness is not the subjective judgment of the actor, but the observer’s value framework. However, the second category of happiness relies on the respondent’s judgment of a good life, and Diener (Reference Diener1984) also pointed out that happiness was almost equal with life satisfaction. The third kind of definition of happiness emphasizes a pleasant emotional experience. Since more researchers have considered the latter two categories (i.e. life satisfaction and the positive and negative affect of subjective well-being; Diener, Oishi, & Lucas, Reference Diener, Oishi and Lucas2003; Lucas, Diener, & Suh, Reference Lucas, Diener and Suh1996), subjective well-being in this research was defined as a combination of both life satisfaction and pleasure of experience.
Subjective well-being (SWB) is an important indicator of the quality of life, and it can make important predictions of future life outcomes (Diener, Reference Diener2012). For example, Lyubomirsky, King, and Diener (Reference Lyubomirsky, King and Diener2005) concluded that it may cause desirable characteristics, resources and successes correlated with happiness. Also, Diener (Reference Diener2012) put forward that SWB is linked with good citizenship behavior in the community. The research in adolescence also found that high SWB is of great significance to adolescence (Orkibi, Ronen, & Assoulin, Reference Orkibi, Ronen and Assoulin2014).
Over the last four decades, many scales have been developed to measure SWB, such as the Satisfaction with Life Scale (SWLS; Diener, Emmons, Larsen, & Griffin, Reference Diener, Emmons, Larsen and Griffin1985), Affect Balance Scale (ABS; Bradburn, Reference Bradburn1969), General Happiness Scale (GHS; Lyubomirsky & Lepper, Reference Lyubomirsky and Lepper1999) and the Short Happiness and Affect Research Protocol (SHARP; Stones et al., Reference Stones, Kozma, Hirdes, Gold, Arbuckle and Kolopack1996). However, it is difficult for a single scale to reveal the whole picture of SWB. For example, the SWLS only measures the cognitive component of SWB (Emerson, Guhn, & Gadermann, Reference Emerson, Guhn and Gadermann2017), while the ABS only measures its affect composition. It seems that the goal of covering all aspects of SWB needs to be achieved at the expense of increasing items, but this would enlarge the test burden and decrease test motivation (Forkmann et al., Reference Forkmann, Boecker, Norra, Eberle, Kircher, Schauerte and Wirtz2009). No doubt, increasing the items would also prolong test time. So, it is necessary to explore how to measure SWB as a whole without increasing items and time, and computerized adaptive testing (CAT) was designed to meet this desire.
In fact, CAT measures the whole picture of trait ability, not through increasing the length of the test, but through constructing an item bank and setting some selection rules in the program to make sure the test-taker can meet the targeted items. The adaptive testing is based on the traditional paper and pencil test, which has shortcomings, such as the excessive length of the test. In an adaptive test, the additional items are selected from an item bank that is built in advance and whose item parameters were known (Weiss, Reference Weiss1985). The general principles of CAT were first applied in intelligence tests and developed in the early 1900s (Weiss, Reference Weiss1985). Such an approach can reduce the test-taker’s time and tedium related to extended testing (Forbey & Benporath, Reference Forbey and Benporath2007) while gaining an optimal amount of information needed (Žitný, Reference Žitný2011). The effectiveness of CAT has also been supported in psychological measurement; for instance, the individual abilities may be estimated more precisely and efficiently (Embretson, Reference Embretson1992). CAT was developed on the basis of adaptive testing, combined with computer and item response theory (IRT), which can assess the severity order of each item that is specified by one measure (Hagman et al., Reference Hagman, Kuerbis, Morgenstern, Bux, Parsons and Heidinger2009) and some assumptions (Anderson, Kahn, & Tindal, Reference Anderson, Kahn and Tindal2017), such as unidimensionality and local independence assumption.
To date, CAT has been widely used in the field of ability measurement and psychology, such as the Graduate Record Examination (GRE) and Test of English as a Foreign Language (TOEFL), and depression (Forkmannd et al., Reference Forkmann, Boecker, Norra, Eberle, Kircher, Schauerte and Wirtz2009) and personality (Forbey & Benporath, Reference Forbey and Benporath2007). After investigating all the techniques used to measure SWB, no study applying CAT methods to SWB in university students was found. This study aimed to develop a CAT of SWB (CAT-SWB) to measure the whole picture of SWB while reducing test time and the number of test items without attenuating precision and accuracy. In all, the proposed CAT-SWB can provide a greater flexibility to the algorithm (Sunderland et al., Reference Sunderland, Slade, Krueger, Markon, Patrick and Kramer2017) while targeted items were selected to evaluate the whole picture of SWB using fewer items without losing measurement accuracy.
Methods
Samples
About 1,000 participants were recruited from 39 universities in 20 provinces in China. These universities included six types (according to the category of subject setting): comprehensive university, normal university, polytechnic university, medical university, national university and military university. The 20 provinces were divided into two categories (the eastern region and other region) in that Wu (Reference Wu2017) pointed out that there remain significant regional differences on SWB between the eastern region and other region. The participants volunteered to complete this test after being informed that their personal information would be kept secret and the test would occupy them for about half an hour. After excluding some invalid data (large missing responses data, consecutive responses data and inconsistent responses data), 724 participants remained, comprising 303 females and 421 males, with a mean age of 19.12 (SD = 1.11). Of the sample, 48% were freshmen, 23% were sophomores, 24% were juniors, and 5% were seniors; 38% of participants were from urban areas and 62% were from rural areas.
Measures
After referencing previous studies and literatures, seven commonly used SWB scales were chosen to construct the initial item bank of the CAT-SWB. The SWB scales used here included the Satisfaction with Life Scale (SWLS; Diener et al., Reference Diener, Emmons, Larsen and Griffin1985), General Well-Being Scale (GWB; Fazio, Reference Fazio1977), Well-Being Index Scale (WBIS; Campbell, Converse, & Rodgers, Reference Campbell, Converse and Rodgers1976), Global Happiness Scale (GHS; Lyubomirsky & Lepper, Reference Lyubomirsky and Lepper1999), Scale of Happiness of the Memorial University of Newfounland (MUNSH; Kozma & Stones, Reference Kozma and Stones1980), Affect Balance Scale (ABS; Bradburn, Reference Bradburn1969) and Subjective Well-Being Scale for Chinese Citizens (SWBS-CC; Xing, Reference Xing2003).
Except for the GHS, the other six scales have a Chinese version. These are the GWB, WBIS, MUNSH and ABS, obtained from Wang, Wang, and Ma (Reference Wang, Wang and Ma1999), the SWLS (Yang, Tian, Wang, & Cui, Reference Yang, Tian, Wang and Cui2015), and the SWBS-CC (Xing, Reference Xing2003). Therefore, the GHS was translated into Chinese. The confirmatory factor analysis (CFA) showed the Chinese version of GHS has the same unidimensional structure with the original GHS (normed fit index [NFI] = 1, confirmatory fit index [CFI] = 1, root mean square error of approximation [RMSEA] = 0.052, standardized root mean square residual [SRMR] = 0.006).The reliability analysis showed the Chinese version of the GHS has an acceptable reliability (Cronbach’s α = .719, split-half reliability coefficient = .747), and has a close association with life satisfaction (r = .387, p < .01), which indicated that the Chinese version of the GHS has a high convergent validity.
Item pool construction of the CAT-SWB
The construction of the CAT-SWB item bank included five steps.
Step 1: Item selection for the initial item bank of the SWB. All the items to construct the initial item bank are from the seven commonly used SWB scales.
Step 2: The unidimensionality test of the initial item bank. Any item which does not fit the unidimensionality assumption or has low loading on the main factor will be excluded from the initial item bank to guarantee the unidimensionality of the item bank.
Step 3: IRT model comparison and selection. In this step, a more suitable IRT model will be chosen to conduct the analysis of IRT.
Step 4: Item analysis with IRT. Item analysis will include the local independence test, parameter estimation, item fit and differential item functioning. We will delete items with local dependence, low discrimination, poor item fit or having differential item functioning (DIF).
Step 5: The construction of the final item bank for SWB. According to the above four steps, all items that meet the measurement requirements will be included to build the final item bank for SWB.
Item selection
All of the seven chosen scales are self-report scales. The SWLS contains five items and belongs to a 7-point, Likert-type scale. The GWB contains 24 items, and there are 3–11 choices for each item. Items 15–18 use a 0–10 rating scale that is anchored by adjectives (e.g. very depressed to very happy). Items 2, 5, 6, 7, 19 use a 5-point rating scale (e.g. quite troubled to not troubled at all), items 1, 3, 4, 8, 9, 10, 11, 12, 13, 14 use a 6-point rating scale (e.g. all the time to never), item 24 uses a 7-point rating scale (e.g. yes, very helpful to have no problem), and the remaining items use a 3-point rating scale (e.g. yes, in the past year to no); all these choices represent either intensity or frequency. The WBIS contains nine items and has a 7-point, Likert-type scale. The GHS contains four items, with a 7-point, Likert-type scale. The MUNSH contains 24 items, and each item has three levels (yes, unclear and no). The ABS contains 10 items and each item has two levels (yes and no). The SWBS-CC (short version) contains 20 items, with a 7-point, Likert-type scale.
Unidimensionality
According to Flens, Smits, Carlier, Van, and De (Reference Flens, Smits, Carlier, Van Hemert and De Beurs2016), when the ration of total variance explained by the first factor is above the Reckase criterion of 20% and the value of the first eigenvalue divided by the second eigenvalue is higher than Reeve criterion of 4, the scale is deemed to be unidimensional.
An exploratory factor analysis (EFA) was employed to investigate the above criterions. Items with the first factor load less than 0.3 (Nunally, Reference Nunally1978) were first removed to ensure that the remaining items met the assumption of unidimensionality of IRT. The EFA was conducted till the remaining items were unidimensionality.
IRT model comparison and selection
The fit of a parametric IRT model is very important when implementing IRT (Liang & Wells, Reference Liang and Wells2009). Under the IRT framework, an IRT model can be divided into two main categories: the difference models (or cumulative logits models) and the divided-by-total models (or adjacent logits models; Tu, Zheng, Cai, Gao, & Wang, Reference Tu, Zheng, Cai, Gao and Wang2017). A representative model of difference models is the Graded Response Model (GRM; Samejima, Reference Samejima1969) while a typical model in divided-by-total models is the Generalized Partial Credit Model (GPCM; Muraki, Reference Muraki1992), and the Nominal Response Model (NRM; Bock, Reference Bock1972) is the extreme form of the divide-by-total group, which allows truly nominal responses (Chen, Reference Chen2017).
GPCM is an extension of the Partial Credit Model (PCM) proposed by Masters (Reference Masters1982) by adding the discrimination parameter. The NRM, developed by Bock (Reference Bock1972), may be applied to items with alternatives that cannot be ordered to represent varying degrees of the trait measured and attempts to increase the precision of the theta estimates (Dodd, Ayala, & Koch, Reference Dodd, Ayala and Koch1995). The GRM, introduced by Samejima (Reference Samejima1969), has the same number of item parameters with GPCM and belongs to the class of models for which the responses are measured on an ordinal scale. After investigating a sea of literature, the above three models were all commonly used polytomously scoring models in IRT, and were also commonly applied to CAT (e.g. Dodd et al., Reference Dodd, Ayala and Koch1995; Paap, Kroeze, Terwee, Palen, & Veldkamp, Reference Paap, Kroeze, Terwee, Palen and Veldkamp2017; Zhou & Reckas, Reference Zhou and Reckase2014). Therefore, this article employed these models and investigated which one fitted the data best. In this research, the Akaike’s information criterion (AIC), Bayesian information criterion (BIC) and -2 log-likelihood were used to investigate which model fitted the data best, since selecting a model with a smaller value of AIC, BIC and -2 log-likelihood is widely accepted in model selection. The smaller the AIC/BIC/-2 log-likelihood, the better the fit of the model (Posada, Crandall, & Simon, Reference Posada, Crandall and Simon2001).
Local independence
A Q 3 statistic was proposed by Yen (Reference Yen1984) to detect local independence of IRT. If the Q 3 value of an item was larger than an arbitrary cut value, it meant the item had local dependence (Finch & Jeffers, Reference Finch and Jeffers2016). As Flens et al. (Reference Flens, Smits, Carlier, Van Hemert and De Beurs2016) pointed out that the value of Q 3 above 0.36 represents a moderate deviation or dependence, therefore in this article, items with a Q 3 value larger than 0.36 were removed from the item bank to ensure all remaining items met the IRT assumption of local independence.
Item discrimination parameter
The discrimination parameter in IRT is an important indicator to evaluate the quality of an item. Chang and Ying (Reference Chang and Ying1996) pointed out that discrimination with a value between 0.5 and 2.5 seems to be an acceptable item parameter. In this article, items with a discrimination less than 0.5 were removed from the item pool to ensure a high-quality item pool for the SWB.
Item fit
Testing goodness of item fit proves to be an important step when analyzing IRT-based analysis (Köhler & Hartig, Reference Köhler and Hartig2017). Here the S-X 2 (Kang & Chen, Reference Kang and Chen2008) statistic was used to evaluate item-fit. Items with a p value of S-X 2 less than .05 were deemed a misfit and removed from the item pool.
Differential item functioning (DIF)
DIF was analyzed to identify item bias for a wide range of variables, such as gender (male/female), region 1 (rural/urban) and region 2 (eastern region/other region), to build a non-biased item bank. The logistic regression (LR; Choi, Gibbons, & Crane, Reference Choi, Gibbons and Crane2011) method and lordif package of Rstudio were used to detect DIF. The change of McFadden’s (McFadden, Reference McFadden and Zarembka1974) pseudo R 2 with △R 2 > .02 and p > .05 was used as the criterion of detecting DIF. That is to say, items with △R 2 > .02 and p > .05 for the change of McFadden’s pseudo R 2 were deemed as having DIF and were excluded from the item pool.
The construction of the final item bank
According to the above steps, all items that met the measurement requirements were included to build the final item bank for SWB.
Simulation of the CAT-SWB
The simulation of the CAT-SWB was to achieve the algorithm’s checking of it and evaluate the item bank. First, 71 thetas were simulated whose values ranged from -3.5 to 3.5 with intervals of 0.1; each theta was repeated 100 times to simulate 7,100 new thetas or examinees. Based on the existing references (Bock & Mislevy, Reference Bock and Mislevy1982; Chang & Ansley, Reference Chang and Ansley2003; Magis, Reference Magis2015), the 71 thetas were from -3.5 to +3.5 with the intervals of 0.1. The theta values between -3.5 and +3.5 covered almost all the ability values (99.96%), and 71 thetas with 100 replications for each theta value can ensure that as many as possible of the representative ability points of different ability participant groups are covered. This simulation differs from the method of randomly extracting the theta from the standard normal distribution, since the latter may have uneven extraction problems. For example, the method of randomly extracting cannot ensure that there are enough examinees (e.g. n = 100) with very high theta values or very low theta values.
Second, the item parameters of the last valid item bank should be imported into the CAT program. Moreover, the item responses in the CAT-SWB were simulated with four stopping rules. The advantage of simulating new thetas was that it can reach full ranges of the participants with different theta values. According to Magis and Raiche (Reference Magis and Raiche2012), the CAT process can be divided into four steps, which are initial step, test step, stopping step and final step. In the initial step of this CAT process, the first item was selected randomly from the item bank and then the participant’s response was simulated according to the true value of the ability simulated in advance and the randomly selected initial item. Moreover, the theta value was estimated by the expected a posteriori method (EAP; Bock & Mislevy, Reference Bock and Mislevy1982) based on the item response and item parameters. In the test step, all of the Fisher information values for each remnant item in the item pool were calculated. Then, at the provisional estimate of the new theta, according to the maximum Fisher information criterion (Linden, Reference Linden1998), one of the popular item selection criterions in adaptive testing, the next item was selected. In the stopping step, the CAT program stopped when the standard error (SE) theta (θ) of measurement reached 0.500, 0.447, 0.387 or 0.316, which represented the measurement reliabilities of 0.75, 0.80, 0.85 and 0.90 respectively, according to the formula of reliability (θ) = 1- SE (θ)2 in IRT. The final step yielded the final estimation of theta value, the numbers of response item and standard error of measurement. The number of items in the CAT program was explored and MATLAB 2016 was used to plot the test information function and standard error of measurement for checking its measurement precision using test information function (TIF) and SE (θ). All CAT simulations were run using catR package for Rstudio (Magis & Raiche, Reference Magis and Raiche2011). The code for CAT simulation and item pool construction was presented in the supplementary material.
Also, a real-data simulation of the CAT-SWB was carried out to sufficiently investigate the accuracy of algorithm and the quality of item bank. The difference between the real-data simulation of the CAT-SWB and the simulated-data simulation of the CAT-SWB was that the former used the real 724 participants’ responses collected in advance while the latter used the simulated examinees’ responses. Item parameters and the real responses of the 724 participants were imported while using the real-data simulation of the CAT-SWB. The CAT program also stopped when the SE (θ) of measurement reached 0.500, 0.447, 0.387 or 0.316. The usage of items in the CAT program was considered. For a more intuitive presentation, MATLAB 2016 was used to plot the number of administered items across the latent trait.
Intending to investigate how the consistency between the estimated theta by full-item bank and the estimated theta by the adaptive CAT, the consistency was investigated by the Pearson’s correlation (r). Also, Cohen’s d was considered to evaluate whether the CAT scores sufficiently similar to the full-item bank scores (Flens et al., Reference Flens, Smits, Carlier, Van Hemert and De Beurs2016).
Results
Item pool construction of CAT for SWB
Item selection
The initial item bank included 95 items from seven commonly used SWB scales. The index Cronbach’s alpha was also calculated to check the reliability of each scale, which is displayed in Table 1. The reliabilities of the ABS (Cronbach’s α = .63) and the internal consistency of the GHS (Cronbach’s α = .72) were acceptable, and the reliabilities of other five scales were good (Cronbach’s α > .80). The dimension and the number of dimensions for each scale are also displayed in Table 1. Because there were several dimensions that were the same, the initial item bank eventually contained 16 different dimensions, which covered all the main domains of SWB. The correlation (Pearson correlation) analysis showed there were significant correlations among 16 dimensions (except the Health Concerns subscales) with the value from .213 to .713 (all ps < .01), which indicated that these dimensions measured a common component (i.e. SWB).That is to say, they can be regarded as unidimensionality.
Table 1. Brief description of the scales in this study
Note: The 8th item of ABS scale and the 7th item of MUNSH scale are the same (“Depressed or very unhappy”). The first dimension of SWLS scale and the second dimension of WBIS scale are the same (Life Satisfaction shown in bold type). The first dimension of MUNSH scale and the first dimension of the ABS scale are the same (Positive Affect shown in bold type). The second dimension of MUNSH scale and the second dimension of ABS scale are the same (Negative Affect shown in bold type).
Moreover, as the related research showed, the Well-Being Index Scale (Campbell et al., Reference Campbell, Converse and Rodgers1976), the Scale of Happiness of the Memorial University of Newfoundland (Diaz, Moraga, & Soromaa, Reference Diaz, Moraga and Soromaa2011) and the Global Happiness Scale (Parackal, Reference Parackal2016) have significant correlations with life satisfaction while Xing (Reference Xing2002) regarded the Satisfaction with Life Scale, the Subject Well-Being Scale for Chinese Citizens and the Affect Balance Scale as scales for measuring SWB, and Duan (Reference Duan1996) also considered the General Well-Being Scale as a scale to measure SWB. All these indicated that these seven commonly used scales can refine a main common measurement factor or component (i.e. SWB). That is to say, all these seven commonly used scales measure SWB.
Unidimensionality
After 16 items were removed due to their first factor load less than 0.3, with the remaining 79 items, the first factor explained 26.41% of the total variance, which was above 20%. And the ratio of the first eigenvalue to the second eigenvalue was 5.24, which was higher than 4. According to Reckase and Reeve criterion (Flens et al., Reference Flens, Smits, Carlier, Van Hemert and De Beurs2016), it can be concluded that the remaining 79 items measured one main factor (i.e. SWB) and met the assumption of unidimensionality of IRT.
Model comparison and selection
Table 2 documented the model-data fit indicators. As shown in Table 2, the GRM had the smallest value of AIC, BIC and -2log-likelihood, which indicated that the GRM fit the data best. Therefore, the GRM was selected as the IRT model that was used to the subsequent IRT analysis.
Table 2. Indexes of model-fit based on test level
Note: GRM = Graded Response Model, GPCM = Generalized Partial Credit Model, NRM = Nominal Response Model (NRM; Bock, Reference Bock1972), AIC = Akaike’s information criterion, BIC = Bayesian information criterion.
Local independence
Using the 0.36 as the arbitrary cut-value (Flens et al., Reference Flens, Smits, Carlier, Van Hemert and De Beurs2016), 15 items were removed in that its absolute Q 3 values were higher than 0.36; then the remaining items met the local independence well.
Item parameter
All remaining item discrimination parameters were higher than 0.5 (see Table 3) with a mean of 1.2 (SD = 0.37), which was regarded as a not bad value, and no item was removed from the current item bank.
Table 3. Some estimation values of the final item pool with 64 items
Note: adiscrimination parameter.
bdegree of freedom.
Item fit
All the p values of S-X 2 for all remaining items were higher than .05 (see Table 3), which indicated that all the remaining items fitted well to the GRM.
Differential item functioning (DIF)
DIF results showed that all the items’ ΔR2 values were less than .02 and the corresponding p values were less than .05, which indicated there were no items with DIF in gender and the region (region 1 and region 2) of the participants.
Table 4 displayed the number of items used to measure each dimension in the final item pool. Fortunately, in the final item pool, all the 16 dimensions have been measured, and the number of items measured per dimension ranges from 1 to 8. Although only one item measured the dimension of health concern and two items measured the dimension of satisfaction and interest in life, each dimension used no less than three items, especially the dimension of negative affect, which used eight items to measure. To sum up, it can be concluded that the item bank performed well in content validity because it covered all 16 main domains of the SWB and provided a good guarantee for measuring the whole picture of the SWB.
Table 4. Number of items used to measure each dimension in the final item pool
Note: These dimensions are from the seven commonly used scales of SWB.
The construction of the final item bank
The final item bank contained 64 items (see Table 3) after the above statistical analysis under the framework of IRT. The item bank of SWB met the IRT assumptions of unidimensionality and local dependence, fitted the GRM well, had high discrimination parameters, no DIF existed and had an acceptable content validity. All these results showed that the proposed item bank of SWB was acceptable.
Simulation of the CAT-SWB
Results based on the simulated data of the CAT-SWB
Table 5 displays the results of simulated data statistics for the CAT-SWB under four stopping rules of SE (θ) = 0.500/0.447/0.387/0.316; these were called Rule 1, Rule 2, Rule 3 and Rule 4 respectively. For the four stopping rules, the mean numbers of administered items ranged from 5.77 to 17.78, or 9–28% of the full-item bank. This result was satisfactory, especially with the stopping rule of SE (θ) = 0.500; the CAT-SWB used only about six items while achieving the full-item efficiency; mean of SE (θ) = 0.47. Obviously, the CAT-SWB saved the number of items to a large extent. Table 5 also shows the Pearson’s correlations (r) between the CAT theta estimates and full-item bank theta estimates under each stopping rule, which were all higher than .9. That is to say, the theta value between CAT and the full-item bank was very similar. In addition, the mean value of theta estimated under Rule 1–Rule 4 was very close to the average of theta estimated using the full-item bank, and there was no statistically significant difference (p > .05). Moreover, the Cohen’s d under each stopping rule was close to zero and indicated that there was no structure difference between theta estimates using CAT and theta estimates using the full-item bank.
Table 5. Simulated-data simulation statistic for the CAT-SWB under four stopping rules
Note:a The percentage of the mean numbers of administered items in the full-item bank. bStopping rule SE (θ) = 0.500. cStopping rule SE (θ) = 0.447. dStopping rule SE (θ) = 0.387. eStopping rule SE (θ) = 0.316. fPearson’s correlations between the CAT θ estimates and full-item bank θ estimates.
Figure 1 displays an intuitive result of test information function (TIF) and standard error of measurement (SEM) across the latent trait under the simulated-data simulation of CAT. The higher the theta value, the higher the SWB. Figure 1 documents the information about how precisely a test can measure the latent trait. It is easy to see almost all the SEM values were under 0.33; these values are regarded as acceptable since Michel et al. (Reference Michel, Baumstarck, Lancon, Ghattas, Loundou, Auquier and Boyer2017) pointed out that a SEM between 0.33 and 0.55 was defined as acceptable and the smaller the SEM, the more accurate the CAT-SWB. Test information can be expressed as the sum of all item information at any relevant theta level. The larger the TIF at each theta level, the smaller the SEM. After considering these, we could conclude that the CAT-SWB reached sufficient information and acceptable standard error. In other words, the algorithm of the CAT-SWB performed well.
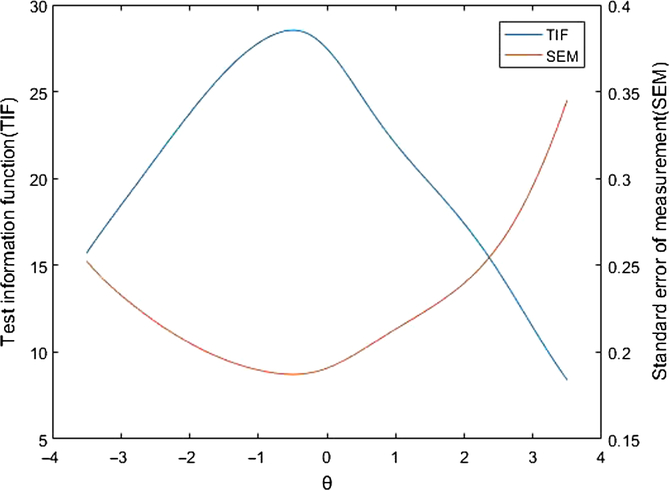
Figure 1. A bell-shaped test information function (TIF) of all 64 items of the bank (blue dotted line), and also plotted the standard error of measurement (SEM; red solid line).
Results based on real-data of the CAT-SWB
Table 6 documents the results of real-data simulation statistic for the CAT-SWB under four stopping rules with SE (θ) = 0.500/0.447/0.387/0.316. The results were similar to the above results of simulated-data simulation for the CAT-SWB. Even better was that the number of items in real-data simulation was less than those in above simulated-data simulation. For example, under Rule 4, the mean of SE (θ) reached 0.316, and the average usage of an item was 13.80, which was 22% of the full-item bank, while in the simulated-data simulation, this was 28%. We drew an additional diagram (see Figure 2) that displays the number of items administered intuitively across the latent trait under the four stopping rules. Figure 2 indicates that almost all the items administered were under the horizontal line labeled 20 items, which was 31% of full-item bank. All of these results indicate that the CAT-SWB performed well in a real-data simulation.
Table 6. Real-data simulation statistic for the CAT-SWB scale under four stopping rules

Note: aThe percentage of the mean numbers of administered items in the full-item bank. bStopping rule SE (θ) = 0.500. cStopping rule SE (θ) = 0.447. dStopping rule SE (θ) = 0.387. eStopping rule SE (θ) = 0.316. fPearson’s correlations between the CAT θ estimates and full-item bank θ estimates.
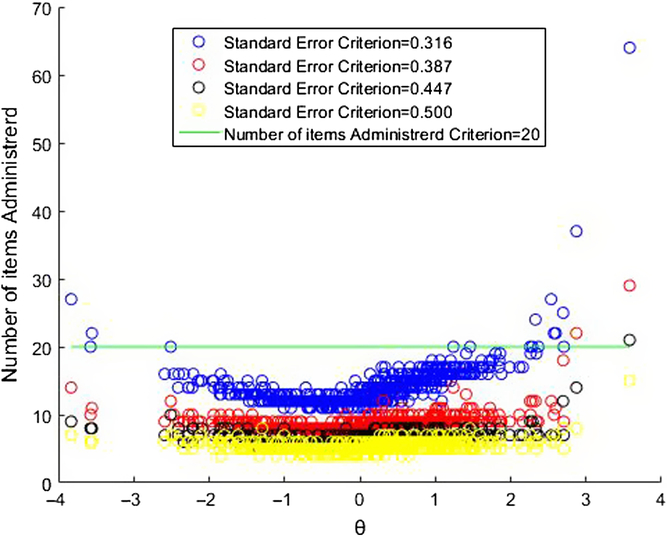
Figure 2. Number of administered items under four stopping rules.
Overall, it can be concluded that whether it is the simulated-data simulation or the real-data simulation, the algorithm of the CAT-SWB performed well, and it provides accuracy and low burden for the assessment of the Chinese university students’ SWB.
Discussion
Until now, there are many examples that support the opinion that CAT can save the number of items to a certain extent without the loss of measurement precision. For example, when the CAT was applied to the Minnesota Multiphasic Personality Inventory (MMPI; Anderson et al., Reference Anderson, Kahn and Tindal2017) it showed that it can be reduced even by 119 items in the best case. For gross motor skills CAT (GM-CAT; Huang et al., Reference Huang, Tung, Chou, Wu, Chen and Hsieh2018), the averages of items administered were from 7 to 11 while the item bank contained 44 items. There are many researchers who believe that CAT can improve the accuracy of the evaluation of trait level (θ) of the examinees (Barrada, Olea, Ponsod, & Abad, Reference Barrada, Olea, Ponsoda and Abad2009).
This article proposed a CAT version of SWB (CAT-SWB) to measure the whole picture of SWB. After sequential analyses of unidimensionality, local dependence, item discrimination, item fit and DIF under the framework of IRT, the final item bank contained 64 items that were from seven commonly used SWB scales. The final item bank of the CAT-SWB covered 16 main domains of SWB and met the goal of measuring the whole picture of SWB. Diverging from other researches, this study investigated both simulated-data simulation and real-data simulation, which took full account of the efficiency of CAT. Both the simulated-data simulation and real-data simulation showed that the CAT-SWB had satisfactory accuracy and a low burden for measuring SWB. The averages of items administered were from 5.36 to 17.78, which were 8–28% of the full-item bank, and almost all the SEM were smaller than 0.33. In addition, the theta estimates of the CAT and the full-item bank were very similar and had very high correlations of more than .9. All these results indicate that the proposed CAT-SWB not only has a high measurement precision but also can greatly shorten test length. Moreover, there existed no DIF in gender and the regions of participants, and this enhances our confidence in promoting this CAT version.
Despite the promising results, there were also some limitations about this study. First, an extra finding shown in Figure 1 was that the CAT-SWB provided little information for those whose latent trait theta was higher than 2.5, which indicates that the CAT-SWB may not be appropriate for these participants. Second, the participants in this study were mainly recruited from two provinces in China. Therefore, more samples should be recruited from a wider range of provinces in the future. Third, as described in Table 4, some of the 16 dimensions were measured using only 1–2 items. This may be a shortcoming for measuring the whole picture of SWB. Therefore, future research, could consider adding more items to measure these dimensions, and this would ensure that the test measures the whole picture of SWB.
Fourth, although the item bank was consistent with the structure of unidimensionality under a series of criteria in accordance with the requirements of previous studies, this item bank also contained 16 domains. This inspired us to verify whether fitting results of the item bank and the multidimensional IRT (MIRT) model may be better. First, since the initial item bank contained 95 items from 16 domains, a CFA was used to investigate the fit of the item bank with the 16-dimensional structure. The results showed that the model with 16 dimensions cannot be identified. Then we tried to explore the structure of the item bank. Twenty-three factors were extracted with a principal component analysis that employed the variance maximum rotation method; the eigenvalue was greater than one criterion (EVG1) and the factor load higher than 0.3 criterion (Nunally, Reference Nunally1978). Second, given that the obtained pattern of eigenvalues is ambiguous, a parallel analysis (Horn, Reference Horn1969; Humphreys & Ilgen, Reference Humphreys and Ilgen1969) was employed to extract eight factors. Third, because the first 8 factors show that the proportion of the variation is small (42.973%), 20 factors can then be extracted to explain over 60% of the total variance. The results again showed that the model cannot be identified.
From this series of factor analysis, we can see that no matter whether it is 16 dimensions or 20 dimensions, the data is of a high dimension and a multidimensional CAT (MCAT) can be addressed in future research.
Finally, there are some reasons why it is not necessary to consider too many factors that may have an impact on SWB. For example, the main purpose of our research was not to explore factors that may affect SWB, but to construct a CAT-SWB to measure SWB for different participants. Moreover, the great advantage of IRT over classical test theory is that it only needs to cover all the respective theta values of the participants, which avoids the limitation of sample dependence when estimating item parameters (Hagman et al., Reference Hagman, Kuerbis, Morgenstern, Bux, Parsons and Heidinger2009). That is to say, we just needed to guarantee that the sample size was sufficient and ensure there was a wide representation in theta values of SWB. However, there also remained some variables, such as culture and personality, that have an impact on SWB (Diener et al., Reference Diener, Oishi and Lucas2003). It is preferable that those factors that might affect SWB are taken into account in future research to explore whether they affect SWB in mainland China.
Conclusions
The proposed item bank of SWB had acceptable psychometric properties under the framework of IRT and measured a comprehensive concept of SWB in that 16 main domains of SWB were covered. The proposed CAT-SWB had an excellent performance in saving the number of response items without attenuating measurement precisions. Above all, this CAT-SWB can advance the efficiency of measuring a comprehensive concept of SWB.
Supplementary material
To view supplementary material for this article, please visit https://doi.org/10.1017/prp.2019.6
Acknowledgments
The authors appreciated the anonymous reviewers who made very helpful comments on an earlier version of this article, and are very grateful to all the individual participants who involved in this study. This research was funded by the National Natural Science Foundation of China (31760288, 31660278).
Conflict of interest
None.
Ethical approval
All procedures performed in studies involving human participants were in accordance with the ethical standards of the institutional and/or national research committee and with the 1964 Helsinki declaration and its later amendments or comparable ethical standards.


 Open access