


People who cross international boundaries on their own initiative for career, economic or personal reasons are an important resource to employers and a significant component of the international labour market (Howe-Walsh & Schyns, Reference Howe-Walsh and Schyns2010). The management of this talent, particularly those who self-initiate that mobility (self-initiated expatriates), has been highlighted as one of the most challenging human resource management issues of the 21st century (Scullion, Collings, & Gunnigle, Reference Scullion, Collings and Gunnigle2007). Research on this population is currently burgeoning, with the publication of a special issue in Career Development International (Doherty, Richardson, & Thorn, Reference Doherty, Richardson and Thorn2013b) and three edited books in the last year (Andresen, Al Ariss, & Walther, Reference Andresen, Al Ariss and Walther2012; Hasleberger & Vaiman, in press; Reis & Baruch, Reference Reis and Baruch2013). The original think piece on self-initiated expatriates (Inkson, Arthur, Pringle, & Barry, Reference Inkson, Arthur, Pringle and Barry1997) has now been supplemented with empirical evidence on the characteristics and motivations of internationally mobile workers from, for example, Finland (Suutari & Brewster, Reference Suutari and Brewster2003), Denmark (Andersen & Rasmussen, Reference Andersen, Rasmussen, Andresen, Al Ariss and Walther2012), France and Germany (Stahl & Cerdin, Reference Stahl and Cerdin2004), the United Kingdom (Dickmann, Doherty, Mills, & Brewster, Reference Dickmann, Doherty, Mills and Brewster2008), and New Zealand (Carr, Inkson, & Thorn, Reference Carr, Inkson and Thorn2005). This research has suggested that individuals who initiate their own international expatriation are different from the much-researched corporate expatriates (Cerdin & Pargneux, Reference Cerdin and Pargneux2010). They are more heterogeneous, with a wider age range, broader and more varied motivations for mobility, and an even balance of men and women (Tharenou, Reference Tharenou2010).
The development of understanding of self-initiated expatriation is, however, not well advanced. While there has been recognition that this form of expatriation is increasing (Al Ariss & Özbilgin, Reference Al Ariss and Özbilgin2010), differs from corporate expatriation (Doherty et al., Reference Doherty, Dickmann and Mills2011; Jokinen, Brewster, & Suutari, Reference Jokinen, Brewster and Suutari2008), and is valuable to both individuals and organisations (Doherty & Dickmann, Reference Doherty and Dickmann2009; Richardson & Mallon, Reference Richardson and Mallon2005), further insights are limited. There has been little consideration of the different patterns and forms that mobility can take (Bozkurt & Mohr, Reference Bozkurt and Mohr2011); for example, ‘there-and-back’ mobility, consecutive mobility, repeated cycles of mobility, or of the cumulative impact of successive moves. Further, while the propensity to be mobile (Tharenou, Reference Tharenou2002, Reference Tharenou2003) and motivations for mobility have been examined (Hippler, Reference Hippler2009), the subjective motives have not been related to the moves actually made (Iredale, Reference Iredale2001).
Consequently, in this article we have attempted to observe, describe, measure and categorise international mobility patterns and to link them to motivation. This could provide valuable information — if we know why people are relocating, can we predict where they are going to? In the current ‘global war for talent’ (Beechler & Woodward, Reference Beechler and Woodward2009, p. 273), this information could provide competitive advantage. Here, therefore, we explored relationships between the self-reported motives for relocating abroad, and the actual mobility patterns those respondents had undertaken.
Motives for Self-Initiated Expatriation
The traditional view of international mobility, particularly of the highly educated, has been epitomised in the metaphor of brain drain, in which people exploit the market value of their skills and talents, moving from poorer to richer countries to enhance their economic position. Mobility, however, is motivated by more than just economic factors (Inkson et al., Reference Inkson, Carr, Edwards, Hooks, Jackson, Thorn, Allfree, Glendon, Thompson and Myors2007; Stahl & Cerdin, Reference Stahl and Cerdin2004) and decisions to be mobile may have multiple causes.
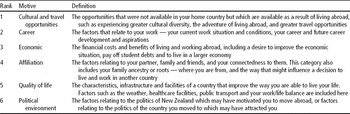
The literature on motives for self-initiated expatriation, including factor analytic studies, has identified clusters of key factors termed here as economics, cultural and travel opportunities, affiliations (including family), career, quality of life, and political environment (Doherty, Reference Doherty2010; Jackson et al., Reference Jackson, Carr, Edwards, Thorn, Allfree, Hooks and Inkson2005). Thorn (Reference Thorn2009) detailed these categories of motive, and examined the relative importance of the motives to New Zealanders living and working abroad. This is not repeated here, but Table 1 provides a summary of the motives and some examples of what was included within the categories. Interestingly, similar findings from studies involving different cultural groups have suggested there may be some cross-cultural consistency in these motivating factors (Tharmaseelan, Inkson, & Carr, Reference Tharmaseelan, Inkson and Carr2010). Motivation is, however, likely to depend on specific circumstances, including national characteristics. For example, the political environment was relatively unimportant in the New Zealand context, but may be of more importance among those who live in underdeveloped countries with autocratic regimes. Similarly, the cultural and travel opportunities motive was very highly ranked for New Zealanders, a geographically isolated country, but may not be so important for those from central Europe.
Table 1 Definitions of Motives for Mobility as Stated in the Questionnaire
Mobility Patterns
In current studies, international mobility has tended to be viewed as the accumulation of discrete moves by individuals from one place to another (Raghuram, Reference Raghuram2004). There has been little consideration of how one move may be part of a planned series of moves or how mobility is developed and experienced as an individual pattern. Return migration, its motives, and readjustment to the home country have certainly been considered (Gill, Reference Gill2005; Tharenou & Caulfield, Reference Tharenou and Caulfield2010), but the discourse is of a completed, rather than continuous journey. There has been little research on patterns of mobility, or data that considers the multiple relocations of people from one country to another over time.
When considering international mobility, a number of aspects must be incorporated. From a subjective perspective, there is the issue of why people move, or the motivation for mobility as discussed above. From the perspective of the actual mobility, however, there are other factors such as the frequency of mobility, how long the stay is, whether there is any intention of permanence, and the nature of the destination itself. Next we identify some constructs which may help us to understand mobility better, through an examination of common patterns.
Frequency of Mobility
The nature and frequency of mobility have changed. Clifford (Reference Clifford1997, p. 1) suggests that there is a ‘new world order of mobility’ where society as a whole responds to the ‘relatively rigid patterns of modernity’ by becoming more restless and seeking more frequent change. This is aligned to Spacks’ (Reference Spacks1995, p. 23) discussion on boredom, where he noted ‘a concomitant increase in personal sense of entitlement’ whereby actors demand the right to be stimulated. Hence, when a location ceased to be stimulating, people moved location in an attempt to rejuvenate the excitement. But the restlessness then regenerates: it could be eased by a new location and a period of assimilation, but once the experiences offered by one place have been consumed, the desire for change increased, and a new destination would be sought.
Richards and Wilson (Reference Richards and Wilson2004) discussed frequency of mobility in the context of tourism, labelling those who moved from place to place ‘Global Nomads’. The concept could similarly be applied to international mobility. In this context, the pattern is one of continual international movement. This mobility might be cyclical, with repeated periods of time in the home and host country or countries, or alternatively, progressive, with repeated movement to different countries.
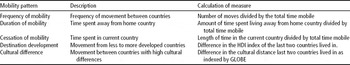
Operationally, frequency of mobility could be measured as the number of moves to a different (or repeat) country that a person has taken, divided by the total length of time mobile.
Duration of Mobility
While some people have never left their home country, others spend little time there. This later group has often been referred to as cosmopolitan, with a perception of being at home all over the world. Cosmopolitans show four key behaviours. They will (1) have been ‘extensively mobile’ (Szerszynski & Urry, Reference Szerszynski and Urry2002, p. 470); (2) displayed openness and tolerance towards divergent experiences (Kofman, Reference Kofman2005); (3) be able to mediate between different cultures; and (4) consider that people can be both different and equal (Beck & Sznaider, Reference Beck and Sznaider2006). Hence, another observable mobility pattern could entail considerable exposure to other countries, and more time spent in other countries than the home country. This was developed into a measure of the duration of mobility, namely the proportion of time a person has spent abroad since they first became mobile (left the home country). The use of an individualised, proportional measure was important in a situation such as this, as it immediately controls for age, and a possible correlation between age and mobility (the older a person is, the longer they have had to be mobile).
Cessation of Mobility
Initially mobile people may, however, become less mobile over time and seek to establish themselves long term in a new location. The longer people have been established in a country, the more likely they were to have assimilated to the host country, and the less likely it is that they will move again (Maynard, Ferdman, & Holmes, Reference Maynard, Ferdman, Holmes and Carr2010), particularly once they acquired citizenship (Scott, Reference Scott2004). The length of time in the current country therefore became another possible conceptualisation of mobility.
The Destination — Development Level
Mobility has most frequently been viewed as a way of improving a situation, in which people moved from poorer to richer countries (Cappellen & Janssens, Reference Cappellen and Janssens2005). The first theory of mobility was developed from neo-classical economics (Arango, Reference Arango2000), and, in its simplest form, proposed that people move to countries to obtain employment at a greater income level. The associated mobility pattern could, therefore, have involved movement from economically developing to developed countries where their skills can earn a premium.
There are many measures of the development level of a country including Gross Domestic Product (GDP) and the Human Development Index (HDI). The HDI incorporates GDP alongside the normalised measures of life expectancy, literacy and educational achievement (United Nations Development Programme, 2007). The advantage of the HDI, therefore, is that it reveals how countries turn income into education and health opportunities (Lozano & Gutierrez, Reference Lozano and Gutierrez2008) which is important in a study of the highly educated. Hence, the mobility pattern here involved people who moved from countries with a lower HDI to those with a higher HDI.
The Destination — Cultural Difference
Moving between countries is often risky and uncertain (Maynard et al., Reference Maynard, Ferdman, Holmes and Carr2010). There are usually a range of adjustments required, perhaps including fundamental differences in language, customs and belief systems, but potentially also significant variations in business ethics, gender issues and personal safety. Hofstede's (Reference Hofstede1980, Reference Hofstede2001) seminal work on cultural distance clearly highlighted the differences between countries. This has been further developed in the GLOBE (Global Leadership and Organisational Behaviour Effectiveness) project (House, Reference House2004), which examined the way culture is experienced in 62 different countries. It is not difficult to find evidence that people feel more comfortable and secure in locations that have some elements of familiarity (Frieze & Li, Reference Frieze, Li and Carr2010), but others revel in difference. The way in which people interact with their new location often determined the way in which they assimilated into that country, and therefore, the propensity to either stay or leave. Hence, the degree of cultural difference between countries would impact on mobility.
Operationally, this mobility pattern was defined as being located in countries with cultures that were very different to New Zealand — the home country for this population. It was measured as the cultural distance of the current country from the home country, as indexed by GLOBE.
Having identified five possible patterns of mobility, the next step was to determine if there was any link between motivation and the mobility patterns. In other words, was it possible to predict these patterns of mobility from individuals’ motivation? This study was highly exploratory, both in the development of the mobility constructs and in the use of the analytical tool Chi-squared Automatic Interaction Detector (CHAID). The next section details how we investigated these possible links.
Methodology
The data used in this article were collected via a self-reported, web-based survey of highly educated New Zealanders who were living and working abroad. The definition of self-initiated expatriation used was that the individual had willingly moved to the new location, in keeping with the thinking on self-initiated expatriation at the time (for a recent exposition of the spectrum of global mobility, see Doherty, Richardson and Thorn, Reference Doherty, Richardson and Thorn2013a). A snowball method of sampling was used (no incentive was offered), with initial contacts being made through university alumni organisations, professional associations and clubs and associations identified through a web search. The high level of interest from New Zealanders yielded a total of 2,608 usable responses. Of these, 52.5% were male and 47.5% female (p < .01), supporting Suutari and Brewster's (Reference Suutari and Brewster2000) prediction that self-initiated mobility would not be as male-dominated as traditional expatriation. The mean age of respondents was 36.9 years, with men being, on average, slightly older than women (38.8 years and 34.9 years respectively, p < .01). Most respondents were married or partnered (67.8%), although only 29.2% of the total respondents had dependents living with them.
On average, the respondents had moved 2.2 times, with 11 being the greatest number of movements between countries. Just over half of the respondents (53.1%) were on their first move. The respondents were spread throughout 93 countries, although the majority were based in the predominantly English speaking countries of the United Kingdom, Australia, the United States, Canada and Ireland.
This article is focused on just two aspects of the full survey — respondents’ self-reported motives for mobility, and their actual international mobility. The subjective motive data was collected in the form of a set of scores totalling 100, with each respondent being asked to allocate these points among the six motives (cultural and travel opportunities, economics, career, affiliations, quality of life and the political environment), depending on how important each had been in their latest move. The specific wording given to participants was: ‘Imagine you have 100 points to allocate between these motives to show how important each was in your most recent decision to move from New Zealand. Distribute the points to reflect the relative importance of each of these motives to you. Some motives may not have been relevant to you, and these can be left blank. Please ensure that the total for all motives equals 100.’
In this situation, rank ordering was more reliable than the original ipsitive data (Coolican, Reference Coolican2009) as people will maintain their overall rank preferences from one time to another, but may not allocate exactly the same percentage to each motive a second time. The predictor variables were therefore converted to ranks, from 1 (the most preferred motive), to 6, (the least preferred motive). The definitions provided for participants for each motive were indicated in Table 1.
The behavioural measures were computed from analysis of the actual moves respondents had made across international boundaries. As part of the survey, they recorded each of the countries they had lived in and the length of time in each location. A summary of the generic and operational definitions of each mobility pattern has been shown in Table 2. Because the calculations for each of the mobility pattern measures were completely different, the range of values for each of the measures differed. These have all been shown on the CHAID figures.
Table 2 Summary of Measures for Each Mobility Pattern
Analysis
A simple correlation was undertaken to obtain an overall impression of whether there were obvious linkages among both the motives and the mobility patterns, and between the two sets of variables. Because the original measure for the motives was ipsative and ordinal, Spearman's Rank Order Correlations Coefficient has been used.
A CHAID analysis was then undertaken using SPSS v17. CHAID is a method of database segmentation that is effective in obtaining meaningful segments that can (like regression analysis) predict a variable or detect interactions between variables (McCarty & Hastak, Reference McCarty and Hastak2007). It has been used primarily in marketing to segment customer databases (Galguera, Luna, & Mendez, Reference Galguera, Luna and Mendez2006; van Diepen & Franses, Reference van Diepen and Franses2006). In the current study, we used it to determine whether the independent variables (the motives) predicted the dependent variable (the mobility pattern).
CHAID divides a population into mutually exclusive and exhaustive nodes that have similar characteristics, generating a visual decision tree (Hsu & Kang, Reference Hsu and Kang2007). It attempts to predict values of the dependent variable from a number of predictor variables (McCarty & Hastak, Reference McCarty and Hastak2007). The CHAID algorithm is a stepwise progression (Kass, Reference Kass1980). In the first step, a chi-squared test is used to determine the best predictor (the one with the most significant p value). Second, the sample is partitioned into two or more subsets based on categories of the predictor. Where the dependent variable is categorical, it will compute a Pearson chi-squared test, and where it is continuous, it will compute F tests (Hill & Lewicki, Reference Hill and Lewicki2006). All subsets that are not significantly different are combined. Third, based on the same procedure as the first step, each subset is then partitioned further. This is repeated for each subset until it can no longer be split into significantly significant subsets. The modelling results in a decision tree, where the first tier represents the total database, and the nodes represent the strongest predictors of the dependent variable. The terminal nodes (those that are not separated out further) are the most important as they represent the best classification predictions for the model (SPSS, 2004). An explanation of the CHAID analysis is provided with Figure 1.
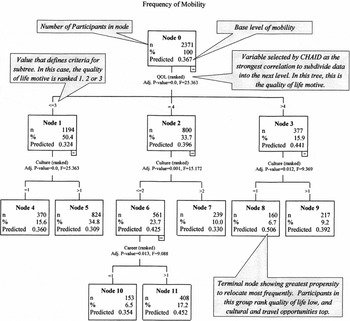
Figure 1 CHAID analysis of predictors for frequency of mobility.
Note: Cross-validation risk estimate = .097 (SE = .006). Frequency of mobility calculation ranges from 0.02 (least restless) to 2.82 (most restless), SD = 0.31. Quality of life, culture and career are ranked from 1 (highest) to 6 (lowest).
One of the advantages of CHAID is that it can detect interactions between nominal, ordinal and continuous variables (Kleppin, Pesch, & Schröder, Reference Kleppin, Pesch and Schröder2008). It is both nonparametric and nonlinear, meaning that missing data are not a problem and that typical assumptions regarding normality and linear relations between variables are neither assumed nor necessary (Horner, Fireman, & Wang, Reference Horner, Fireman and Wang2010). This is important in this instance, as the motive data as originally derived, were ipsitive, and hence non-parametric statistical methods are appropriate. In exploratory research such as this, without specific a priori hypotheses about how the predictor variables are related to each other and to the different mobility patterns, this approach was useful in identifying relationships that might otherwise be missed. CHAID does, however, require a large sample size to work effectively as otherwise the nodes quickly become too small for reliable analysis (Magidson, Reference Magidson and Bagozzi1994; Magidson & Vermunt, Reference Magidson, Vermunt, Weihs and Gaul2005). The bootstrap technique was used to generate standard errors and to assess how well the CHAID tree generalises to a larger sample (van Diepen & Franses, Reference van Diepen and Franses2006).
The CHAID algorithm also calculated a cross-validation risk estimate, or an estimate of how accurately the independent variable predicts the dependent variable. The value, when expressed as a percentage, gives the percentage of wrong predictions. For example, a risk estimate of .086 means that the prediction will be wrong in 8.6% of cases, or correct in 91.4% of cases.
Results
The simple correlations between the motives and the mobility patterns are shown in Table 3. As expected with ipsative measures, there is some correlation between the motives, but none are particularly high. There is also some linkage between all of the motives. The correlations between the mobility patterns show a high correlation (.859) between the level of development of the destination and the cultural distance between the home and host countries. Wealthier countries tend to be more ‘Western’ in cultural values (Hofstede, Reference Hofstede2001; House, Reference House2004), and thus, those who move to more developed countries also tend to be moving to countries with a similar culture to that of New Zealand.
Table 3 Simple Correlations of Motives and Mobility Behaviours
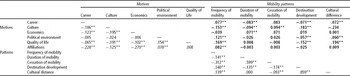
Note: ** Correlation is significant at the 0.001 level or * at the .01 level. Bold type indicates correlations between the motives and the mobility patterns.
More central to this study are the correlations between the motives and the mobility patterns (shown in bold type in Table 3). Statistically, the motives do predict mobility behaviour, but have only moderate correlations. Each motive was also shown to have at least one statistically significant relationship with one mobility pattern. There are no clear signs, therefore, about which motives to carry through to the next round of analysis. Hence, and consistent with the exploratory nature of the research, in the subsequent CHAID analyses, all six motives were entered as potential predictors for each of the five mobility patterns.
CHAID Analyses
Frequency of Mobility
The CHAID tree results for predicting frequency of mobility are shown in Figure 1. This figure has also been used to explain how to read the tree. Node 0 represents the whole sample, before any analyses have been undertaken, and the predictor value shown here (Node 0, predictor = 0.367) represents the base level of the dependent variable, in this case, frequency of mobility. The predictor value for other nodes was compared to this. The tree showed that the best of three statistically significant variables for frequency of mobility was quality of life. This motive splits the respondents into three distinct groups. People who rank quality of life in their top three priorities tend to be move less frequently(Node 1, predictor = 0.324), than those who rank it fourth (Node 2, predictor = 0.396) or those who ranked it fifth or sixth (Node 3, predictor = 0.441).
The second variable shown to predict this pattern is the culture motive. People who rank quality of life as least important, but culture as the most important, displayed the highest frequency of mobility as the predictor value was the greatest of all nodes (Node 8, predictor = 0.506). Finally, and only for those participants who ranked quality of life third, and culture first or second, career becomes a predictor variable. Those who ranked career as the top motive within this group (Node 10, predictor = 0.354) were less mobile than those who did not (Node 11, predictor = 0.452. In short, the more respondents valued quality of life, the less likely they were to display a high frequency of mobility and seek constant change. Motivation to preserve quality of life, therefore, inhibited the frequency of mobility.
Duration of Mobility
The CHAID tree for the pattern duration of mobility is shown in Figure 2. Career and economics are identified as motives which predicted this pattern. People who ranked career as their most or second most important motive are more likely to have spent a greater amount of time abroad (Node 1, predictor = 0.940), than those who ranked career third or lower (Node 2, predictor = 0.899). Economics was not a significant predictor for the first group, but was significant for those who ranked career third or lower. Also from Figure 2, those who ranked the economic motive high, had spent less time abroad (Node 3, predictor = 0.885), than those who ranked it low (Node 4, predictor = 0.924).

Figure 2 CHAID analysis of predictors for duration of mobility.
Note: Cross-validation risk estimate = .033 (SE = .002). Duration of mobility calculation ranges from 0.05 (least time in host countries) to 1.0 (most time in host countries), SD = 0.18. Culture and economics is ranked from 1 (highest) to 6 (lowest).
Cessation of Mobility
There were three tiers of motives that predicted cessation of mobility (Figure 3). These were the motives for cultural and travel opportunities, economics and career. The terminal nodes revealed four clear segments. Those who ranked the cultural and travel opportunities motive top had the highest predictor score at that level and were therefore more established in the current country (Node 1, predictor = 0.785) than those who ranked this motive lower (Node 2, predictor = 0.717). This latter group also had economics as a predictor: those ranking economics first had a lower level of permanence (Node 3, predictor = 0.670) than those who ranked it lower (Node 4, predictor = 0.739). In this latter group, those who ranked the career motive in the top three were more established (Node 5, mean = 0.750) than those who do not (Node 6, mean = 0.663).
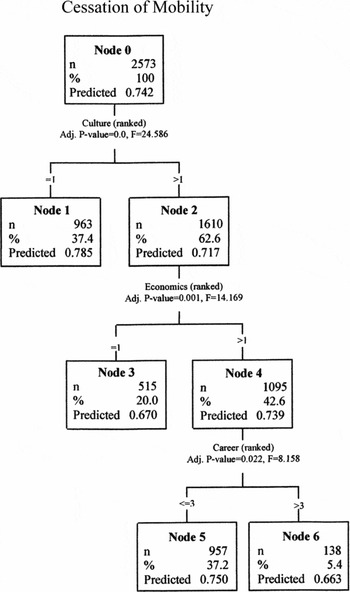
Figure 3 CHAID analysis of predictors for cessation of mobility.
Note: Cross-validation risk estimate = .112 (SE = .003). Cessation of mobility calculation ranges from 0.01 (most settled) to 2.82 (least settled. Culture, economics and career are ranked from 1 (highest) to 6 (lowest).
Destination Development
The CHAID analysis for the development level of the destination showed that the only motive that predicted this pattern was the cultural and travel opportunities motive (Figure 4). The tree showed a negative relationship as the higher the cultural and travel opportunities motive was ranked (Node 1, predictor = −.004), the more likely the respondent was to move to a country less developed and therefore with a lower HDI. Those who were not as motivated by culture (Node 2, predictor = .011) were more likely to relocate to countries with a higher HDI.

Figure 4 CHAID analysis of predictors for destination development.
Note: Cross-validation risk estimate = .006 (SE = .001). Destination development index ranges from −0.631 (least) to 0.639 (most), SD = 0.071. Culture is ranked from 1 (highest) to 6 (lowest).
Cultural Distance
The CHAID analysis for mobility related to the cultural distance between the home and host country shows that the predictor motive that best divided the respondents was career (Figure 5). The split occurred between those whose last move was for career reasons (Node 1, predictor = 4.237) and all the others (Node 2, predictor = 4.531). The culture and travel opportunities motive was not a predictor for the former group, but was a significant predictor for the latter, with those whose last relocation was motivated in this way (Node 3, predictor = 4.585) likely to move to countries with a greater cultural difference than those who moved for other reasons (Node 4, predictor = 4.235). The mobility pattern of moving to countries with a greater cultural difference was therefore not solely predicted by the cultural and travel opportunities motive but most importantly by the career motive. Those who moved for career purposes are more likely to relocate to similar countries than those or for those who moved for other reasons.
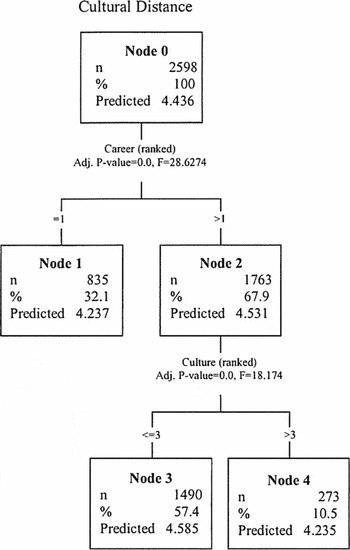
Figure 5 CHAID analysis of predictors for cultural distance.
Note: Cross-validation risk estimate = .017 (SE = .001). Cultural distance index ranges from 1.0 (least cultural distance) to 10.00 (most distance), SD = 1.32. Career and culture are ranked from 1 (highest) to 6 (lowest).
Discussion
In considering these results, we need to bear in mind the special characteristics of participants as New Zealanders. New Zealand is geographically isolated and this causes educated New Zealanders, in particular, to have a high propensity for travelling overseas (Inkson & Myers, Reference Inkson and Myers2003).
Our results show that we were able to identify significant predictors for all variables, including three motives predicting frequency and cessation of mobility, and two each for duration of mobility and cultural difference. Below, we examine each of the mobility patterns and the significance of the linkages between the motives and the mobility patterns.
Frequency of Mobility
The frequency of mobility was positively predicted by the motive of cultural and travel opportunities. However, the quality of life motive had an even more powerful negative influence on the desire for change and the career motive also had a negative influence, suggesting that this behaviour may be curtailed by the way of life and career opportunities that may unfold in a particular national setting. Hence, for New Zealanders, the focus was not so much on consuming new and exciting experiences, but rather on finding suitable employment in a larger economy, where cultural and travel opportunities were more readily available.
Duration of Mobility
Duration of mobility was positively predicted by the career motive, measured as the proportion of time spent away from the home country (New Zealand). However, this behaviour was negatively predicted by the economic motive, suggesting that the decision to relocate was wider than the purely financial. Taken together with the result on the level of development of the destination, this finding suggests that those interested in predicting talent flows between countries should look far beyond conventional economic considerations.
Those who had so far spent relatively little time overseas ranked career low but economics high. It is conceivable that these people obtain high paying contracts in other countries and then return to the home country on completion of these. Travelling mainly for money becomes an essentially extrinsic motive with the real attraction continuing to be home.
Cessation of Mobility
This behaviour was positively predicted by the cultural and travel opportunities and career motives, and negatively by the economic motive. What this may tell us is that people who move to obtain greater cultural and travel opportunities and who find themselves in their new country, will often establish there. For example, a New Zealander who becomes established in Europe may find that there are better cultural and travel opportunities from a European base than from their home base and that career opportunities are similarly greater in larger economic systems such as those of Europe.
A negative relationship between the economic motivation and permanence-seeking is logical. It could be expected that a person who was moving to improve their economic situation and who had already moved at least once for this reason, would be prepared to move again, following the money, with less regard for stability.
Destination Development
While the literature posits developed countries as being more attractive to the internationally mobile because of their greater economic opportunities, neither economics nor career motives differentiated those who travel to developed countries. Those seeking cultural and travel opportunities, however, were less likely to travel to developed countries, indicating a different set of priorities.
Further, for many professionals, there is an expectation of mobility (Ackers & Gill, Reference Ackers and Gill2005; Morano-Foadi, Reference Morano-Foadi2005) and that mobility is to a specific organisation or location. It has been argued that highly educated professionals such as financial workers gravitate towards a central core, such as London or New York (Beaverstock, Reference Beaverstock2002; Straubhaar, Reference Straubhaar2000). Hence, moving to improve an economic situation or advance a career may be directed more to the destination city than to the country. Further research incorporating the exact location of respondents would be required to test this proposition further.
Cultural Difference of Destination
This mobility was also positively predicted by the cultural and travel opportunities motive, but this time the career motive was a more powerful and negative predictor. Those making their careers in mainstream occupations in developed cultures characterised by individualism and low power distance (Hofstede, Reference Hofstede1980; House, Reference House2004) are likely to select destinations which are similar to that of the home country. The fact that the majority of respondents were located in English-speaking countries reinforces this finding.
Conclusions
Implications for the Study of Mobility
This article is exploratory. It investigates possible mobility constructs and the motives that might predict them. In doing so, it addresses the call for actual mobility to be related to the characteristics and motivations of the self-initiated expatriate. The methods used, however, were novel and could be refined and extended.
Sullivan and Baruch (Reference Sullivan and Baruch2009, p. 1561) state that ‘actual physical passages between jobs and organisations can be readily identified and enumerated [but] relatively little research has been devoted to psychological mobility’. Extending this argument to the study of international mobility, we would suggest in contrast that actual physical passages between countries, although they may potentially be identified and enumerated, have not attracted academic attention and have been taken for granted. Those studies that have been conducted have involved mainly corporate expatriates where both the objective and subjective factors involved have been limited by the corporate setting. Our study sought to combine the motivations and the actual mobility and to show how they are related.
In many countries, the media often advances factors such as remuneration, tax policies, standard of living, and poor working environments as motives for the country's loss of professional workers. What our results suggest, however, is that the popular understanding of mobility may sometimes be misplaced. What turns the motivation into physical mobility for many highly educated people is the desire to travel, the wish to experience new cultures, and the prospect of career development.
Limitations
The primary objective underlying the collection of the data we reported on here was to understand more about the relative importance of the different motives for self-initiated mobility. The idea of relating these motives to specific measureable patterns of mobility was developed serendipitously by the authors. Because of this, the operational definitions of our mobility constructs have been developed opportunistically on the basis of what data we had available. We therefore recognise that these constructs are pragmatic, and that a more deliberate consideration of the potential objective measures of mobility behaviour might have yielded more informative data. It is our hope, nevertheless, that our explorations in this area will raise awareness of the potential of objective measures of international mobility behaviour to inform the study of international human resources and their management.
We also need to recognise the limitations imposed by the fact that all the participants in our study are from a specific country — namely New Zealand. This may account, for example, for the salience of the cultural and travel opportunities motive both as the number one motivator for New Zealanders and as the dominant predictive variable for different forms of mobility.
We also need to recognise that country of residence is a very limited proxy for geographical location. In retrospect, more information about the specific location (e.g., city, urban vs. rural) would have been useful, enabling more differentiation regarding centres of excellence. With such data, concepts such as duration of mobility and the development level of the destination could have been refined.
Future Research Possibilities
Our overall approach suggests further extensions in the methodology. For example, other mobility behaviours could also be envisaged, such as the anticipated future location of these people. Could return propensity (an imminent return to the home country) or other current mobility intentions be predicted by motives for previous mobility? Further, is it possible to analyse such data at the level of each move? A longitudinal study could also be revealing. Mobility motivation may change over time, and its impact on mobility patterns could be informative. In our view, what is important in pursuing the direction suggested by our research is ensuring that analysis is conducted at the level of the individual and that this involves both subjective and objective components of mobility.
Implications for Practice
In a global labour market where countries and organisations compete for talent that is often highly mobile, there will be advantages to those organisations that understand the dynamics of workforce mobility. Our results, while exploratory, reveal considerable complexity in the motivations that energise mobile individuals and the patterns of stability and change that they pursue in their careers and lives. Motives such as cultural and travel opportunities, affiliations and quality of life are perhaps insufficiently considered by international organisations either in their expatriation policies (McNulty, De Cieri, & Hutchings, Reference McNulty, De Cieri and Hutchings2009) or their utilisation of local and itinerant staff. It is to be hoped that further pursuit of research that refines our understanding of such phenomena has much to offer both scholarship around mobility and the practical concerns of international human resource management.


