


Introduction
Population health depends on widely defined social determinants beyond those at the individual’s or household’s control (Wilkinson and Marmot, Reference Wilkinson and Marmot2003). Among those social determinants, it is critical to highlight the role of the democratic quality of a country, where democracy is defined as “the continued responsiveness of the government to the preferences of citizens, considered as political equals” (Dahl Reference Dahl1971). Given that essential decisions influencing population health are often made collectively (e.g. health-related environment, compulsory vaccinations, and health care co-payments), one can expect that the “more democratic” a country is, the more it will respond to the preferences of its citizens. Such effect is likely to improve the health of the more deprived individuals who, without government support, are more likely to lack the resources to invest in health by themselves (Marmot Reference Marmot2005). Similarly, democracy might exert a stronger influence on individuals that are in weaker health. Hence, this raises the question of whether democracy reduces health inequality.
One explanation for a reduced inequality under a democracy lies in that the process of health policymaking under democracies makes it more likely for governments to choose health over other policy priorities. However, there are reasons to believe that democratic institutions do not always deliver on their expectations, as citizens might not pay attention to political incumbents, political incumbent only care about the median voter, and do not judge them based on actual policies and outcomes, but through the lens of political loyalties and the spin of their political messages (Achen and Bartels Reference Achen and Bartels2017).
Previous studies have documented that political institutions are important social determinants of health insofar as they hold the decisive “financial, organizational, and policy resources” (Krueger et al. Reference Krueger, Dovel and Denney2015). The adoption of a liberal democracy, a political system that protects and recognizes individuals’ rights and freedoms, where the rule of law limits the exercise of government , has been shown to increase population health (Besley and Kudamatsu Reference Besley and Kudamatsu2006; Batinti et al. Reference Batinti, Costa-Font and Hatton2022), healthy behaviors, and self-assessed health (SAH) (Klomp and de Haan Reference Klomp and de Haan2009). However, we still know little about whether it can influence the priority of programs that aim at reducing disparities in health compared to other public polic goals. Democracies can amplify the voice and the political mobilisation of both neglected populations and individuals with poorer health (e.g. individuals that suffer from chronic conditions or disability).
Similarly, exposure to a democracy can influence the resources devoted to improving health, because compared to other regimes, democracies tend to provide better access to healthcare and prioritize health prevention (Wall Reference Wall1996). However, not all measures of health outcome are sensitive to inception of a democracy. Some studies show that democracy does not always reduce infant and child mortality (Ross Reference Ross2006). So far, very limited research has examined how exposure to democracy affects the distribution of health status in a population, and specifically why health inequalities vary between countries (Ruger and Kim Reference Ruger and Kim2006; WHO 2011). This paper contributes to this endeavor.
A growing literature has documented some of the determinants of health inequality. This includes the role of socioeconomic status (e.g. income, education, and occupation), indicating the way income is distributed, or in the educational attainment of the population can influence the distribution of health outcomes (OECD 2019). However, additionally, there is also evidence of community-level reforms playing a role,Footnote 1 as democracies are more likely to prioritize environmental and social determinants of health. One of the potential explanations for such findings lies in the second order effects of some major institutional changes. For instance, democracies might influence a country’s economic development (Lipset Reference Lipset1959) and in turn reduce health inequality (Costa-Font et al. Reference Costa-Font, Hernández-Quevedo and Sato2018). Exposure to democracy can affect both the distribution of income (Gradstein and Milanovic Reference Gradstein and Milanovic2004) and the average education attainment of a country’s population (Acemoglu et al. Reference Acemoglu, Johnson, Robinson, Aghion and Darlauf2005). Hence, it appears that an important gap in the literature lies in understanding the association between democracy and health inequality.
This paper examines the effect of exposure to democracy (number of years under a democracy) on health inequality using a large sample of 28 European countries built on recent survey data of the European Social Survey (ESS) for all the available waves from 2002 to 2018. We draw on an instrumental variable strategy to examine the effect of democracy on both bivariate (income-related or the concentration index [CI]) and univariate (pure or overall) health inequality.
We contribute to the literature as follows. First, unlike previous literature which relies on either large cross-sectional or small longitudinal data, we examine the effects of democracy on two different measures of health inequality. Hence, we expand the body of research already conducted on the institutional determinants of health inequalities (Costa-Font and Cowell, Reference Costa-Font and Cowell2021). Second, we examine the effect of democracy on health inequality after considering a long list of alternative controls and specifications, including economic development and income inequality. Third, we draw on an instrumental variable approach where we examine the variation in exposure to a democracy resulting from earlier (prior fifteen years) exposure to a democracy, which is similar to the use of waves of democratization instrumental strategy used in the relevant literature (Acemoglu et al. Reference Acemoglu, Johnson, Robinson and Yared2008, Reference Acemoglu, Naidu, Restrepo and Robinson2019). Fourth, given that inequality indices are mainly used to produce a ranking of countries (they have an ordinal interpretation), we examine the robustness of our estimates by estimating ordered probit and an instrumental variable ordered probit (using a control function approach) model specifications. Such approach allows examining the determinants of inequality rankings implicit in the inequality indices, and study the effect of an additional year under a democracy on such cross-country inequality rankings. Finally, we identify several heterogeneities and mechanisms underpinning our estimates, including the effect of democracy on “health poverty,” namely on improving the health of those individuals with poorer health in a population.
The rest of the paper is organized as follows. The next section provides the relevant background and we outline the hypotheses driving the effect of democracy on health inequality. Next, we describe the data and strategy including the variables used. Then a section provides the results. A final section critically discusses the findings and concludes.
Background
Democracy and its influence on the distribution of health
The adoption of a democracy can affect the distribution of health in a society through several channels. In democracies, the implicit re-election incentives brought about by electoral competition are likely to increase the political incumbent’s receptivity to popular demands, especially those of sizable minorities who are more likely to be overlooked otherwise. Similarly, it can be anticipated that policy in democracies will be likely to reflect the preferences and needs of the larger populations, increasing the likelihood of the development of social programs addressing such health needs (Holmberg and Rothstein Reference Holmberg and Rothstein2011). Examples include the inclusion of health prerogatives in different constitutions (Matsuura, Reference Matsuura2015) as well as the promotion and protection of equal rights which are argued to affect the distribution of health status (Mann Reference Mann2005), as well as social values of tolerance and diversisty (Batinti and Costa-Font Reference Batinti and Costa-Font2023). Similarly, a better representation of the poorest members of society in democracies (Mulligan et al. Reference Mulligan, Hunley, Cole and Long2004) is likely to give rise to new health care programs enhancing the safety net of the neediest in society (Acemoglu and Robinson Reference Acemoglu and Robinson2000; Krueger et al. Reference Krueger, Dovel and Denney2015), and consistently, Batinti and Costa-Font (Reference Batinti and Costa-Font2023) document that democracy reduces inequalities in human stature, a retrospective proxy of child health and wellbeing.
Democracies can strengthen the political power of poorer segments of society, which in turn can increase the support for more redistributive programs (Acemoglu et al. Reference Acemoglu, Naidu, Restrepo and Robinson2013). Acemoglu and Robinson (Reference Acemoglu and Robinson2005) refer to the process of political selection, whereby democracies have more transparent mechanisms to select competent and honest executives, which in turn, can be conducive to more efficient health policies. Some evidence documents that democracies increase a nation’s likelihood of achieving universal healthcare access (Oswald Reference Oswald2013). The prioritization of public health and universal access to healthcare, can impact the distribution of health outcomes, and health inequality (Besley and Kudamatsu Reference Besley and Kudamatsu2006; Batinti et al. Reference Batinti, Costa-Font and Hatton2022; Batinti and Costa-Font Reference Batinti and Costa-Font2023). Finally, exposure to democracy might in some cases make people more tolerant which in turn can make society more stable and improve people’s mental health.
Health Inequality Trap
Nonetheless, democracies may also give rise to a “health-inequality trap,” wherein democratic decisions fall short of adequately addressing the needs of minorities which are instead seized by powerful elites (Powell-Jackson et al. Reference Powell-Jackson, Basu, Balabanova, McKee and Stuckler2011). In less socially cohesive societies, the “median voter” may not be interested in policies that address the health risks that minorities face, which can result in growing (or at the very least stagnating) health disparities (Powel-Jackson et al. Reference Powell-Jackson, Basu, Balabanova, McKee and Stuckler2011). Furthermore, the government might be less redistributive if the elites, for instance, are successful in seizing the political will of the middle class (Acemoglu and Robinson Reference Acemoglu and Robinson2005). Furthermore, democratic societies may engage in corruption or nepotism, which may not necessarily benefit the most vulnerable (Krueger et al. Reference Krueger, Dovel and Denney2015). Captured democracies might end up serving multiple powerful interests instead of the needs of the citizenry (Schevem and Stasavage Reference Scheve and Stasavage2017).
Finally, democracies might engender some forms of fiscal redistribution, and in fact, the anticipation of redistribution has been one of the driving forces for the opposition to democracy (Guttsman Reference Guttsman1967). Hence, one would expect to find an association between health programs (designed to reduce inequality by improving the health of certain segments of the population), and the democratic development of a country. However, redistribution might not always manage to alter other health determinants such as education (health knowledge) and income (influencing access to healthcare). With these arguments in mind, and considering that the effects of different pathways might be country-specific, it is an empirical question not just whether consistently with Krueger et al. (Reference Krueger, Dovel and Denney2015) democracy and the political organisation of countries improve health, but whether it does indeed reduce health inequality.
Data
The European Social Survey
We draw upon data from all available waves of the European Social Survey (ESS) between 2002 and 2018. The ESS is a cross-national survey conducted in Europe biannually since 2002. The survey is carried out in up to 32 countries with newly selected cross-sectional samples (see Supplementary Material A Table A1 for an overview of the data availability by country). The data on some of the control variables for the regression model and on democracy, accession, and institutional characteristics have been gathered from different sources such as World Bank data and Polity IV (see Supplementary Material A Table A1).
Health inequality measures
Unlike other measures of wellbeing, health cannot be assumed to be directly and unambiguously observable. It is measured indirectly using indicators ranging from more objective ones such as mortality or diagnosed conditions to more subjective measures such as symptoms, conditions, or SAH (O’Donnell Reference O’Donnell2009). This paper uses SAH because of two reasons. First, SAH highly correlates with objective measures of health and is thus a good estimate of an individual’s health (Bound Reference Bound1991; Doiron et al. Reference Doiron, Fiebig, Johar and Suziedelyte2015 or Wu et al. Reference Wu, Wang, Zhao, Ma, Wu, Yan and He2013). Secondly, as SAH is relatively easy to gather, widely available and commonly used, using it ensures that the outcomes of this paper are comparable, valid, and repeatable.
Deriving measures of inequality from individual health is another controversial step. There are numerous measures of health inequality based on different assumptions and facing different theoretical restrictions. Health inequalities can “refer to the total variation in health in a population, or to that part of the variation that is systematically related to socioeconomic status” (O’Donnell Reference O’Donnell2009).
Bivariate (income-related) health inequality
Public health researchers mostly use range measures such as relative risk or odds ratio to explore status-related health inequalities (Wagstaff et al. Reference Wagstaff, Paci and Van Doorslaer1991). In the field of health economics, an alternative measure has been established and used extensively – the CI (Wagstaff and Doorslaer Reference Wagstaff and Doorslaer2004). This index has specific advantages as it “simultaneously captures the socioeconomic dimension of inequality, reflects the experiences of the entire population and is sensitive to changes in the distribution of the population across socioeconomic groups” (Wagstaff et al. Reference Wagstaff, Paci and Van Doorslaer1991). The CI is derived by the concentration curve (CC), which plots the cumulative proportion of health (horizontal axis) against the cumulative proportion of the population ranked by income (vertical axis) (O’Donnell Reference O’Donnell2009; Costa-Font and Hernández-Quevedo Reference Costa-Font and Hernández-Quevedo2012).
In calculating the CI, we estimate the following:
 $$C(h|y) = {{2CO\upsilon ({h_i},{R_i})} \over {\bar h}} = {1 \over n}\sum\limits_{i = 1}^n {\left[ {{{{h_i}} \over {\bar h}}(2{R_i} - 1)} \right]} .$$
where h
i
is the health variable in which inequality is measured (here SAH) and ¯ on top of the variable refer to its average value, and Ri
measures the ranking of an individuals based on their income (y). C ranges from ${{1 - n} \over n}$
(maximal pro-poor inequality, e.g. health is concentrated on the poorest individual) to
${{1 - n} \over n}$
(maximal pro-poor inequality, e.g. health is concentrated on the poorest individual) to ${{n - 1} \over n}$
(maximal pro-rich inequality) – for example, the index ranges from −1 to 1 with a positive value representing inequality favoring the better-off.Footnote
2
As income is only gathered in form of a categorical variable in the ESS, we conduct a linear prediction of the values based on an interval regression with the bounds of the categorical income variable, controlling for gender, age, employment status, occupation, and education (see Supplementary Material Table A3).
${{n - 1} \over n}$
(maximal pro-rich inequality) – for example, the index ranges from −1 to 1 with a positive value representing inequality favoring the better-off.Footnote
2
As income is only gathered in form of a categorical variable in the ESS, we conduct a linear prediction of the values based on an interval regression with the bounds of the categorical income variable, controlling for gender, age, employment status, occupation, and education (see Supplementary Material Table A3).
Univariate health inequality
The choice of income rank as a status variable in measuring inequality is not uncontroversial, which is why the CI is complemented by a less restrictive approach that deals with categorical data, and measures inequality based on an individual’s position in the distribution of health outcomes, rather then their position based on their income as the CI does. Another advantage of univariate inequality measures is that it avoids normative claims about what kind of inequalities are (il)legitimate. The Cowell and Flachaire (Reference Cowell and Flachaire2017) approach provides a robust method to measure inequalities in health status, circumventing the problems of arbitrary cardinalization. The approach separates out the two tricky components of the inequality measurement – the equilisand and the aggregation method (Costa Font and Cowell Reference Costa Font and Cowell2016, Costa-Font and Cowell Reference Costa-Font and Cowell2022, 9). For an equilisand where the information is purely categorical (such as SAH), we only know how many people are in each category k = 1, 2, … K. As we know that these categories can at least be ordered by increasing desirability, it can be shown that if there are n
k
persons in category k= 1, 2, … K, the status of person i who is currently in category k(i) must be a function of either $\mathop \sum \limits_{l = 1}^{k\left( i \right)} {n_l}$
(“downward-looking” concept) or
$\mathop \sum \limits_{l = 1}^{k\left( i \right)} {n_l}$
(“downward-looking” concept) or $\mathop \sum \limits_{l = k\left( i \right)}^K {n_l}$
(“upward-looking” concept) (ibid.: 10). If we normalize for the size of the total population, the “downward-looking” concept is defined by:
$\mathop \sum \limits_{l = k\left( i \right)}^K {n_l}$
(“upward-looking” concept) (ibid.: 10). If we normalize for the size of the total population, the “downward-looking” concept is defined by:
 $${s_i} = {1 \over n}\sum\limits_{l = 1}^{k(i)} {{n_l}} $$
And the “upward-looking” one is defined by:
 $${s'_i} = {1 \over n}\sum\limits_{l = k(i)}^K {{n_l}} ;$$
For both s lies between 0 and 1. If everyone is in the same category, that is, perfect equality, both (2) and (3) equal 1. This maximum status value serves as a reference point.
The inequality measurement problem then comes down to the aggregation of the information in the vector s := (s 1, s 2, …, s n ) in relation to the equality vector (1, 1,…, 1). Following a small set of elementary axioms, inequality takes the form of an index in the following family, indexed by α:
 $${I_\alpha }({\rm{S}}) = \left\{ {\matrix{ {{1 \over {\alpha (\alpha - 1)}}\left[ {{1 \over n}\sum\nolimits_{i = 1}^n {S_i^\alpha - 1} } \right],{\rm{if}}\;\alpha \ne {\rm{0}},} \hfill \cr { - {1 \over n}\sum\nolimits_{i = 1}^n {\log {s_i},} \;\quad \quad \quad \;\;{\rm{if}}\;\alpha {\rm{ = 0}}.} \hfill \cr } } \right.$$
with α < 1 as a parameter providing the desired sensitivity of the index to a particular part of the distribution – for low values of α the index is particularly sensitive to values of s i close to 0, for example, the index is particularly sensitive to inequality. Thus, in this paper, we draw on evidence from a family of indices suitable for an international health inequality comparison. More specifically, we calculate downward-looking status and upward-looking status fixing α to the value of 0.
Democracy measures
To define a what a democracy is, we follow the Polity IV project. Polity IV is a multidimensional measure of democracy, and considers a number of dimensions that are scored and weighted. More specifically, it evaluates some desirable properties that democratic governments ought to exhibit (e.g., universal franchise, lack of repression etc), contrasting democratic and autocratic institutions. Although, there are other available measures of democracy, Polity IV is the most commonly used measure from which we can compute unambiguously and consistently over time.
Democracy is defined with regard to three essential components. First, the existence of institutions and procedures through which citizens can express their preferences about policies and leaders. Second, the executive power needs to be institutionally constrained by parliament. Third, civil liberties must be guaranteed for all citizens (Norris Reference Norris2012). This gives rise to a spectrum of governing authority ranging from fully institutionalized autocracies over mixed/incoherent regimes to fully institutionalized democracies. The derived “Polity Score” ranges from −10 (hereditary monarchy) to +10 (consolidated democracy). We follow the proposed regime categorization of Polity IV and define a country as a democracy if its score ranges from 6 to 10 in a specific year (Center for Systemic Peace 2016).
The purpose of this study is to examine the relationship between democracy and health inequalities. However, the effect of exposure to a democracy is unlikely to change health status immediately, for example, the Polity Score of a specific year is not sufficient to change the distribution of health status in the same year. Hence, we need to take a broad perspective, that considers the democracy builds up over time in the form of “democratic capital”, or the historical exposure to a democracy (Persson and Tabellini, Reference Persson and Tabellini2009). We account for this consideration by using “exposure to a Democracy,” for example, the number of years a country is categorized as a democracy in the Polity IV dataset.Footnote 3 Finally, it is worth mentioning that the choice of the index is explained by the availability of data for the period of this study (Europe 2002–2018), and the overall stable correlation (0.91) with alternative indices such as Vdem (Vaccaro Reference Vaccaro2021).
Empirical strategy
Baseline specification
Our empirical strategy aims at estimating the effect of democracy exposure on different univariate and bivariate health inequality measures. The difference between univariate and bivariate is important because bivariate inequality is typically more restricted and linked to some socioeconomic status measure. Given that inequality indices often do not have a cardinal interpretation, we investigate the variation of the respective rankings. More specifically, we estimate the following specification where c refers to a country and t refers to time effects:
 $$H{I_{ct}} = {\theta _{ct}} + \beta {D_{ct}} + \gamma {X_{ct}} + {\alpha _t} + {\varepsilon _{ct}}$$
Accordingly, $\beta $
reports the effect of an additional year in a democracy on health inequality measure. Xct refers to several control variables, including the share of the elderly populationFootnote
4
and gender composition of the population, a country’s gross domestic product (GDP) which captures country specific income effects , and the square of GDP to control for potential nonlinear (quadratic) effect of GDP on health. That is, for instance, initially health might grow with income but at some point, there might be diminishing returns to additional income. Furthermore, we include time effects (
$\beta $
reports the effect of an additional year in a democracy on health inequality measure. Xct refers to several control variables, including the share of the elderly populationFootnote
4
and gender composition of the population, a country’s gross domestic product (GDP) which captures country specific income effects , and the square of GDP to control for potential nonlinear (quadratic) effect of GDP on health. That is, for instance, initially health might grow with income but at some point, there might be diminishing returns to additional income. Furthermore, we include time effects ( ${\alpha _t})$
to consider some time specific effects.
${\alpha _t})$
to consider some time specific effects.
Some specifications include region-specific fixed effects (Southern Europe, Central Europe, Eastern Europe, and Northern Europe) rather than country fixed effects as they reduce the sample to the point that limits the precision of our estimates. Indeed, as discussed in Acemoglu et al. (Reference Acemoglu, Johnson, Robinson and Yared2008), while fixed effects estimates can control for time-invariant effects, they do not necessarily estimate the causal effect of income on democracy. Estimates are clustered at the country level and given that our interest is in the inequality order of countries, the regression is estimated in the first instance by ordinary least squares (OLS), and in the robustness checks we report the estimates using an ordered probit. Ordered probit model are used to account for the fact that inequality indices do not have a natural cardinal interpretation. Instead, they are typically employed to compare different countries on some inequality dimensions, such as income, wealth or, in our study, health status.
The effect of democracy: instrumental variable strategy
Given that the association between exposure to democracy and health inequality is affected by different types of endogeneity we use an instrumental variable starategy. Indeed, the effect of a democracy can be biased by measurement error and by potential confounders, and even in its extreme form by reverse causality (e.g. if health inequality endangers the stability of democracies). Following Barro (Reference Barro1999) we use past democratic exposure as an instrument. Our interpretation is that consistent with the previous literature, democracy influences health inequality via earlier improvements in democracy exposure. The intuition behind this instrument is that countries leverage their democratic capital, which is built over time as discussed by Barro (Reference Barro1999).Footnote 5 More specifically, we use a measure of democracy 15 years earlier insofar as democracy exposure is a stock variable (a measure of democratic capital). That is, once a country stays as a democracy for some time, it creates the institutions that embed the country into a democratic system, That is, it creates the incentives and constraints to keep democracy running.
Our instrument is relevant and as we discuss later, and it does meet both the monotonicity and exclusion restriction assumptions. Monotonicity can be tested by examining the sign of the effect of the instrument (lagged democratic capital) on current exposure to democracy, which is always positive, namely we do not observe noncompliers in Europe. Furthermore, the exclusion restriction requires our measure of democracy status 15 years earlier to influence health inequality via direct and feedback effects. Such effects are reflective of the waves of democratization as discussed in other studies (Acemoglu et al. Reference Acemoglu, Johnson, Robinson and Yared2008). That is, older democracies are more likely to exhibit a higher exposure to democracy 15 years before the reference year.
Our estimates reveal qualitatively similar coefficients when examining different subsamples, especially when we control for some of the potential alternative pathways such as aggregate institutional performance measures from the Worldwide Governance Indicators (Kaufmann Reference Kaufmann2007), including h(igher) GDP per capita, education attainment, and potential changes in the age composition of the population. However, we still report least square (OLS) estimates for comparison. More formally, our measure of “exposure to democracy” or democratic capital is a stock variable that expands over time as reflected by the following equations:
 $${D_{ct}} = \;{\sigma _{ct}} + \;\delta {D_{ct - 15}} + \;\varphi {Z_{ct}} + \;{\pi _t}\; + \;{\mu _{ct}}$$
where ${Z_{ct}}$
measures controls that influence democratic exposure and the relevant coefficient
${Z_{ct}}$
measures controls that influence democratic exposure and the relevant coefficient $\delta $
is the instrument, alongside time trends
$\delta $
is the instrument, alongside time trends ${\pi _t}\;$
and an error term
${\pi _t}\;$
and an error term ${\mu _{ct}}$
. The latter estimates the first-stage regression and the equation of interest as follows:
${\mu _{ct}}$
. The latter estimates the first-stage regression and the equation of interest as follows:
 $$H{I_{ct}} = {\theta _{ct}} + \beta {\widehat D_{ct}} + \gamma {X_{ct}} + {\alpha _t} + {\varepsilon _{ct}}$$
The relevant coefficient that we focus on is the coefficient $\beta $
, which measures how a change in democratic exposure affects health inequality.Footnote
6
The regression includes several basic controls (
$\beta $
, which measures how a change in democratic exposure affects health inequality.Footnote
6
The regression includes several basic controls ( ${X_{ct}})$
including the share of the elderly and gender composition of the population as defined by Table 1 as well as time effects
${X_{ct}})$
including the share of the elderly and gender composition of the population as defined by Table 1 as well as time effects ${\alpha _t}$
and an error term. In all specifications, we cluster at the country level as it is the level driving the variation in democracy exposure. However, we consider both partial control that include aggregate measures of institutional performance (Kaufmann Reference Kaufmann2007), and the full list of controls include measures of economic performance such as per capital GDP and GINI indexes.
${\alpha _t}$
and an error term. In all specifications, we cluster at the country level as it is the level driving the variation in democracy exposure. However, we consider both partial control that include aggregate measures of institutional performance (Kaufmann Reference Kaufmann2007), and the full list of controls include measures of economic performance such as per capital GDP and GINI indexes.
Descriptive statistics
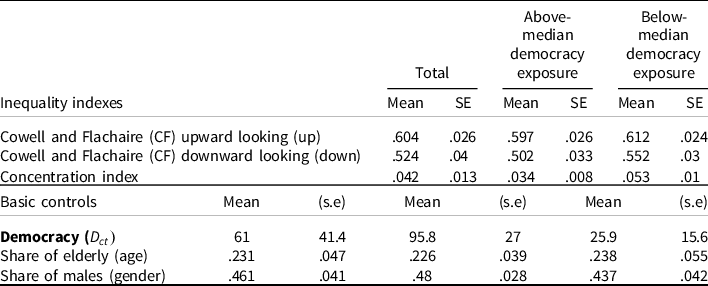
Note: This table provides the means and standard errors of both the dependent and independent variables employed in the analysis, and more specifically, inequality indexes (Cowell up, Cowell down, and concentration index), a measure of exposure to a democracy as well as a number of control variables defining the composition of the population (share of male and elderly), gross domestic product (GDP), and gross domestic product squared (GDP2).
Source: own depiction, European Social Survey 2002–2018, World Bank, Polity IV.
Finally, we have considered time-invariant fixed effects specification to examine how cross-country changes in democracy impact on health inequality. However, given that the variation in democracy in time is limited, and more specifically the inclusion of fixed effects draws on a few countries where there is intra-country variation in democracy, we report the estimates without fixed effects.
Inequality rankings: ordered probit and IV-ordered probit
Given that inequality indices have a limited cardinal interpretation, and are mainly used to compare country distributions of relevant outcomes, we proceed to transform our country-specific estimates into a country’s inequality ranking. This allows estimating ordered probit specifications as in (5). However, instrumental variables estimates are biased given the nonlinearity of their coefficients. Hence, we follow a control function using the same instrument using a residual inclusion approach where standard errors are bootstrapped (Wooldridge Reference Wooldridge2010).
Trends and descriptive analysis
To analyze whether the different measures produce different inequality rankings, Fig. 1 depicts the mean inequality and its variation in each country over time. Almost every measure produces a significantly different ranking. Comparing the different rankings depending on the inequality measure employed, namely CF (Cowell Flachaire) index (both upwards or CF-UP, and downwards or CF-down) and the concentration index (CI), we observe a large difference for the United Kingdom (UK) and Russia , which exhibit a switch in their relative positions – as highlighted in Fig. 1 in red (-) and green (x) (see also B1 in the Appendix). These outcomes illustrate the importance of the assumptions and limits of the measure used. Thus, ranking health systems based on a single inequality measure (see e.g. WHO 2000) becomes at least controversial in the light of these findings (Costa Font and Cowell Reference Costa Font and Cowell2016). Nevertheless, the different measures and the resulting rankings are all positively correlated (see Supplementary Material B2). Table A2 in Supplementary Material A reports the variation of health inequality over time. Although we document a small variation in health inequality, we find that irrespective of the index of inequality examined, there is an increase in inequality until 2010 after which we observe a reduction. Interestingly, we find that average self reported health exhibits the same trend as inequality trajectories.
Average univariate and bivariate inequality by country (lines depicting the deviation over time).
Note: The average values of the univariate inequality indexes, specifically the Cowell–Flachaire up (CF-up) and Cowell–Flachaire down (CF-down), and the bivariate inequality measured by the concentration index (CI) for each country between 2002 and 2018 are depicted. The ranking is compiled using the averages. The Russian Federation and UK are highlighted as examples how relative positions change depending on the measure applies.
Source: Own depiction, Data: European Social Survey 2002–2018.
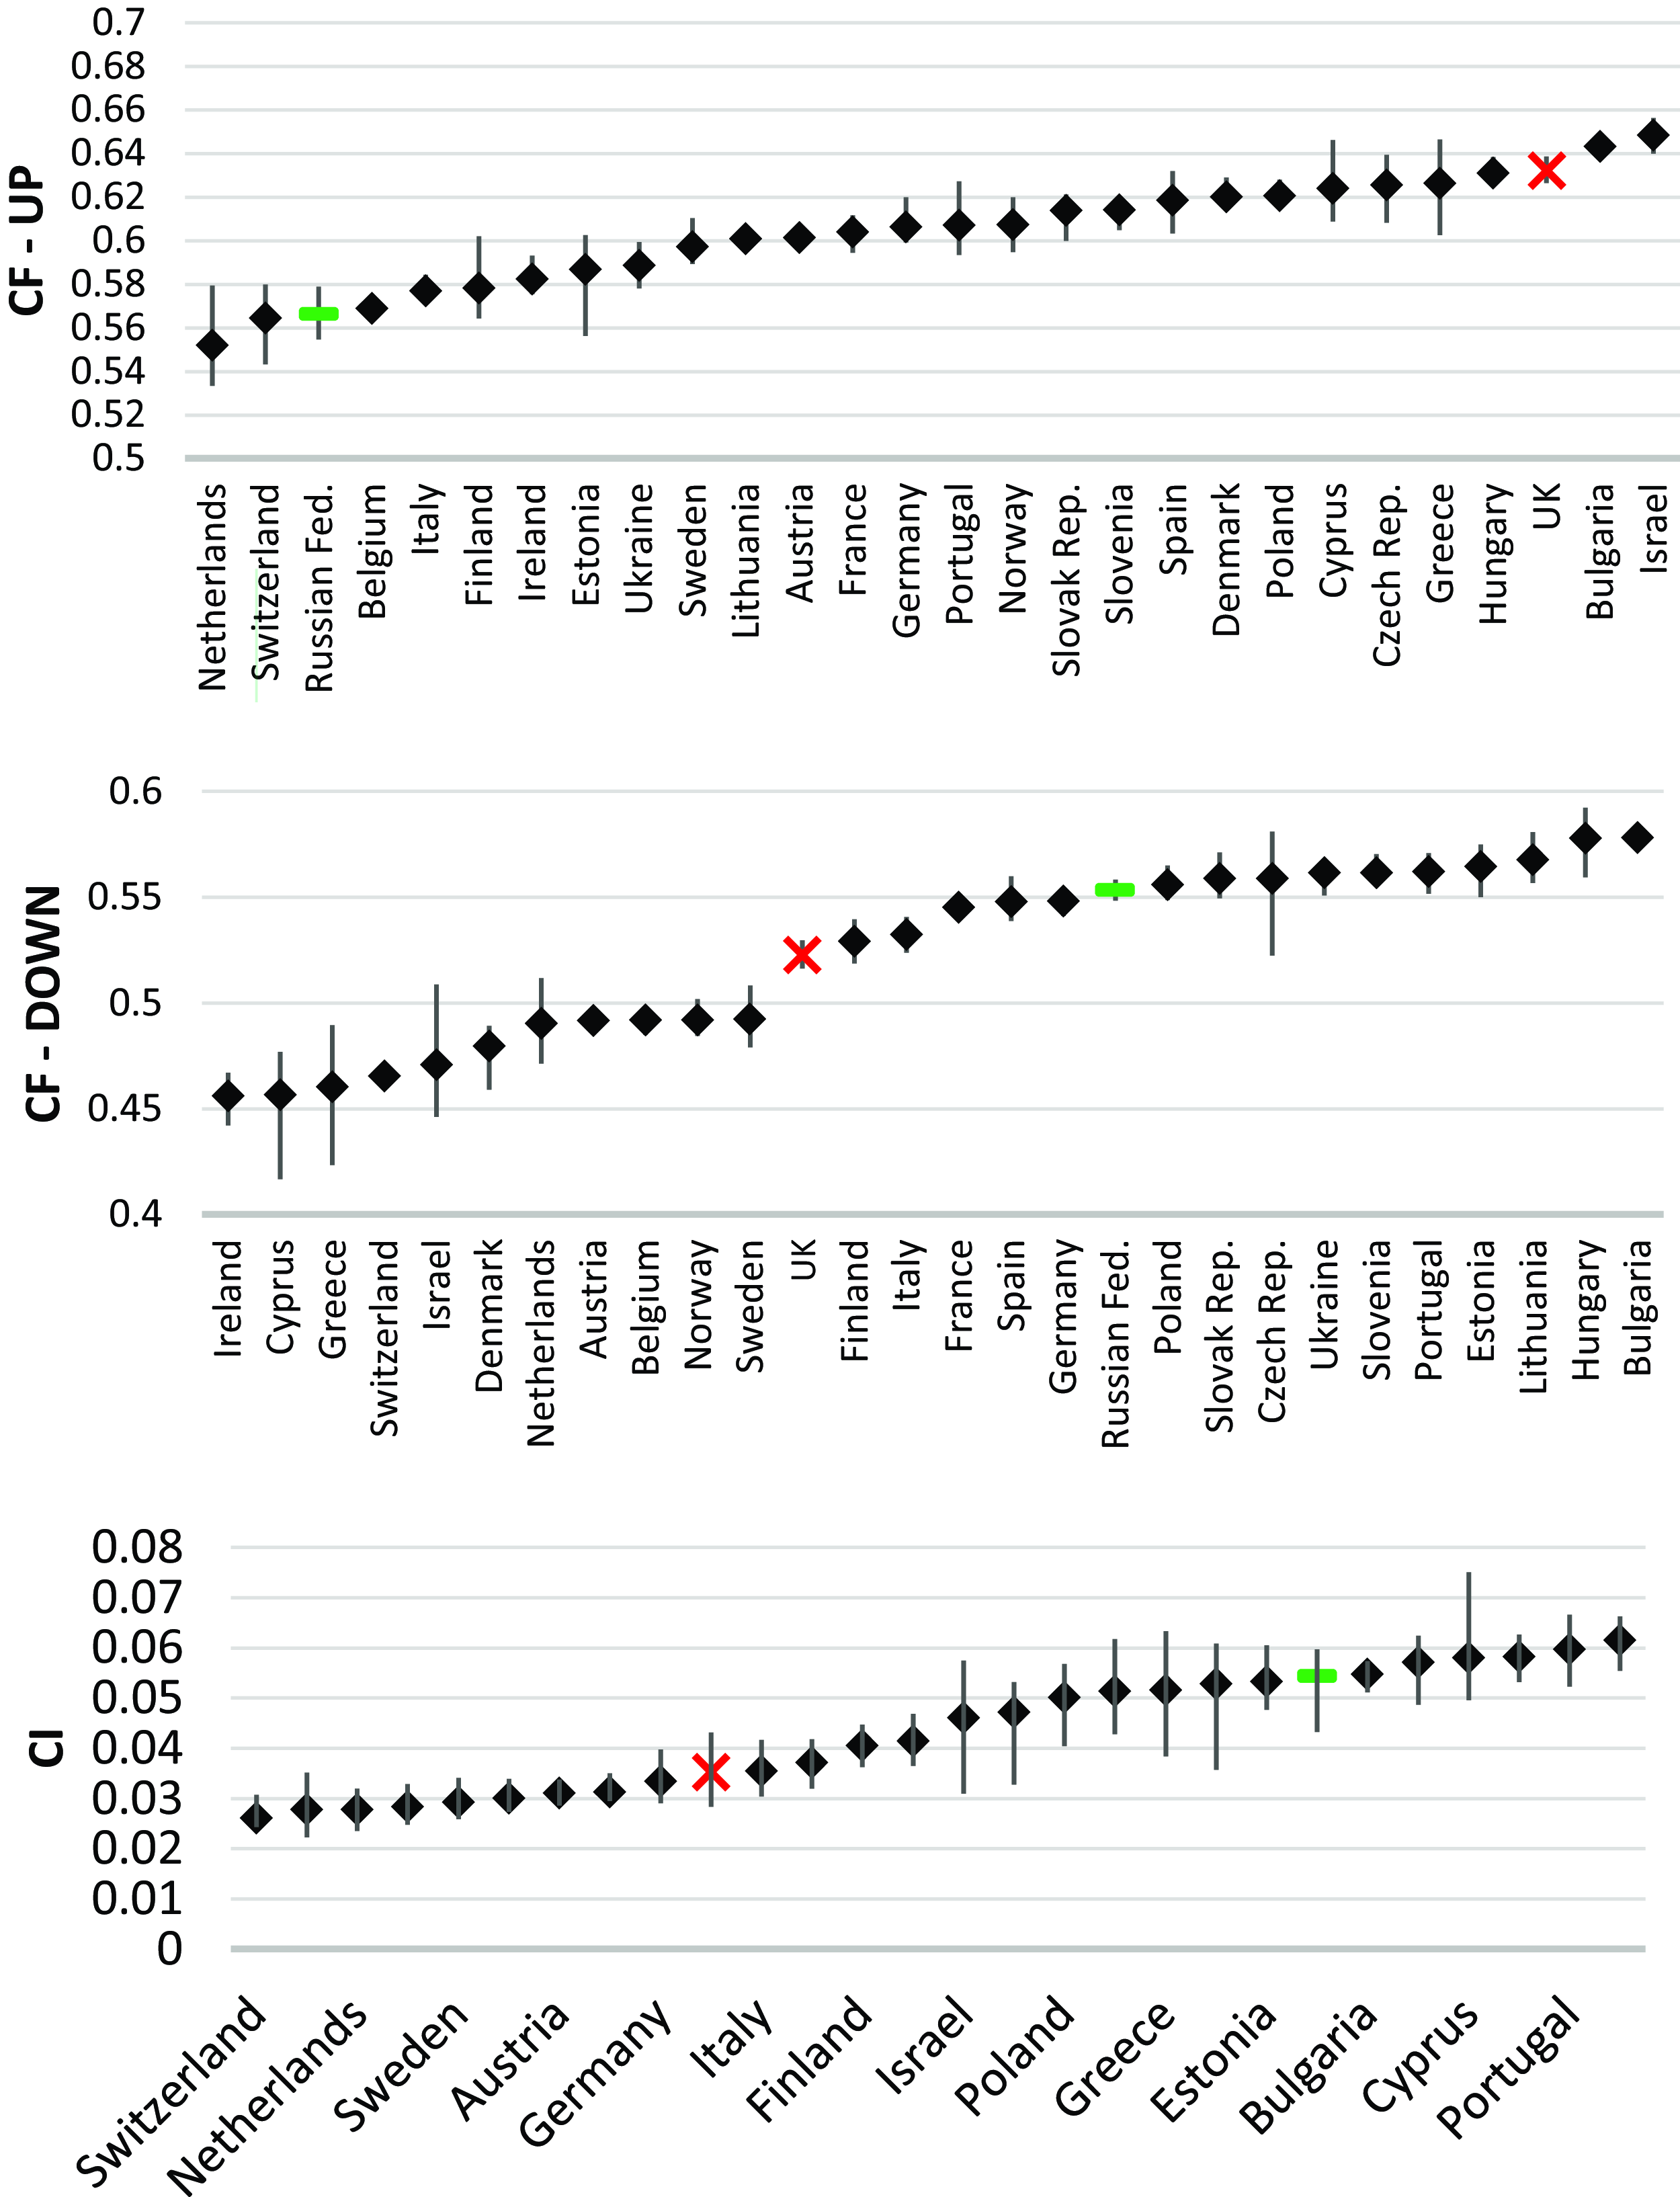
Table 1 displays a statistical summary of both the dependent and some basic control variables available in the analysis. It reports the means and standard errors of the variables used in our analysis for the entire sample, as well as the countries above (and below) then median years in a democracy. As expected countries below the median sample of the democracy index exhibit higher health inequality irrespective of the measure of inequality employed. On average, countries in our sample have been exposed to 60 years of democracy, though the variation is large and ranges from 96 years in the above-median countries to merely 26 in the sample of below-median democracy exposure. Our data considers several controls such as average health, education attainment, share of elderly, gender composition, and population size that are well-known health production drivers. In addition, we include a country’s GDP, its income inequality index, and a composite measure of governance retrieved from the Worldwide Governance Indicators in 2022.
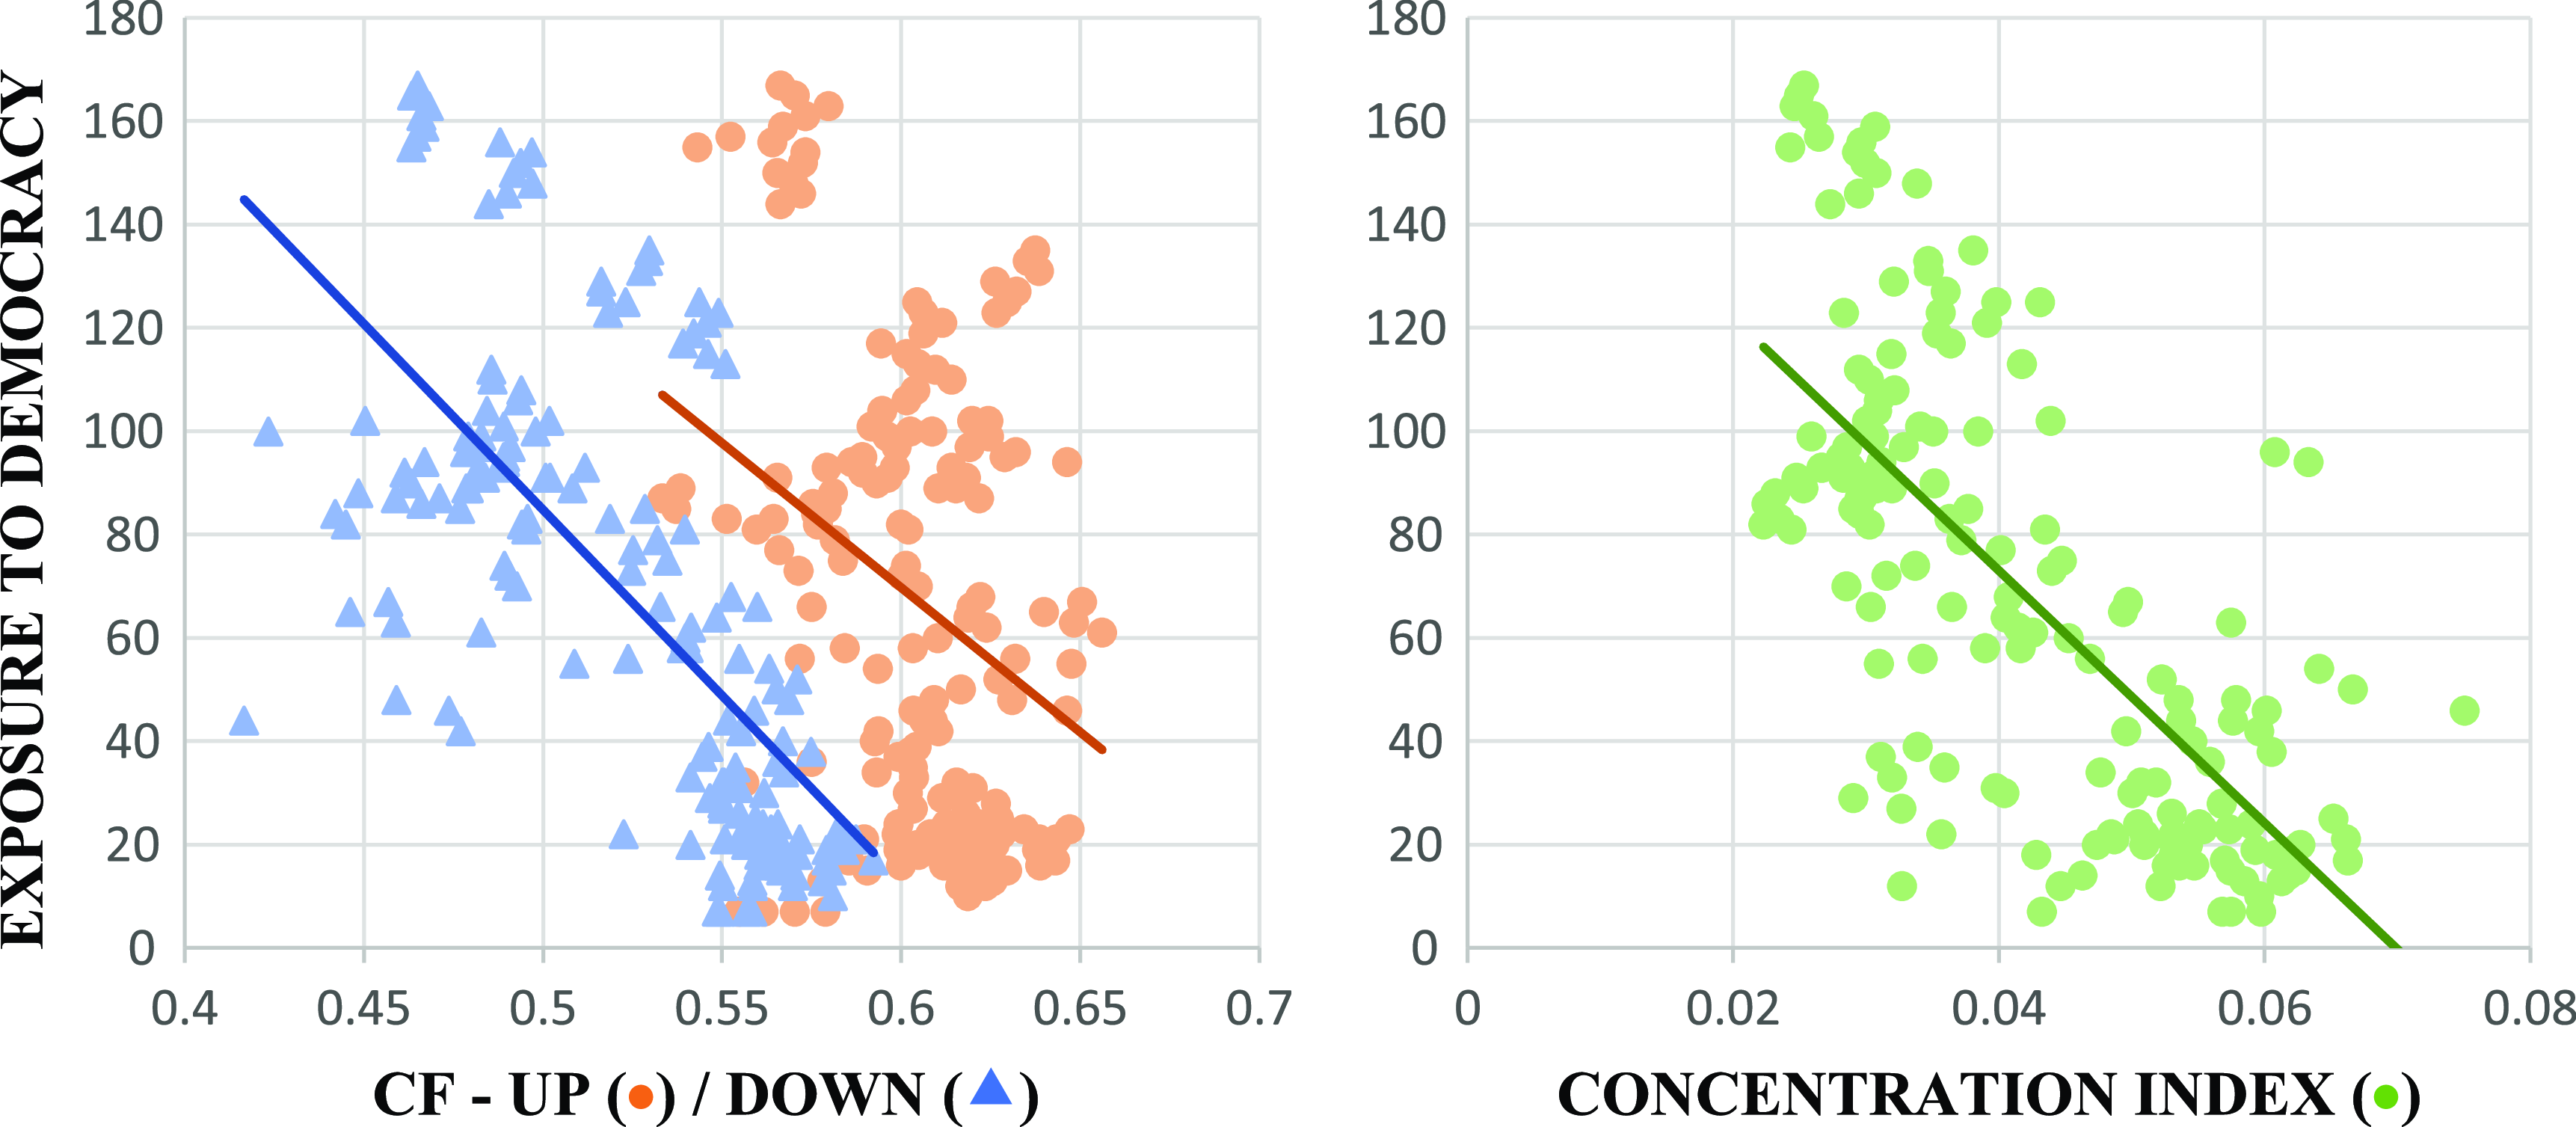
Figure 2 depicts the results of a pairwise correlation of all three measures of inequality and exposure to a democracy. The figure documents that the longer a country has been a democracy, the lower their health inequality is, irrespective of the (bivariate or univariate) measure of inequality employed.
Univariate (CF) and bivariate (concentration index) inequality and exposure to democracy.
Note: The horizontal axis is depicting the respective inequality measure. On the left chart, Cowell–Flachaire (CF) up (![]() ) and Cowell–Flachaire down (
) and Cowell–Flachaire down (![]() ) are mapped, and on the right chart the concentration index (
) are mapped, and on the right chart the concentration index (![]() ) is mapped. The vertical axis in both charts depicts time being a democracy. The influence of more years being a democracy on the level of health inequalities is clearly observable. All regressions show that more years being a democracy led to lower measures of all inequality indices.
) is mapped. The vertical axis in both charts depicts time being a democracy. The influence of more years being a democracy on the level of health inequalities is clearly observable. All regressions show that more years being a democracy led to lower measures of all inequality indices.
Source: Own depiction, European Social Survey (2002–2018) estimates, Polity IV.
Results
Democracy and health inequality
Table 2 reports the estimates of both ordinary least squares (OLS) and instrumental variables regressions using past democracy as an instrument (Acemoglu et al. Reference Acemoglu, Johnson, Robinson and Yared2008), on a bivariate measure of inequality, namely the CI. Table 2 reports the effect of an additional year under a democracy, the measures of exposure to a democracy used in this study. The first panel (estimates 1–3) reports the effects of democracy exposure estimated by OLS, and the second panel employs an instrumental variable approach (4–6) using lagged democracy as an instrument. Table A4 in the supplementary material reports the estimates of the first stage. As expected, we find that democracy reduces the CI of health irrespective of the inclusion of controls. However, the inclusion of potentially endogenous controls such as income inequality does reduce the precision of the estimate. We conclude that an additional year under a democracy reduces bivariate health inequality. Instrumental variable estimates are both statistically valid and exhibit F tests that are well over the expected cutoff of 10, which suggests that our estimates do not seem to be weak instruments, consistently with the literature (Acemoglu et al. Reference Acemoglu, Johnson, Robinson and Yared2008). Comparing the coefficients, we find that the estimates are equally precisely estimated. Looking at the effects of other relevant variables, we continue to find that the share of the elderly population increases health inequality irrespective of the inequality index employed.
Democracy ( ${D_{ct}})\;$
effect on bivariate health inequality (concentration index) OLS and IV estimates
${D_{ct}})\;$
effect on bivariate health inequality (concentration index) OLS and IV estimates
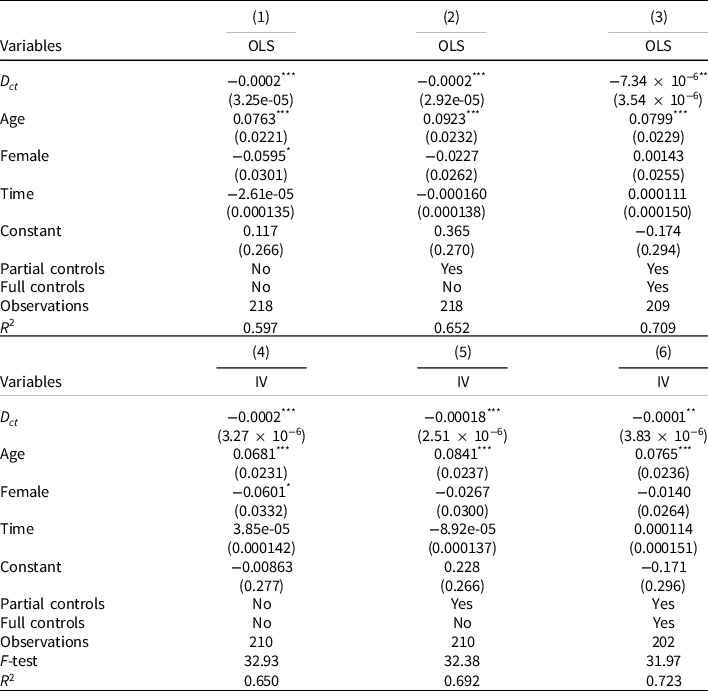
Note: This table reports the estimates of an OLS and an instrumental variable (IV) regression of the effect of democracy exposure on bivariate health inequality (concentration index). Partial controls include institutional performance measures from the Worldwide Governance Indicators in 2022 and full controls include the GINI of income, gross domestic product (GDP), and gross domestic product squared (GDP2). The specification of robust standard errors is in parentheses.
***p < 0.01, ** p < 0.05, * p < 0.1.
Source: Own calculations, European Social Survey 2002–2018 estimated, World Bank, Polity IV.
Democracy and univariate health inequality
We now estimate how democracy affects cross-country univariate health disparities. The OLS and IV estimates of the impact of exposure to democracy on health inequality are reported in Tables 3 and 4. Table 4 shows the impact of democracy exposure on upward-looking measures of inequality, while Table 3 shows the impact of downward-looking measures. Table 3 provides evidence that democracy reduces health inequality in downward-looking status measures in line with bivariate measures, and Table 2 provides evidence in line with bivariate measures though the precision of the estimate declines after the inclusion of a full set of controls, such as GDP per capita and income inequality. Consistently, Table 4 documents a similar reduction in univariate health inequality, though our estimates are sensitive to the inclusion of controls and become less precise.Footnote 7 Estimates point to a definite decline in health inequality with exposure to democracy, which is more pronounced when we look at the impact on measures of higher social status. However, as covariates are included, the estimates’ precision decreases. Tables A6–A11 in the supplementary material contains estimates that include a complete set of controls.
Democracy ( ${D_{ct}})\;$
effect on univariate health inequality (Cowell down index) OLS and IV estimates
${D_{ct}})\;$
effect on univariate health inequality (Cowell down index) OLS and IV estimates
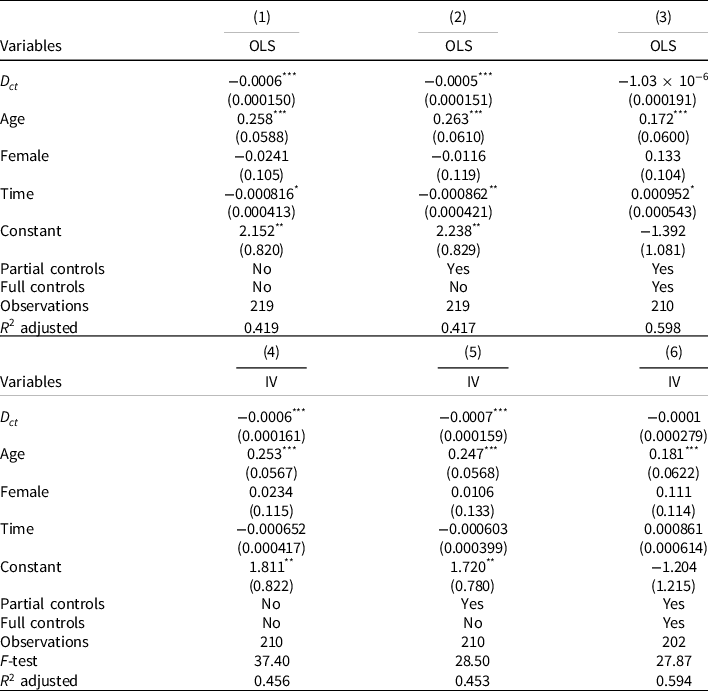
Note: This table reports the estimates of an OLS and an instrumental variable (IV) regression of the effect of democracy exposure on univariate health inequality (Cowell down). Partial controls include institutional performance measures from the Worldwide Governance Indicators in 2022 and full controls include the GINI of income, gross domestic product (GDP), and gross domestic product squared (GDP2). The specification of robust standard errors is in parentheses.
***p < 0.01, ** p < 0.05, * p < 0.1.
Source: Own calculations, European Social Survey 2002–2018 estimated, World Bank, Polity IV.
Democracy ( ${D_{ct}})\;$
effect on health inequality (Cowell up index) OLS and IV estimates
${D_{ct}})\;$
effect on health inequality (Cowell up index) OLS and IV estimates
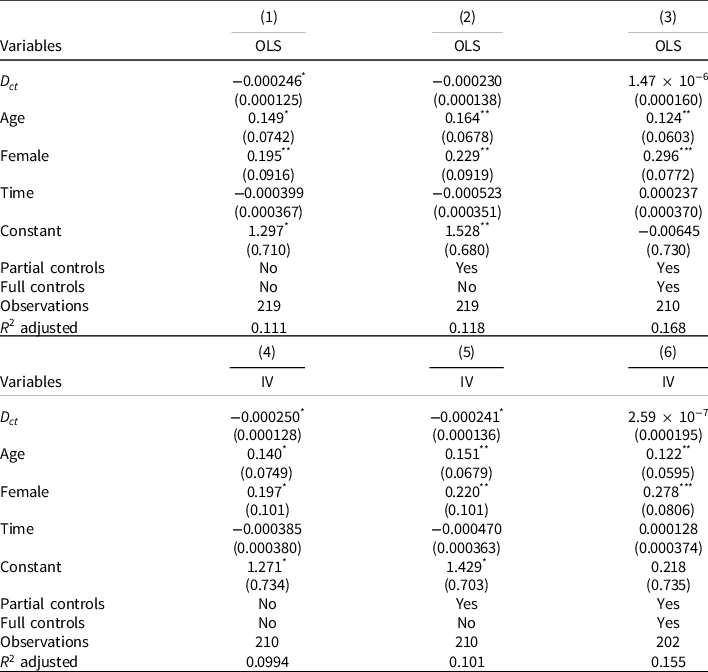
Note: This table reports the estimates of an OLS and an instrumental variable (IV) regression of the effect of democracy exposure on univariate health inequality (Cowell up). Partial controls include institutional performance, and full controls include the GINI of income, gross domestic product (GDP), and gross domestic product squared (GDP2). The specification of robust standard errors is in parentheses.
***p < 0.01, ** p < 0.05, * p < 0.1.
Source: Own calculations, European Social Survey 2002–2018 estimated, World Bank, Polity IV.
Robustness, heterogeneity, and mechanisms
Democracy and health inequality rankings
Finally, we turn to examine the effect of exposure to democracy on inequality rankings that are derived from previous inequality estimates. As expected, we retrieve consistent estimates. More specifically, our estimates suggest that exposure to democracy reduces a country’s inequality ranking. Both ordered probit and IV-ordered probit (estimated using control function) estimates suggest that an additional year in a democracy results in a reduction of two points in the inequality ranking (Table 5). As before, our estimates are sensitive to the inclusion of controls and suggest that while bivariate (CI) inequality does decrease with a year of exposure to democracy, such effect becomes less precise when we examine univariate inequality indices.
Democracy ( ${D_{ct}})\;$
effect on health inequality rankings (ordered probit and IV-ordered probit estimates)
${D_{ct}})\;$
effect on health inequality rankings (ordered probit and IV-ordered probit estimates)
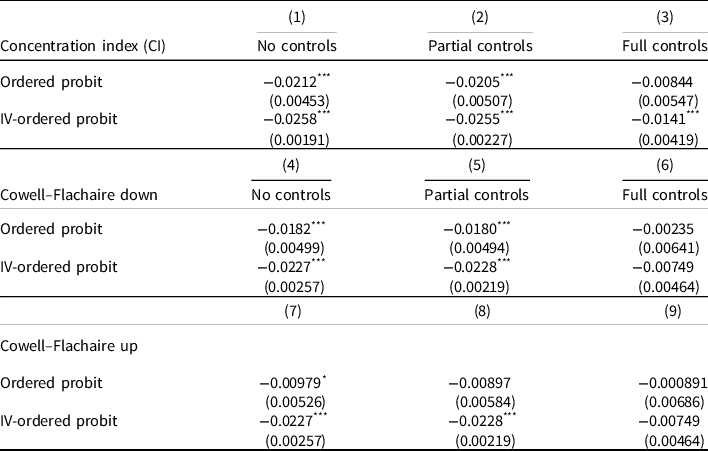
Note: This table reports the estimates of an ordered probit and an instrumental variable (IV)-ordered probit regression coefficients of the effect of democracy on health inequality computed using the control function of the effect of democracy exposure on both bivariate (concentration index) and univariate health inequality (Cowell up and Cowell down). Partial controls include institutional performance measures from the Worldwide Governance Indicators in 2022 and full controls include the GINI of income, gross domestic product, and gross domestic product squared. The specification of robust standard errors is in parentheses.
***p < 0.01, ** p < 0.05, * p < 0.1.
Source: Own depiction, European Social Survey 2002–2018 estimated, World Bank, Polity IV.
Heterogeneity
Table A5 in the supplementary materials report the estimates of different heterogeneities, including regional fixed effects to control for potential cultural and institutional differences across European countries.Footnote 8 Nonetheless, given that our number of observations decline significantly when fixed effects are included, our estimates become less precise than previous ones (subject to lower degrees of freedom), but consistently coefficients indicate evidence of a reduction in bivariate (CI) health inequality with exposure to democracy. Restricting the analysis to exclude countries from Eastern Europe significantly reduces the sample size, though the effects are comparable in size.
Health poverty
Finally, we explore the effect of a relevant mechanism driving inequality measures, namely the effect democracy exposure has on health poverty. Indeed, we find a high partial correlation coefficient ranging between 0.3 and 0.4 depending on the health inequality measures used . This is expected, given that health poverty is generally one of the main drivers of health inequality in the literature (Costa-Font and Cowell Reference Costa-Font and Cowell2021). That is, democracies benefit more those who are in worse health, who may not always be prioritized under autocratic systems, including more resources (e.g. investment in critical care and end-of-life care). In Table 6, we report the estimates of the impact of democratic exposure on the proportion of people who report poor health. Consistently, we find that exposure to a democracy reduces health poverty, defined as the share of people in poor health in 3 percentage points (pp), regardless of the set of controls included, which is consistent with previous descriptive evidence. However, the effect very much depends on the inclusion of a large set of controls (some of which are potentially endogeneous), such as income inequality and economic development which partially absorb the effect of health poverty.
Democracy and health poverty
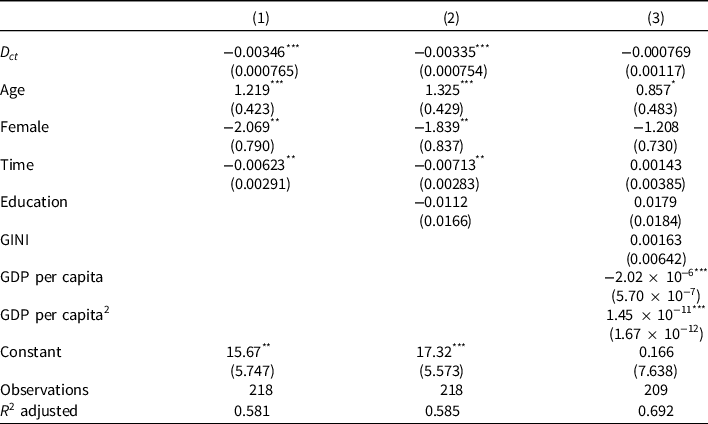
Note: Health poverty is measured as the share of individuals reporting very bad health in a measure ranging from 1 to 5. This table reports the estimates of regression analysis of the exposure to a democracy on the share of individuals in the worst health status in a measure that ranged from 1 to 5 (excellent health). Partial controls include institutional performance measures from the Worldwide Governance Indicators in 2022 and full controls include the GINI of income, gross domestic product, and gross domestic product squared. The specification of robust standard errors is in parentheses.
***p < 0.01, ** p < 0.05, * p < 0.1.
Source: Own depiction, European Social Survey 2002–2018 estimated, World Bank, Polity IV.
Conclusion
This paper has studied the effect of exposure to democracy, measured by the number of years under a democracy, on both bivariate and univariate health inequality measures in a sample of European countries from 2002 to 2018. We document that an additional year of democracy reduces bivariate health inequality (CI of income-related health inequality). Furthemore, we find evidence of the effect of democracy exposure on univariate inequality which is sensitive to the inclusion of controls for economic development and income inequality, although they are potentially endogenous here we take estimates with basic controls as our preferred specifications. We estimate a two-point rank reduction in health inequality with an additional year under a democracy. This effect is driven by a reduction in health poverty among countries exposed to a democracy.Footnote 9 Our estimates are consistent with estimates suggesting that democracy reduces income inequality (Acemoglu et al. Reference Acemoglu, Naidu, Restrepo and Robinson2013).
Our results can be explained by the fact that democracies are more likely to prioritize public health goals and design programs that target individuals exhibiting the highest health needs. These results are consistent with evidence that democracies are more likely to develop programs that improve the health of those at the bottom of the health distribution (Costa-Font et al. Reference Costa-Font, Turati and Batinti2020). This includes promoting universal access to healthcare, alongside public health targets. Unlike other studies, our estimates come from European countries which are not affected by other significant confounding institutional shocks in the period of analysis.
Supplementary material
The supplementary material for this article can be found at https://doi.org/10.1017/S0143814X23000211.
Data availability statement
The data employed in this study are entirely from the European Social Survey and the Policy IV project. It is publicly available. The commands and logs are available at https://doi.org/10.7910/DVN/KGBCZZ, and our estimates can be reproduced and updated as long as new waves are available.
Acknowledgement
We acknowledge the support from Jeongsoo Suh, as well as Frank Cowell, and participants in seminars at the LSE’s International Inequality Institute and LSE Health Policy.


 Open access