


The ability of states to successfully extract revenue from their residents is one of the most fundamental features of modern states, and yet, states’ fiscal capacity varies greatly across countries. The roots of a specific tax compliance environment rest on the reciprocal relationship between person and state. States must provide clear and consistent rules and signals, as well as public goods. Individuals can reciprocate by contributing to the state through taxation, voting, and through other forms of civic engagement. Indeed, the basis for our social contract derives from this exchange. In this study, I examine this particular dynamic between perception of public institutions and tax compliance, utilising a large tax compliance laboratory experiment conducted in Italy and the United States (US). I argue that institutional quality matters and, specifically, the perception that institutions are good (bad) will affect the tax compliance environment considerably. Although I do not directly test the relationship between institutional quality and trust, I suggest that much of the variation in tax compliance that we observe across countries can be explained by differing levels of institutional quality and, in that, the trustworthiness of those institutions.
Piggybacking off of a large category of institutionalist literature, I argue that human behaviour and decisions are not made independent of the context in which people live. Institutional incentives structure behaviour (Steinmo et al. Reference Steinmo, Thelen and Longstreth1992), but those behaviours are contingent on how individuals perceive their institutions (Levi Reference Levi1997, 21): For example, is the tax authority effective at carrying out efficient audits and punishing those who evade their taxes? Is the tax authority fair? And is the tax authority trustworthy? Indeed, there is a host of literature that demonstrates that taxpayers are contingently compliant, meaning that they are more willing to pay their taxes if they believe their institutions are efficient and effective (Levi Reference Levi1989; Smith and Stalans Reference Smith and Stalans1991; Pommerehne et al. Reference Pommerehne, Hart and Frey1994; Scholz and Lubell Reference Scholz and Lubell1998; Frey and Feld Reference Frey and Feld2002; Frey and Torgler Reference Frey and Torgler2007; Levi et al. Reference Levi, Sacks and Tyler2009; Torgler and Schneider Reference Torgler and Schneider2009). Simply put, taxpayers are looking to get the most bang for their buck. According to Michael L. Ross (Reference Ross2004), “Both the size of the tax burden, and the quality and quantity of government spending matter; citizens ultimately care about the ‘price’ they pay for the government services they receive.”
Individuals’ choices are thus framed by the institutional context in which they reside. Institutions are defined as the basic rules and constraints that individuals follow such as formal constitutions, laws, governing bodies, as well as informal rules such as social norms (North Reference North1991). Institutional context refers to the quality of these formal and informal institutions. Therefore, an Italian’s taxpayer behaviour will be shaped by a different institutional context than that of an American. For this reason, although Italians, for example, believe paying taxes is a moral duty – slightly more than subjects in the US – (see Figure A.1 in Appendix) – tax evasion is much higher in Italy. Italians show little trust in their government (see Figure A.2 in Appendix and Table 1) and pay a high price for government services. While the US collects considerably less tax revenue as a percent of GDP than the OECD average, Italy has one of the highest tax burdens in the OECD (Tax Policy Center 2017). Even with only slightly lower levels of confidence in government, as depicted in Table 1, the tax burden in the US is almost half the tax burden in Italy. If people are indeed willing to pay for the quality and quantity of services that they receive (Ross Reference Ross2004) then Italians should also be less tax compliant than Americans. As Bergman (Reference Bergman2009, 10) elegantly puts it, “People maximise utilities inasmuch as they pay as little taxes as they can. But the environment in which people operate fundamentally shapes how they frame the maximisation tenets.”
Table 1 Percentage of citizens rating institutions as “corrupt” or “very corrupt” 24 advanced industrial countries
Source: Transparency International Global Corruption Barometer Reports (various years).
Bold value highlight the two countries in the present study.
Taxpayer behaviour is thus a dynamic process between the rational equilibrium of “paying as little as I can” and the institutional context. If the fiscal, institutional and administrative capacity is effective in deterring utility maximisation behaviour, while providing an institutional environment that fosters a positive perception of government, a high-compliance equilibrium can thrive. On the other hand, if fiscal/institutional capacity is weak, shaping disaffection towards political and public institutions, a low-compliance equilibrium is more likely.
A team of researchers and I designed our study to test this dynamic process by utilising a tax compliance experiment. We conducted these experiments between 2015 and 2017 in eight experimental laboratories with almost 700 subjects. Our team spent almost a year designing and redesigning these experiments so that we were holding the treatments constant across languages and cultural differences. But because we chose to run these experiments in so many locations with such a large number of subjects, we also had to make some methodological sacrifices, such as reordering treatments. In the end, we chose to engage our subjects by giving individuals in different countries with vastly different real-world behaviours regarding taxation (on average) a set of “abstract” tax decisions (similar to most tax compliance experiments) and a set of tax decisions which were linked to their real public institutions.
This article thus makes both a theoretical and methodological contribution to the literature. Theoretically, I provide evidence demonstrating that tax compliance decisions are not independent of the institution to which we contribute. How individuals perceive their institutions is a crucial component of the tax compliance decision. Methodologically, we provide a unique experiment, which can help us to better explain crosscountry variation in tax compliance, by asking subjects to make country-specific tax decisions.
To preview my results: I uncover that given the exact same institutions, Italians are just as tax compliant as Americans. But when respondents are asked to pay taxes to their real-world institutions, Italians become less compliant than Americans.
Institutional quality and trust
Collecting taxes is one of the most basic functions of government, yet it is also arduous for many countries. Allingham and Sandmo’s (Reference Allingham and Sandmo1972) influential study provided tax authorities and scholars with a simple model that could be easily adapted. It assumes that taxpayers are largely constrained by the probability of being caught cheating and the severity of the penalty. In other words, if the benefits from evasion outweigh the costs, the taxpayer will likely evade.
This parsimonious model helps to explain some of the underlying features of tax compliance and evasion (see Dubin and Wilde Reference Dubin and Wilde1988), but it also has important drawbacks. For example, a number of studies demonstrate that audit rates and penalties are insufficient in deterring tax evasion (Graetz and Wilde Reference Graetz and Wilde1985; Andreoni et al. Reference Andreoni, Erard and Feinstein1998; Frey and Feld Reference Frey and Feld2002; Torgler Reference Torgler2002). For example, both the US and Sweden have audit probabilities of less than 1%, but evasion tends to be relatively low. Italy, on the other hand, has a relatively high audit probability, but evasion in Italy is significantly higher than in most developed countries. Moreover, whether the deterrence model is effective is highly contingent on the credibility and the legitimacy of the administration. As, Kirchler, Hoelzl and Wahl (Reference Kirchler, Hoelzl and Wahl2008, 212) nicely state, “when tax authorities make it known that they were more efficient in detecting tax fraud and in bringing justice, the trust honest taxpayers put in the authorities will rise.” On the other hand, if the sanctions are not credible and the government overuses their authority, trust in the administration can decline, and with that, tax evasion increases. Thus, whether individuals perceive their government as effective, reinforcing the perception that the quality of government is high, has important implications for the tax compliance environment. (Kirchler et al. Reference Kirchler, Hoelzl and Wahl2008; Torgler and Schneider Reference Torgler and Schneider2009; Wahl et al. Reference Wahl, Kastlunger and Kirchler2010; Kastlunger et al. Reference Kastlunger, Lozza, Kirchler and Schabmann2013).
Effective institutions provide clear signals to taxpayers that administrations are credible and trustworthy. On the other hand, corrupt institutions and a lack of governmental transparency cause (1) uncertainty and (2) a reduction of trust in authorities. If we think about uncertainty from a tax perspective, we can imagine a tax authority that lacks the administrative capacity to implement credible sanctions. Taxpayers are then left doubting both whether they will be sanctioned, and just as importantly, whether their fellow taxpayers will be audited. Bergman (Reference Bergman2009) comparing Chile and Argentina, demonstrates that credible sanctions in Chile were an effective tool in improving the perception of government, and therefore, reducing evasion. In another study, Torgler and Schneider (Reference Torgler and Schneider2009) use an extensive dataset, comprised of between 55 and 57 countries from the period 1990–1999 to demonstrate that government effectiveness has the greatest effect on reducing the size of the shadow economy. Similarly, Torgler and Valev (Reference Torgler and Valev2006) suggest that a high level of corruption is correlated with high levels of tax evasion. Effective institutions then provide some guarantee that the state is upholding their end of the social contract.
One argument for this is what many have called the “slippery slope” framework (Kirchler et al. Reference Kirchler, Hoelzl and Wahl2008; Wahl et al. Reference Wahl, Kastlunger and Kirchler2010; Kastlunger et al. Reference Kastlunger, Lozza, Kirchler and Schabmann2013). According to the “slippery slope” framework, tax compliance is contingent on the interaction between the power of authorities to enforce tax rules and trust in the authorities. Formal rules, such as audits and sanctions, are related to power, whereas the distribution of the tax burden and public goods, procedural fairness and social norms are more related to trust in institutions. As Kastlunger et al. (Reference Kastlunger, Lozza, Kirchler and Schabmann2013, 38) eloquently state, on one hand, legitimate power is perceived as high if tax crimes are detected in a reasonable way and tax authorities combat tax crimes efficiently without harassment but due to their competence. On the other hand, coercive power is perceived as high, if tax authorities combat tax evasion primarily by draconic control and enforcement, if investigations are long and severe and the only aim of adopted processes is to detect findings. Among 389 Italian entrepreneurs and self-employed individuals, Kastlunger et al. (Reference Kastlunger, Lozza, Kirchler and Schabmann2013) demonstrate that trust does increase compliance, while coercive power was associated with higher levels of evasion. In other words, administrations can work cooperatively with citizens or they can work in a more adversarial way. Administrations that work cooperatively with citizens can garner more trust than those who work from the baseline that everyone is going to cheat if they can get away with it (Braithwaite Reference Braithwaite2003).
Trust then is a fundamental aspect of the tax compliance decision. There is a large body of literature demonstrating that trust increases compliance to organisations’ rules and regulations, both in the public and private sector (Braithwaite and Makkai Reference Braithwaite and Makkai1994; Murphy Reference Murphy2004). Trust, further, affects the extent to which individuals willingly comply to costly demands, such as paying one’s taxes. Levi (Reference Levi1998) suggests that citizens are likely to trust government granted they believe that the state will act in their best interest. Therefore, citizens will perceive the state as trustworthy if they believe that the state will act in society’s interest. Governments must guarantee procedural fairness and that their trust in the state is reciprocated. According to Feld and Frey (Reference Feld and Frey2002, 89) “the tax authorities must acknowledge and support the contract with the taxpayers by acting in a respectful way towards them, but also by preventing honest taxpayers from being exploited in the process.” Murphy (Reference Murphy2004) demonstrates that a low level of trust was a significant predictor of resistance to the tax authority among 6,000 Australian taxpayers. Moreover, Torgler (Reference Torgler2007) utilises a controlled field experiment in Switzerland in which a test group of citizens receive a letter from the Swiss government outlining the importance of paying taxes. He uncovered that tax compliance when varying the tax rate is generally insignificant while trust in the legal system is highly significant. Hence, in an environment with high trust, features of some tax systems that might increase evasions, such as high tax rates, do not dissuade individuals from their fiscal obligations. Feld and Frey (Reference Feld and Frey2002) conclude in their study of the Swiss tax authority that trust is the basis for the psychological tax contract.
Tax compliance thus can be seen as an exchange relationship between the taxpayer and the state. This relationship is twofold: on the one hand, the state must provide quality public service and stable political institutions so as to generate high trust and willingness to fund those institutions. On the other hand, the taxpayer must reciprocate by providing enough revenue to fund a modern and efficient state.
Explaining national variation in tax compliance
There is a long history of scholarly literature that argues that socioeconomic differences between countries can largely be explained by deep cultural differences (Almond and Verba Reference Almond and Verba1963; Banfield Reference Banfield1967; Putnam et al. Reference Putnam, Leonardi and Nanetti1994; Tabellini Reference Tabellini2010). These scholars argue that countries who have historically lagged economically demonstrate what Banfield (Reference Banfield1967) has termed “amoral familism.” Within these countries, behaviours, such as sharing, generosity and trust, only extend to individuals tied by familial lineage or close friendship. If applied to taxation, individuals from these countries would resist taxes, as contributions to the public good through taxation are far removed from the family. On the other hand, countries that demonstrate a positive civic culture – defined by Almond and Verba (Reference Almond and Verba1963) as acceptance of the authority of the state and beliefs in participation in civic duties – would be more likely to contribute to the state through taxation, as their ties are more outwardly facing and more likely to extend to the state. Though culture can be used as an appropriate analytical tool to examine crossnational behaviours, it can also lead to overly generalised stereotypes, such as the honest Swede or the dishonest Italian.
The tax literature that has specifically examined crossnational differences in attitudes toward taxation has typically approached the topic by examining differences in tax morale. Tax morale, according to Torgler (Reference Torgler2007), is an intrinsic motivation to pay taxes. Tax morale usually considers social norms, ethical considerations and attitudes toward government and helps to explain the high levels of tax compliance that cannot be accounted for by typical rational choice models. These studies have unearthed important cultural differences between countries, types of government, and also religious groups (Alm and Torgler Reference Alm and Torgler2006; Torgler Reference Torgler2006). One drawback to this approach, however, is that tax morale is formed through a particular institutional context or lens, and thus, individuals’ tax morale is not constructed independently of the institutional environment in which people live.
This is why the institutionalist literature is so important for helping us explain differences in tax compliance (D’Attoma Reference D’Attoma2018). Institutonalists argue that to understand differences between countries, scholars should look at how institutions frame and shape behaviour (Steinmo, Thelen and Longstreth Reference Steinmo, Thelen and Longstreth1992). Institutions create the conditions that can generate voluntary tax compliance (Levi Reference Levi1989) through both formal rules, such as audits, penalties and the responsiveness of government (Rothstein Reference Rothstein1998) and also informal mechanisms, such as social norms (Andrighetto et al. Reference Andrighetto, Zhang, Ottone, Ponzano, D’Attoma and Steinmo2016).
People who have lived in more than one country for a considerable amount of time know that we usually adapt to the combination of formal institutions and social norms of the society in which we live. The same person might find it perfectly acceptable – albeit illegal – to run a stop sign while in Italy, but unacceptable in the US. This is due to differences in enforcement (formal institutions) and social norms. The formal and informal are mutually reinforcing and, over time, can become features of culture, such as trust. I argue then that much of what we understand about crossnational variation in tax compliance can be explained by the dynamic process through which formal institutions, informal institutions and culture interact.
Country selection
Tax systems are hugely complex and to fully explain the similarities and differences between countries would require an entire book, yet alone a section in this article. But given the vast interest in crossnational behavioural experiments, tax compliance research has become increasingly relevant, especially given that the tax compliance decision encompasses a range of personal motivations. Furthermore, tax compliance varies widely across countries (Alm and Torgler Reference Alm and Torgler2006), even across developed democracies.
There are several studies that examine tax compliance in Italy and the US compared to other European countries. Alm et al. (Reference Alm, Sanchez and De Juan1995) conduct tax compliance experiments in the US and Spain, and Alm and Torgler (Reference Alm and Torgler2006) utilise the World Values Survey to examine tax morale in the same countries, generally uncovering that Americans tend to be more tax compliant and demonstrate higher tax morale than Spanish and European respondents. There have also been several crossnational studies that utilise Italy compared to Great Britain (Lewis et al. Reference Lewis, Carrera, Cullis and Jones2009; Zhang et al. Reference Zhang, Andrighetto, Ottone, Ponzano and Steinmo2016) and Sweden (Andrighetto et al. Reference Andrighetto, Zhang, Ottone, Ponzano, D’Attoma and Steinmo2016). The results of these studies are mixed. Lewis et al. (Reference Lewis, Carrera, Cullis and Jones2009) indicate British subjects were more compliant; Zhang et al. (Reference Zhang, Andrighetto, Ottone, Ponzano and Steinmo2016) present compelling evidence suggesting Italians are more compliant than Brits; and Andrighetto et al. (Reference Andrighetto, Zhang, Ottone, Ponzano, D’Attoma and Steinmo2016) unearths that on average Swedes are not more compliant than Italians, but the behaviours between the countries do differ, in that Italians are more likely to fudge than Swedes. Most recently, Alm et al. (Reference Alm, Bernasconi, Laury and Lee2017) were interested in differences in tax compliance behaviour in Italy and the US with respect to public disclosure. Due to the relative similarity of the tax systems, but the large variation in tax behaviour, and the somewhat ambiguous crossnational results between Italy, the US and other European countries, tax compliance experiments in which we leverage real-world institutions in the US and Italy can provide a fruitful comparison.
Other reasons to compare the two countries include the different tax burdens, institutional quality and perceptions of government. As I mentioned in the introduction, Italy has one of the highest tax burdens in the OECD, as well as a high preponderance of tax evasion. Indeed, the fight against tax evasion is a common theme among Italian politicians and citizens (D’Attoma Reference D’Attoma2017). It is also referenced as the cause of many societal problems such as reductions in public spending and inequality (Santoro and Fiorio Reference Santoro and Fiorio2010; Alm et al. Reference Alm, Bernasconi, Laury and Lee2017). Moreover, Italy is a country plagued by ineffective governance and perceived to be relatively corrupt. Transparency International Corruptions Perceptions Index (2016) ranks Italy as number 60 – one of the lowest in the OECD (Lambsdorff Reference Lambsdorff1999).
In contrast, the US has one of the lowest tax burdens in the OECD and tax evasion is relatively low, especially compared to Italy. Tax evasion is rarely discussed in political circles and not nearly as salient in the US as it is in Italy. Though perceptions of public institutions in the US are on the decline, the Transparency International Corruptions Perceptions Index (2016) ranks the US as 18th – significantly lower than Italy.
Moreover, The Quality of Government Institute (2016) has created a scale that combines components measuring corruption, rule of law and bureaucratic quality. The scale scores the US (0.83) and Italy (0.57). These scores reflect important variation in the context of tax compliance.
Experimental design
Our experimental design follows the basic elements of most tax compliance experiments (Alm et al. Reference Alm, McKee and Beck1990; Alm Reference Alm2010).Footnote 1 First, subjects earn money and are asked to report their income. At the end of the experiment, reported income is subject to a random audit, and if audited, underreported income is subject to a fine. Final income is thus equal to the earned income plus the share of the group fund (detailed below), minus taxes levied and fines.
The experimental design consisted of two stages, with three reporting rounds in each stage, and thus a total of six reporting rounds. Each stage implements changes in the experimental treatment. It should be noted that we did not randomise, nor control for possible ordering effects in the first three rounds of the experiment. In a within-subject design, this is problematic because decisions made in previous rounds could affect decisions in subsequent rounds. As Harrison et al. (Reference Harrison, Johnson, McInnes and Rutström2005) suggest:
The primary methodological contribution of experiments in economics is to enhance control. Ideally, such control makes the explanatory variables of interest, in this case scale, orthogonal to other explanatory variables such as order, allowing clearer inferences about behavior than one could get from field econometric data. We argue that not controlling for order effects results in a misspecification of utility functions that is as important as that of scale.
Existing evidence is mixed, however. While there are number of studies that demonstrate that order has an effect on decisionmaking (Bradley and Daly Reference Bradley and Daly1994; Harrison et al. Reference Harrison, Johnson, McInnes and Rutström2005; Carlsson et al. Reference Carlsson, Mørkbak and Olsen2012; Scheufele and Bennett Reference Scheufele and Bennett2013), there are also many studies that demonstrate little or no ordering effects (Brazell and Louviere Reference Brazell and Louviere1997; Arentze et al. Reference Arentze, Borgers, Timmermans and DelMistro2003; Oppewal et al. Reference Oppewal, Morrison, Wang and Waller2010; Day et al. Reference Day, Bateman, Carson, Dupont, Louviere, Morimoto, Scarpa and Wang2012). Most relevant to our research, Bruner et al. (Reference Bruner, D’Attoma and Steinmo2017) uncover no ordering effects in a controlled tax compliance experiment with a public good and indicate that regardless of order there is an increase in compliance when the public good multiplier is increased from zero.
In the first stage of the experiment we manipulate the payoff, while in the second round we vary the public institution to which subjects contribute. At the beginning of stage one, participants were asked to perform a simple clerical task for which they copied a line of fictitious names from a piece of paper to the computer screen. For each correctly copied row, participants earned 10 currency units that would later be exchanged for domestic currency at an exchange rate of 0.01 per token.
After subjects performed the 5-minute clerical task in stage one, we presented subjects with an example of how their income would be calculated based on the experimental parameter, followed by a reporting screen. They were informed that the tax rate would be 30%, the audit probability would be 5%, and the fine, if audited and detected cheating, would be twice the taxes evaded. We only reveal the results of the audits at the conclusion of the experiment. Participants are not provided with any information about whether other participants are audited, nor whether other participants are honestly declaring their own incomes to limit the effects of conditional cooperation. In the first stage, they were also informed of the payoff they would receive from their contribution to the public good. In round 1, participants received nothing in return for tax payments. In round 2, their money was collected, summed and put into a general fund which was then redistributed equally too all participants. Finally, in round 3, the money was collected, summed and put into a general fund. But this time the fund was divided into two portions: one part (80%) was allocated to portion A and a second part (20%) was allocated to portion B. All of the money in portion A was distributed in equal parts to all of the participants, regardless of how much each participant earned, and how much they put into the fund. The money in portion B was distributed in equal parts to the lowest 20% of income earners, regardless of how much each person in this group put into the fund.
For stage two of the experiment, we maintained a tax rate of 30% with the same audit probability and fine. However, in this stage, subjects were asked to perform a 4-minute clerical task before each reporting round. In this stage, there was no public good, but instead, their tax revenues would be sent directly to their real-world public institutions. In a real sense, there was an actual public good attached to this stage, since we did send all revenues to the public institutions at the end of the experiment. We randomise stage two for each respondent to limit any anchoring effects. Czajkowski et al. (Reference Czajkowski, Giergiczny and Greene2014) suggest that by using a counterbalance design in which each respondent is presented with a randomised order, potential learning or anchoring effects are cancelled out for the sample, and experimenters can minimise the ordering effects. Subjects were informed that their reported income would be assessed a 30% tax rate with a 5% audit probability, and the revenue collected would be sent to the national government, national pension scheme and the fire department. To reiterate: institutions were randomised and all subjects received a clerical task before each institutional round in stage two (see Table A.1 in the Appendix for a summary of the rounds).
The experiments were conducted in five universities in the US and four in Italy. Subjects were recruited through a common recruitment system called, Online Recruitment System for Experimental Economics (ORSEE) (Greiner Reference Greiner2004), and the experiments were programmed in Behavery. Sessions lasted approximately 60 minutes with average earnings in Italy of 13.55 euro and average earnings in the US of 15.33 dollars plus a 5 dollars or 5 euro show-up fee. Payment structure was based on 1.5 times the country’s minimum wage. There were more females in the US; Americans were significantly more likely to be employed; Italians were slightly more risk-averse and older; and finally, Americans copied significantly more rows as indicated by the income variable. In total, there were 694 subjects (US=424, Italy=270), as shown in Table 2 with further participant characteristics.Footnote 2
Table 2 Participant characteristics: US and Italy
Note: Schlag’s Z-test and t-tests to test for country-level differences. An asterisk (*) indicates whether differences between countries are statistically significant at the 5% level.
Upon completion of the experiment, subjects were asked to take a short 10-minute survey. The survey collected demographic information, as well as information regarding trust and attitudes towards taxation. Subjects were then paid at the end of the survey.
Why these institutions?
We chose these specific institutions based on the institutions that we assumed would elicit the strongest behavioural response. Although we believed that confidence in the national government [Treasury (US) and Ministero dell’Economia e delle Finanze (Italy)], pension system [Social Security (US) and Istituto nazionale della previdenza sociale (Italy)] and fire and rescue services [Fire Department (US) and Vigili del fuoco (Italy)] would vary between countries, we also believed that each of these institutions would generate particularly strong responses within countries. Moreover, with the exception of the fire department, both the Treasury (Ministry of Economy and Finance) and the pension funds have very similar functions in both countries and are federal level institutions.
However, coming up with an institution that we thought would elicit strong feelings and be considered a positive governmental institution was a difficult task. After informally surveying Italian and American colleagues, friends and random strangers, we opted to go with the fire and rescue service, even though in the US it is administered locally and in Italy it is administered federally. From our conversations in both countries, fire and rescue were both considered to be positive institutions and to perform more or less the same functions. Although I do not have comparable data on perceptions of the Italian fire and Rescue Service, according to a Pew Research Poll, 86% of those polled in the US said that the fire department is doing an excellent job (see Rainie et al. Reference Rainie, Purcell, Siesfeld and Mayur2011).
It could be argued then that we are measuring willingness to contribute to the local government versus the national government when comparing these institutions in the two countries. Although possible, we are interested in how perceptions of governmental institutions affect tax compliance and, therefore, whether the institution is administered locally or federally is less important than whether individuals perceive these institutions as either good or bad. It is important that individuals have a particular set of beliefs and attitudes about how well these institutions function.
Hypotheses
Based on the institutionalist argument that institutions structure behaviour and give signals to individuals about expected behaviours, I expect that institutional rules will affect behaviour independent of national culture. More specifically, the no-pot round (round-one), in which there is zero payoff from contributions to the public good, will elicit lower compliance than rounds in which there is redistribution or taxes go directly to real-world institutions. Moreover, when given the exact same incentives and asked to make the same decisions in rounds 1–3, the average compliance rate will be significantly greater in the US than in Italy. This is based on the commonly held belief that Americans generally have high tax morale, whereas Italians are more noncompliant (Alm and Torgler Reference Alm and Torgler2006). Indeed, tax behaviour in the real world bears these differences.
Moreover, given that the quality of public institutions is perceived to be considerably higher in the US than in Italy, tax compliance will be significantly higher in the US in the rounds for which subjects have to contribute to their real world institutions. Specifically, Americans tend to be more trusting of their federal institutions than Italian citizens (see Wike et al. Reference Wike, Simmons, Stokes and Fetterolf2017 and Figure 1 from our postexperiment questionnaire). Although comparable survey data are not available on confidence in pension funds, our postsurvey questionnaire does demonstrate a significant difference between Americans and Italians. I, therefore, predict that Americans will be more compliant in the pension fund round than Italians. Americans should also be significantly more compliant than Italians in the fire and rescue round. Although, compliance in the fire department round should be high in both countries, Americans are uniquely supportive of their fire department.
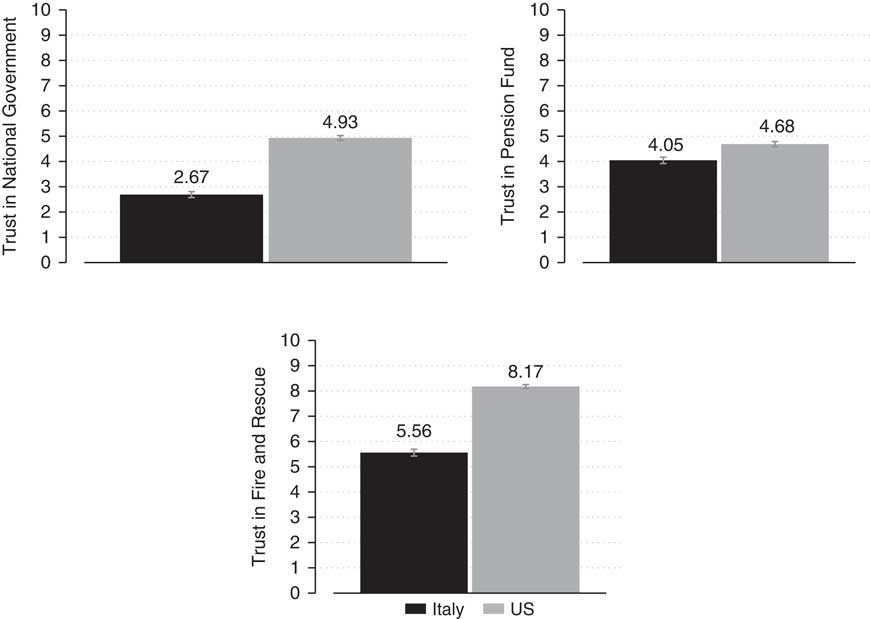
Figure 1 Bar graph of trust in institutions in Italy and the US.
Note: On the Y axis in Figure 1 are trust in institutions, which are generated from our postexperimental survey. Responses range from 1 to 10 with 1 meaning no confidence and 10 being absolute confidence.
There should also be a stronger effect in Italy than the US when increasing the pay-off to the public good. The literature has accounted for several reasons for why attitudes towards redistribution vary between countries, including ethnic heterogeneity (Alesina and Glaeser Reference Alesina and Glaeser2004), culture (Lipset Reference Lipset1997) and institutions (Esping-Andersen Reference Esping-Andersen2013). This should result in more responsiveness to increase in the pay-off from taxation in Italy. I also hypothesise a stronger positive effect for Americans when we introduce the national government, pension fund and the fire department. Finally, because individuals with higher levels of trust in institutions believe that government will fulfil its duty in the tax contract (see Feld and Frey Reference Feld and Frey2002), high-trust individuals will be more likely to reciprocate with higher tax compliance than low-trust individuals.Footnote 3
Experimental analysis
In this section, I provide a set of analyses to test how perception of public institutions affects tax compliance. For the first part of the analysis, I examine whether average tax compliance varies between countries and experimental treatment. I proceed by investigating the distribution of decisions, which tells us a bit more about the behavioural differences between countries. This is followed by individual level statistical tests. Finally, I test the country and round interactions. In other words, I examine whether individuals from Italy respond differently to the experimental treatment than participants in the US.
Overall analysis
I begin the analysis by reporting the average reported income across rounds, pooling the total dataset. I test whether there is variation in the experimental parameters. Although from Figure 2, the treatments do not seem to elicit large behavioural differences, there does seem to be some significant variance between rounds.Footnote 4
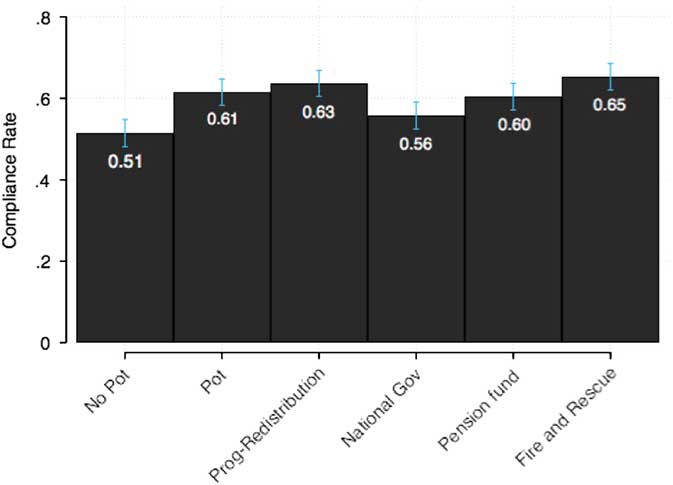
Figure 2 Average reported income overall.
Next, I report the average compliance rate for each treatment in each individual country in Figure 2. Here I investigate if Italians are indeed less tax compliant than Americans in each individual round. Although real-world evidence demonstrates that Italians will be less tax compliant, recent experimental studies exhibit, however, that under certain contexts Italians are actually more tax compliant than Brits (Zhang et al. Reference Zhang, Andrighetto, Ottone, Ponzano and Steinmo2016) and Americans (Alm et al. Reference Alm, Bernasconi, Laury and Lee2017) in experiments; and they do not demonstrate significantly different tax compliance rates than Swedes (Andrighetto et al. Reference Andrighetto, Zhang, Ottone, Ponzano, D’Attoma and Steinmo2016). Both Alm et al. (Reference Alm, Bernasconi, Laury and Lee2017) and Andrighetto et al. (Reference Andrighetto, Zhang, Ottone, Ponzano, D’Attoma and Steinmo2016) uncover interesting behavioural differences as well, such as Italians were more likely to fudge than Swedes. Figure 3 demonstrates prima facie evidence that Americans tend to be more compliant than Italians, except when asked to contribute to a public good in rounds 2 and 3.Footnote 5
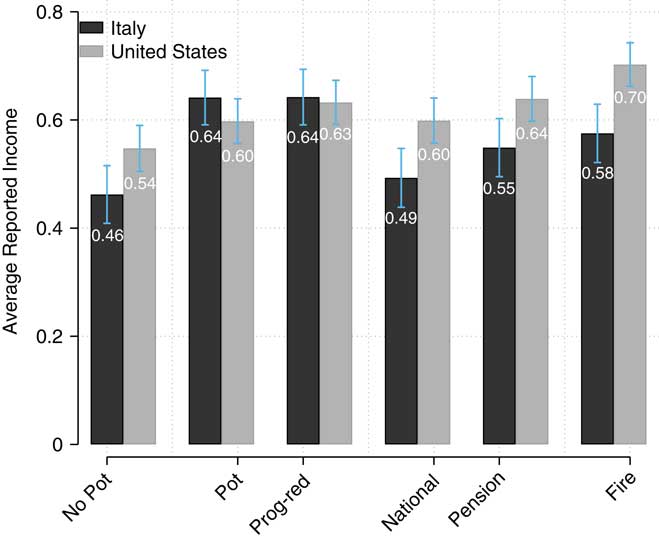
Figure 3 Average reported income by country.
However, a different picture emerges when examining the compliance rate in each individual round.Footnote 6 Here the results are intriguing. In the no-pot round, Americans are significantly more compliant than Italians. But when the public good is introduced in rounds 2 and 3, Italians become just as tax compliant as Americans. In the institutional rounds, though, Italians are significantly less willing to contribute to their real-world institutions than Americans. In fact, Italians are only slightly more compliant in the national government round than in the no-pot round in which participants are essentially burning their money. I believe that this result speaks a great deal to the association between institutional quality and tax compliance.
Distribution of decisions
However, averages do not tell us much about the distribution of decisions. It is, therefore, important to examine the distribution of complete evaders, complete compliers and partial evasion decisions. I test if the difference between countries is being driven by the percentage of complete compliers, complete evaders, or “fudgers” (i.e. Andrighetto et al. Reference Andrighetto, Zhang, Ottone, Ponzano, D’Attoma and Steinmo2016). Table 3 exhibits this distribution. Columns 1–3 display the proportion of decisions in each round characterised as complete evasion. Here, a significantly greater percentage of Italian participants’ decisions are complete evasion in the no-pot round (round 1) and the institutions rounds (rounds 4–6). The difference is particularly great in the National Government round with a gap of 13%. In columns 4–6, I display the proportion of decisions in each round characterised by 100% compliance. Under this condition, a significantly greater percentage of American participants’ decisions are characterised by full compliance in the no-pot round and the institutions rounds with a particularly large gap (16%) in the fire and rescue service round. In columns 7–9, I present the proportion of decisions in each round classified as partial evasion. By partial evasion, I mean subjects are neither 100% compliant nor 100 noncompliant; participants reports some income, but not all income. Only in the no-pot round are there significant differences between the US and Italy, and the gap is quite small (3%). Finally, in columns 10–12, I examine the percent of income declared by partial evaders. In other words, how much does the subset of partial evaders report on average? I detect no significant differences between countries, and thus, can conclude that the gap between countries, especially in the no-pot and institutions rounds, is being driven by those who report all or nothing.
Table 3 Distribution of complete evasion, complete compliance and partial evasion decisions
Note: N Italy=270; N US=422. Schlag’s Z-test to test for country-level differences in columns (3), (6) and (9), and Mann-Whitney tests in column (12).
* Indicates whether differences between countries are statistically significant at the 5% level.
Individual level analysis
I now proceed to the individual level models to examine if the variation is robust to differences in participant characteristics. Following Alm et al. (Reference Alm, Bloomquist and McKee2015) and Zhang et al. (Reference Zhang, Andrighetto, Ottone, Ponzano and Steinmo2016) , I report results for a subject random effects generalised least squares estimation with standard errors corrected for clustering at the individual level:
 $$Y_{{i,j}} {\equals}\beta _{0} {\plus}\beta _{1} U.S._{i} {\plus}\beta _{2} {\rm Income}_{{i,j}} {\plus}\beta _{3} X_{i} {\plus}\psi _{t} {\plus}u_{i} {\plus}{\epsilon}_{{i,j}} $$
where Y i,j represents the percentage of earned income declared by subject i in decision round j, US is a dummy variable for subjects in the US, Income i,j is participant i’s earned income in round j; X i denotes a vector of demographic variables including gender, age, employment status, past participation in experiments, self-reported risk measure, factor indexes for Trust, Pro-redistribution and Duty to Pay Taxes (See Pampel et al. Reference Pampel, Andrighetto and Steinmo2018 for explanation of how the indexes were created.); Ψ j is a set of J−1 dummies that capture round fixed effects (model 1); u i are random effects that control for unobservable individual characteristics; and ε i,j is an individual-round error term (Table 4).
Table 4 GLS with random effects: average reported income for each subject in each decision round
Note: Robust standard errors in parentheses.
**p<0.01, *p<0.05.
According to the estimates in column 1, American subjects report on average and across rounds, 6 percentage points more income than their Italian counterparts, all else being equal. Furthermore, there is a significant positive coefficient in each treatment when comparing them to the no-pot round, which further validates the experimental design. In columns 2–5, I examine the compliance rate when introducing a public good. Therefore, I only analyse rounds 1–3 in which a public good is introduced to the participants. Here, contrary to my predictions, the results are null. When contributing to the public good there are no significant differences between Italians and Americans, controlling for a host of individual characteristics. This is interesting considering that previous literatures demonstrate that Americans are generally more compliant and have higher tax morale than European countries. I will elaborate this further as I examine the treatment effects in the following table. In columns 3–4, I introduce several controls, and in column 5, I include my full model. There are several variables that stand out in column 5. For example, participants who agree more with policies that promote redistribution are also more tax compliant. Moreover, women are more compliant than men, confirming a large body of literature on tax compliance (Giese and Hoffmann Reference Giese and Hoffmann2000; Torgler Reference Torgler2002; Gërxhani Reference Gërxhani2007; Bruner et al. Reference Bruner, D’Attoma and Steinmo2017; D’Attoma et al. Reference D’Attoma, Volintiru and Steinmo2017). Finally, individuals who enjoy taking risks and have past experience with behavioural experiments are less tax compliant on average in rounds 1–3.Footnote 7
In columns 6–9, I test whether Italians are less willing to contribute to their real-world institutions than Americans. Whereas in the first three rounds, all subjects in both countries were making the same decision and contributing to a public good that would be shared among everyone, in rounds 4–6, participants were asked to pay taxes to their real public institutions. The basic premise behind this task was to examine if asking subjects to contribute to their real-world public institutions, elicited patterns that were more similar to the real world. Indeed, American subjects are significantly more compliant when paying taxes to their real world institutions than Italians. This holds across models 6–8. When I include employment status, past-participation, income and age to the model in column 9, the differences are no longer significant. It is also notable that although pro-redistribution was positive and significant in the abstract tax rounds, it is not significant in the institutions rounds. On the other hand, while trust was not significant in the abstract tax rounds 1–3, trust now becomes an important predictor of tax compliance in the public institution rounds.
Country and round interactions
Finally, in Table 5, I estimate the interaction between the decision round and country. The estimation equation is mainly the same as in Table 4 with the inclusion of controls and added treatment interactions. In column 1, I estimate the model without any individual level controls. Here, Americans comply on average 9 percentage points more than Italians in the no-pot round. Moreover, Italians increase their compliance significantly from the no-pot round to all other rounds, except for the round in which they are paying taxes to the national government. Interestingly, Italians do not demonstrate a significant difference in compliance from the no-pot round in which the money is burned compared to the national government round. Examining the interaction terms, however, the difference-in-difference on the US×Pot and US×Prog coefficients are significant, meaning that the effect of introducing a public good or a pay-off to the public good is stronger in Italy than in the US. Specifically, examining predicted probabilities for the compliance rate in Figure 4a and b, we can observe that Italians increase their compliance by 18% when the public good is introduced in rounds 2 and 3. For Americans, there is a much smaller increase. This makes sense since Italians generally are in favour of more social spending (Kuhn Reference Kuhn2012) and social spending makes up a much larger percent of the Italian economy. According to the OECD (2016), while social spending in the US only accounts for approximately 19.3% of GDP, in Italy social spending represents approximately 28.9% of GDP. Only Belgium, Finland and France spend more than Italians. I cannot tease out what is driving the stronger response in Italy, but these results demonstrate that Italians are more responsive to redistribution than Americans. These findings are robust to a host of controls in columns 2–4. Moreover, there are not large differences within countries between the institutional rounds, with one exception: the fire department in the US The fire department round in the US elicits significantly greater compliance than all other experimental treatments in the US. This speaks to the exceptional popularity of the fire department in the US.
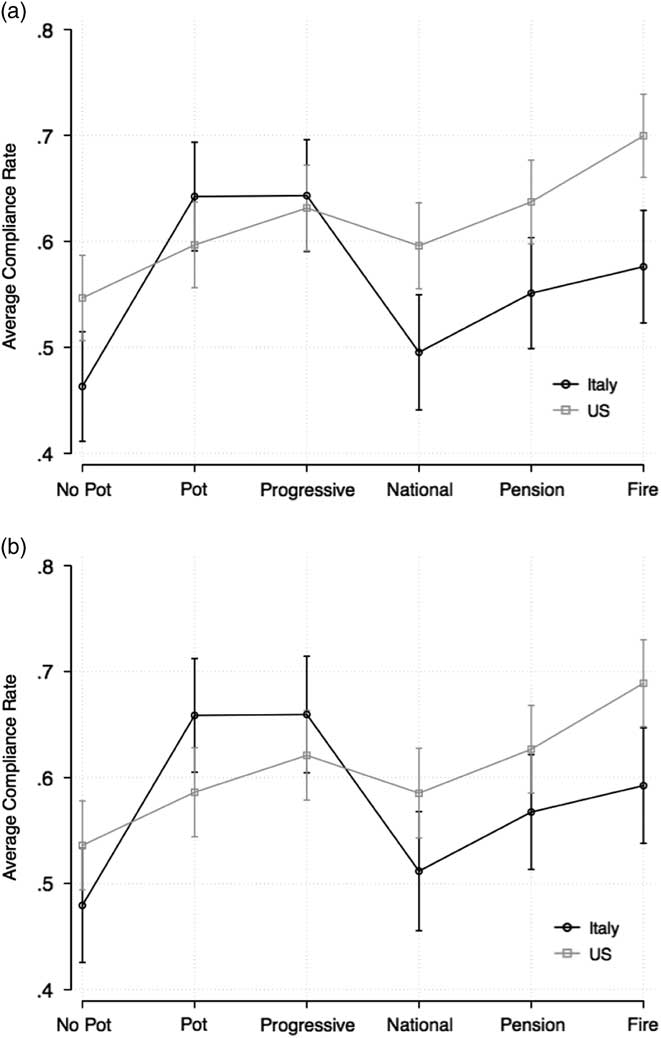
Figure 4 Predicted probabilities for the compliance rate. (a) Predicted probabilities for compliance rate (no trust control). (b) Predicted probabilities for compliance rate (w/trust control)
Table 5 GLS with random effects: average reported income for each subject in each decision round
Note: Robust standard errors in parentheses.
**p<0.01, * p<0.05.
In contrast to the interaction between country and the public goods rounds, there are no significant treatment effects in the institutions rounds, meaning that Italians and Americans respond similarly to the experimental treatment in those rounds. But while the interactions are not significant, Figure 4a demonstrates the levels of compliance are significantly greater in the national government round and the fire department round in the US, as expected. Referring to Figure 4b, the predicted compliance rate in the national government round in the US is approximately 60%, while in Italy it is around 50%. Italians contribute nearly 13% less to the fire department as well. These results are consistent across models 2–4.
In column 5, I add a variable that gauges trust in institutions. Here, I am testing whether trust in government predicts tax compliance, and whether differing levels of trust in government are driving the differences in tax compliance between the US and Italy. First, trust in institutions is a significant predictor of tax compliance, which confirms a large body of literature. Moreover, when introducing the trust in institutions variable to the equation, the significant differences that were uncovered in models 1–4, are no longer present in column 5 when controlling for trust in institutions. Finally, from Figure 4b, it becomes apparent that the differences in compliance observed in Figure 4a in the institutional rounds are no longer significant. This result, however, is somewhat limited by the fact that the trust in institutions variable could be affected by the experimental treatment that was conducted prior to the survey. For example, people who were noncompliant in the tax compliance experiment might rationalise their noncompliance, post-treatment, by saying that they were noncompliant because they do not trust their institutions. Further research is needed to test whether these results hold when the survey is conducted prior to the experiment.
Robustness check
For a final robustness check, I examine the compliance rate in each individual round using ordinary least squares clustered by each subject.Footnote 8 Again, there are only significant differences between Americans and Italians in the institutions round, and when controlling for trust in institutions, those differences disappear.
In sum, Americans tend to be more tax compliant than Italians overall. However, a different picture emerges when examining specific conditions of the experiment. Italians are not less compliant than Americans when their money is sent to an abstract public good (rounds 1–3), and, in fact, Italians increase their compliance more than Americans when introducing a public good to the experiment. But, behaviours tend to diverge when we ask participants to pay taxes to their actual public institutions. Though this supports the argument that individuals are willing to pay for the quality of government that they believe they will receive, trust in those institutions also plays a crucial role in the tax compliance decision.
Discussion and conclusions
This study aimed to examine how perceptions of public institutions affect tax compliance. I argued that differences between countries can be largely explained by individuals’ perception of their country’s public institutions. I investigated this by studying two countries that lie at opposite ends of the tax compliance and institutional quality continuum: the US and Italy. By using a simple tax compliance experiment in which subjects in the US and Italy are asked to make an identical tax decision for three rounds and then asked to pay taxes to their real world institutions for three rounds, I have uncovered that given identical tax decisions, Italians behave on average in a similar way, but when asked to pay taxes to their real-world institutions those behaviours diverge.
While much prior work on tax compliance investigates the effects of enforcement, penalties, trust and the allocation of a public good on tax compliance (Alm et al. Reference Alm, Jackson and McKee1992; Alm et al. Reference Alm, Sanchez and De Juan1995; Santoro and Fiorio Reference Santoro and Fiorio2010), I have yet to come across a study that examines tax behaviour when contributing to real-public institutions. This experimental design allows researchers to test whether some countries are more or less willing to contribute to their specific institutions. I believe the extent that citizens are willing to contribute to those institutions is directly related to citizens’ trust in those institutions. Steinmo (Reference Steinmo2018), for example, suggests that by providing successful public institutions, states can earn citizens’ trust, and as such, bring down monitoring and administrative costs. Therefore, tax compliance can be seen as a coevolutionary process between institutions and national culture.
On the other hand, it is reasonable to assume then that an environment characterised by negative perception of government and low-trust elicits behaviours that are not conducive to tax compliance. According to Steinmo (Reference Steinmo2018), “what citizens believe about their state is in large measure defined by what their state has done and how it has behaved toward them in the past. Simply put, states that have low capacity to enforce their laws and rules tend to have citizens who distrust that state. When citizens distrust their state it is difficult for the state to collect the revenues that could make the citizen more satisfied with their state.”
It is plausible then that the problem of tax evasion stems from low institutional quality that feeds distrust, and distrust reduces tax compliance. Potentially, we can think of trust as a mediator variable between institutions and tax compliance, meaning institutions affect trust in government and trust is causing tax compliance. The fact that trust eliminates the effect of country on tax compliance in my model suggests a mediation effect. Further research should be done to investigate the mediating effects of trust, and whether this relationship is causal or correlational.
Further, this speaks to the importance of citizens’ perception of governmental institutions for creating a positive tax compliance environment. On the one hand, the fact that Italians seem to be just as willing to share with others as Americans in an abstract tax situation leads me to more optimistic policy implications. If it is the case that poor institutional quality shapes negative perception of government and, in that, low trust, then the problem requires institutional fixes. In this case, increasing transparency by specifying what citizens’ tax money is funding has proven to be successful (Stanley and Hartman Reference Stanley and Hartman2018). Another option could be to give citizens more direct control of how their tax money is spent through voting. Torgler (Reference Torgler2002), for example, has demonstrated that direct democracy does limit tax evasion.
On the other hand, institutions are sticky. Over time, institutions generate norms and behaviours that become hard-wired into society. Similarly, trust can be seen as a product of how a particular set of institutions evolved over time. Examining the coevolution of state and society can provide researchers with a good glimpse into why trust varies so greatly between countries. However, this also means that trust in government is not something that is easily had, nor is it something that is easily sustained over time. Trust, though, is an essential feature of any decision that requires cooperation. It is therefore necessary for scholars to examine the mechanisms that can rebuild trust. This coupled with improvements to institutional quality can go along way in establishing a more positive tax compliance environment.
Finally, because of the vast scale of this experiment, our team made methodological sacrifices to increase the size of the experiment and make sure the experiment was carried out identically in all locations, which has also led to some limitations. Future research that examines crossnational differences in tax compliance could build and improve on this design in the following ways: First, we did not reorder the treatments, and thus our design could be affected by sequencing effects, such as anchoring. For reasons provided above, I do not believe that this should have had a large effect on our results, but nonetheless, future studies should control for these sequencing effects. Maybe most importantly, it is essential that researchers limit post-treatment bias when conducting experiments. Montgomery et al. (Reference Montgomery, Nyhan and Torres2016) demonstrate that nearly 50% of studies published in the top political science journals that utilise a controlled treatment design report findings with post-treatment bias. Unfortunately, my measure for trust in institutions was also measured post-treatment and therefore could have been influenced by the experiment. Further research will have to address these issues.
This study has demonstrated that it is important for researchers to provide real-world institutional context to subjects when making tax decisions, because the perceptions of these institutions elicit different behaviours. When comparing countries, subsequent studies should also pay careful attention to the political context at the time of conducting the experiment. Crossnational experiments are extremely vulnerable to context, and thus, researchers need to be aware of context and timing that might affect participants’ behaviours. Finally, further research exploiting similar designs should use institutions that elicit the greatest behavioural response between and within countries. We carefully selected these institutions for this reason, but there is room for further research and designs utilising different institutions that can disentangle the causal effects of perception and trust on compliance and cooperation.
Supplementary material
To view supplementary material for this article, please visit https://doi.org/10.1017/S0143814X18000302
Data Availability Statement
Replication materials can be found at https://dataverse.harvard.edu/dataset.xhtml?persistentId=doi%3A10.7910%2FDVN%2FOBMCZJ.
Acknowledgements
I would like to thank Sven Steinmo, Giulia Andrighetto, Sanne Noyon, Nan Zhang, Dave Bruner, Fred Pampel, Marcelo Bergman, Kim-Lee Tuxhorn, the four anonymous reviewers and the editorial team at the Journal of Public Policy. Funds for this research were provided by the European Research Council (Grant Agreement No. 295675).


