


Introduction
The seminal vesicles (SVs) sit posterior and inferior to the bladder and laterally to the ductus deferens. They are blind-ended tubes containing multiple pockets that are encased within the connective tissues and are approximately 5–7 cm in length.( Reference Drake and Gray 1 ) The SVs are always included within the clinical target volume (CTV) for intermediate and high-risk prostate cancers due to the higher risk of spread.( Reference Liang, Wu and Yan 2 )
Movement of the prostate and SVs has been documented in several studies, with a 2005 paper( Reference Deurloo, Steenbakkers and Zijp 3 ) first identifying a large distal SV displacement. According to a 2012 study,( Reference Stenmark, Vineberg, Ten Haken, Hamstra and Feng 4 ) the distal SVs have also contributed to a greater variability, which compared the dosimetric impact of displacement of the prostate and SVs based on two groups: full SV (FSV) and proximal SV (PSV). They concluded that the SVs move independently of the prostate and that their displacement was greatest in the distal region of the SVs, meaning variability increases with distance from the prostate. Even after correcting for changes in prostate position, the position of the SVs can still vary throughout treatment, compared to the position on the planning computed tomography (CT) scans. This poor correlation between SV and prostate position was confirmed by a 2008 fiducial marker study,( Reference Van der Wielen, Mutanga and Incrocci 5 ) which found variations in SV position is independent of prostate fiducial markers. Despite these findings, it is common to prioritise prostate coverage over SV coverage because the prostate contains the largest portion of the gross tumour volume (GTV). Since SV variation has a small impact on GTV match results, this can increase the simplicity and speed of online image matching.( Reference Deurloo, Steenbakkers and Zijp 3 )
Organ-at-risk (OAR) motion of bladder and rectum has been shown to exceed that of prostate and SV variability,( Reference Deurloo, Steenbakkers and Zijp 3 ) meaning that prostate and SV deformation have long been considered to be second-order effects behind OAR motion.( Reference Roeske, Forman and Mesina 6 – Reference Zelefsky, Crean and Mageras 8 ) The evidence underpinning this, however, largely predates the introduction of image-guided radiotherapy (IGRT) and the resulting change in planning target volume (PTV) margins.( Reference Oehler, Lang and Dimmerling 9 , Reference Gill, Reddy, Campbell, Chen and Pearson 10 ) A 2018 paper( Reference Roch, Zapatero and Castro 11 ) concluded that OAR motion is not the main cause of prostate and SV motion, though it can contribute. There is an element of compromise inherent in consideration of OAR motion, with the PTV margin commonly being reduced posteriorly as per the widely accepted ‘conventional or hypofractionated high-dose intensity modulated radiotherapy for prostate cancer’ (CHHIP) trial protocol( Reference Oehler, Lang and Dimmerling 9 ) to minimise rectal toxicity. Tumours often reside in the posterior peripheral region of the prostate. Some authors have suggested that this factor along with reduction in margin size in this area can lead to tumour underdosage.( Reference Maggio, Gabriele and Garibaldi 12 )
Apart from the posterior margin, traditionally, an equal PTV margin is placed around the prostate and SVs. However, several authors( Reference Deurloo, Steenbakkers and Zijp 3 – Reference Van der Wielen, Mutanga and Incrocci 5 ) confirm that SV motion and deformation are independent of prostate motion and suggest that a separate PTV margin should be considered for the SVs to prevent underdosage. Evidence from a 2012 study( Reference Stenmark, Vineberg, Ten Haken, Hamstra and Feng 4 ) found that a 5-mm margin was adequate for setup of PSV prostate patients and capable of achieving target V 95 coverage in 90% of the patients (mean V 95= 99·6±0 ·8%). For FSV patients, this margin was insufficient, leading to satisfactory V 95 coverage in only 45% of patients (mean V 95=97·9±2 4%). The study clearly identified the need for a separate margin for the prostate and VSs.
Guidance from 2007( Reference Bayman and Wylie 13 ) states that in patients with one or more risk factors [prostate-specific antigen (PSA) >10, Gleason ≥7, >T2a, or percentage of positive biopsy >50], the risk of SV invasion is at least 15% and the VSs should be included in the target volume. Despite this, in clinical IGRT matching, the SV match is secondary to the prostate due to their reduced significance in terms of tumour control. Although the evidence suggests that only the PSVs should be included in the target volume, some authors( Reference Bayman and Wylie 13 ) have suggested that this evidence is contradictory and has an insufficient basis for applying this practice to all patients. Currently there is little data that has considered SV position throughout prostate treatment, and in particular, no evidence related to SV volume variability. Accordingly, the aim of this preliminary investigation was to investigate whether inter-fraction volume variability (IFVV) of the VSs could be present in patients receiving radiotherapy to the prostate.
Methods
Patient datasets
This pilot study aimed to measure SV volumes on planning CT and IGRT cone beam computer tomography (CBCT) images from ten patients treated with radical prostate radiotherapy. Patients were chosen at random from those who had at least four on-treatment images taken between March and July 2018; at the centre in question, this included patients enrolled in the PIVOTAL boost study.( 14 ) Planning CT images were used as a reference, along with four other subsequent CBCT on-treatment images obtained using an on-board imager immediately after patient set-up. Prior to all scans, patients followed a preparation protocol including a full bladder and rectal enema. They were scanned in a head first supine position, and immobilisation included omniboard, foot stocks and headboard for each treatment.
SV delineation
Delineation of the SVs was carried out using treatment planning software by two users; a third-year radiotherapy student (User One) and an experienced outliner (User Two). Credentialing was performed through repeat contouring of 12 training datasets to ensure intra-observer variability was minimised. Three repeats of SV contours (OL1, OL2 and OL3) were performed for every acceptable dataset; this enabled intra-observer variability to be calculated as well as average daily image variability for each patient. The inferior border of the SVs was difficult to distinguish on the CBCT images; therefore, in order to reduce variability due to unclear borders, the inferior border for all fractions was equalised. This was not necessary for the superior borders of the SVs as these were clearly seen and any subsequent variability would be due to volume variation above the defined level.
Data analysis
In this study, the volume of each SV contour on each image was calculated; variance and standard deviation (SD) for intra-observer volume variability (IOVV) and IFVV were then calculated. Comparing these values allowed the impact of intra-observer variability( Reference Roberge, Skamene, Turcotte, Powell, Saran and Freeman 15 ) in outlining to be assessed. If IFVV was much greater than IOVV, then it would indicate a true variation in volume.
Ethical issues
This study was classified as a ‘service evaluation’ by the hospital audit committee; since retrospective anonymised patient data were utilised, consent was not mandate.
Results
Not all the gathered data had sufficient CBCT image quality to allow confidence in delineation of VS volumes. The aim of this preliminary study was to identify whether volume variation occurred in any prostate patients rather than to objectively quantify any potential effect. Accordingly the following two cases illustrate results confirming that this is a potential issue worthy of further quantitative study. Tables 1–4 present measured SV volumes per case (Cases One and Two), user (Users One and Two), fraction (a–e) and outlining (OL1–3).
Table 1. IFVV for Case One and User One
Abbreviations: IFVV, inter-fraction volume variability; SD, standard deviation.
Table 2. IFVV for Case One and User Two

Abbreviations: IFVV, inter-fraction volume variability; SD, standard deviation.
Table 3. IFVV for Case Two and User One
Abbreviations: IFVV, inter-fraction volume variability; SD, standard deviation.
Table 4. IFVV for Case Two and User Two

Abbreviations: IFVV, inter-fraction volume variability; SD, standard deviation; SV, seminal vesicle.
Noteworthy examples from these data are depicted in Figure 1, with overlaid contours highlighting volumetric and positional variation in Case One. In particular, a large volume variation can be seen in the bottom left image. In contrast, the bottom right image demonstrates an identical volume but clear positional variation. Variability in the mean outlined volumes is depicted graphically for each case and user in Figure 2. The data anonymisation process removed date stamps from the datasets, so the chronological order of fractions is unknown.
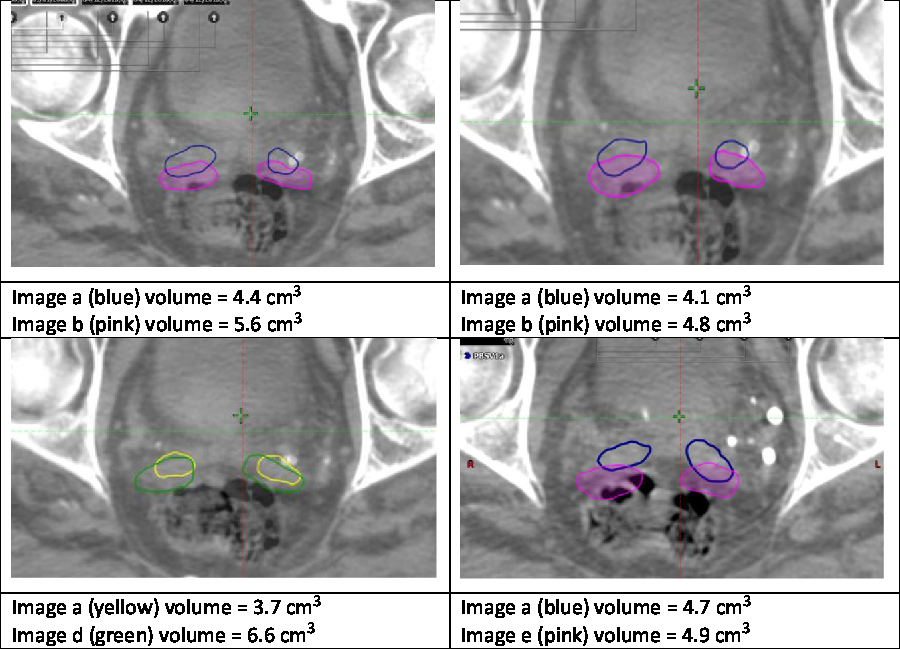
Figure 1. Example variation in Case One.
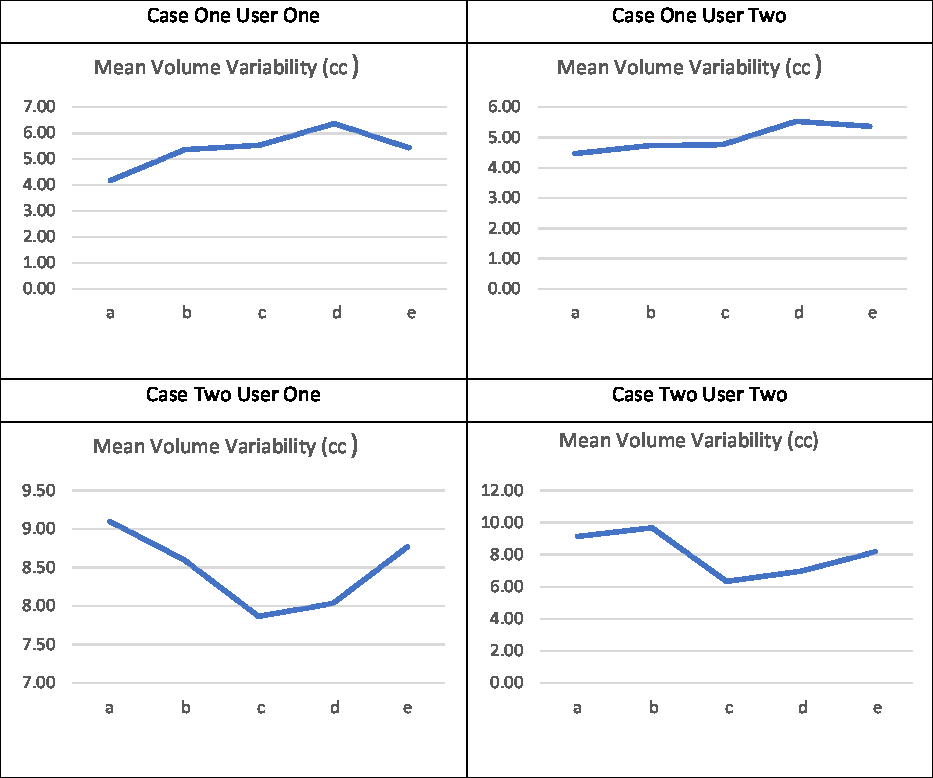
Figure 2. Mean volume variability (in cm3).
Summary of results
It can be seen that for these selected cases there was considerable variation in SV volume, which was much higher than the intra-observer outlining variability, as seen in Table 5. The smallest and largest volumes for each patient and user were used to calculate the maximum percentage increase in volume as seen in Table 6.
Table 5. Summary of SV volume variation
Abbreviations: IFVV, inter-fraction volume variability; IOVV, intra-observer volume variability; SD, standard deviation; SV, seminal vesicle.
Table 6. Smallest and largest volumes recorded and percentage increases
Abbreviation: SV, seminal vesicle.
Discussion
Limitations
There were several key limitations to this study. CBCT image quality for many of the sampled datasets was insufficient to outline SV volumes with confidence. The cases presented here were the exception, and future work will need to draw on alternative imaging modalities to quantify variation with confidence. In addition, neither outliner in this study was a clinician; this was ameliorated to some extent through training, credentialing and repeat outlining. For this phase of the study, expertise and confidence in outlining was felt to be more valuable than clinical interpretation. Intra-observer variability was measured in order to eliminate this as an explanation for the findings. The accuracy of intra-observer variation has been estimated to be around 11% compared to accuracy of shape variation which was around 5%.( Reference Deurloo, Steenbakkers and Zijp 3 ) Time between intra-observer delineation seems to affect variability, with short-term intra-observer variability demonstrated to have no significant effect on treatment planning.( Reference Fiorino, Reni, Bolognesi, Cattaneo and Calandrino 16 ) In this study, outlining was all performed within 3 days to minimise this potential impact. The small number of cases, while normally a limitation, was a strength in this instance as the aim of the work was to identify the potential for this variation and not to measure it. The detection of two cases of volume variation within such a small sample strongly suggests a high overall incidence in the wider population.
Causes of variability
It is clear from the findings of this pilot study that in at least some cases, there is potential for inter-fractional SV variability in prostate patients. Future work intends to quantify the magnitude and frequency of these changes as well as identify impacting variables. The shrinking effect of hormone therapy on the prostate, for example, is well documented.( Reference Roch, Zapatero and Castro 11 ) Yet none of the reported data includes SV volumes, so it may be useful to study the effects of these in SV variability in future studies.
Frequency of ejaculation has certainly been demonstrated to impact on SV volume in a number of studies in healthy individuals.( Reference Barrett, Tanner, Gill, Slough, Wason and Gallagher 17 , Reference Kabakus, Borofsky and Mertan 18 ) A 2017 magnetic resonance image (MRI)-based study identified significant changes in 13 out of the 15 participants, with mean volumes decreasing from 6·45 to 4 80 cm3.( Reference Barrett, Tanner, Gill, Slough, Wason and Gallagher 17 ) This variation compares well with the variation identified in this study and would suggest that ejaculation while on radiotherapy could be a factor impacting on SV volume and position. It is unknown how relevant these findings would be when applied to the more challenging prostate radiotherapy cohort and their well-documented sexual function issues.( Reference Mahmood, Aksinija and Creed 19 ) Recent findings, however, indicate the therapeutic value of both medication and regular sexual activity in penile rehabilitation and long-term preservation of sexual function.( Reference Doherty and Bridge 20 )
Clinical implications of variability
It is unknown what the true incidence and extent of SV volume is among radiotherapy patients or, indeed, whether the variability is associated with clinical outcomes. It is already clear that SV motion independent of prostate position is a problem,( Reference Stenmark, Vineberg, Ten Haken, Hamstra and Feng 4 ) and that existing PTV margins may not be appropriate in all cases with distal SV involvement. This preliminary work compounds these findings by detecting volume variation and, if significant, this may warrant individual derivation of PTV margins, according to the measured variability. Variability may impact on dosimetry and local control rates, and future studies using daily MR imaging alongside monitoring and control of potential variables will aim to identify the true clinical implications of this study’s suggested variability.
Conclusion
This study concluded that there is potential for daily SV volume variability in patients receiving prostate radiotherapy, with up to 78·38% variation identified. More research is needed to determine how many and which patients this could impact as well as to quantify the magnitude of variation and potential clinical impact. Future studies are planned using MRI data, monitoring of variables and a larger number of patients.
Author ORCIDs
Pete Bridge 0000-0001-7704-9812
Acknowledgements
The authors wish to acknowledge the invaluable support of Dr Isabel Syndikus with this study.


 Open access