Introduction
Over half of the global tropical forests today are secondary (Poorter et al. Reference Poorter, Bongers, Aide, Zambrano, Balvanera, Becknell and Boukili2016), and a large portion of them are present in plantation forests (Parrotta Reference Parrotta, Lieth and Lohmann1993). Considering the rapidly expanding area of plantation forests, several studies have investigated their biodiversity value (Bremer & Farley Reference Bremer and Farley2010, Brockerhoff et al. Reference Brockerhoff, Jactel, Parrotta, Quine and Sayer2008, Gibson et al. Reference Gibson, Lee, Koh, Brook, Gardner, Barlow, Peres, Bradshaw, Laurance, Lovejoy and Sodhi2011, Hartmann et al. Reference Hartmann, Daoust and Bigué2010). Although plantation forests are often perceived as a promising tool for restoring degraded landscapes (Lamb et al. Reference Lamb, Erskine and Parrotta2005), their effects on native biodiversity are debated (Brockerhoff et al. Reference Brockerhoff, Jactel, Parrotta, Quine and Sayer2008).
Eucalyptus plantations occupy an area of about 4 million ha in India (Varghese et al. Reference Varghese, Harwood, Bush, Baltunis, Kamalakannan, Suraj, Hegde and Meder2017). Several reports document the associated plant diversity for non-eucalyptus (Ambinakudige & Sathish Reference Ambinakudige and Sathish2009, Harikrishnan et al. Reference Harikrishnan, Vasudevan, Udhayan and Mathur2012, Mohandass et al. Reference Mohandass, Chhabra, Pannu and Beng2016) and eucalyptus plantations (George et al. Reference George, Kumar and Rajiv1993, Rashmi et al. Reference Rashmi, Vijai, Waman, Rajagopal and Raj1987, Selwyn & Ganesan Reference Selwyn and Ganesan2009, Srimathi et al. Reference Srimathi, Schmerbeck, Gärtner, Naudiyal, Schmerbeck and Kumar2012). With the exception of Selwyn & Ganesan (Reference Selwyn and Ganesan2009), these studies only provide a one-time documentation of biodiversity, resulting in a lack of understanding of long-term succession dynamics.
Plantation forests established on previously clear-felled primary forests (and consequently abandoned) are structurally similar to secondary forests, but differ from them by the presence of planted species (Brown & Lugo Reference Brown and Lugo1990). Between such (non-plantation) secondary forests and primary forests, no clear pattern for species richness has been observed (Brown & Lugo Reference Brown and Lugo1990). For above-ground biomass, Brown & Lugo (Reference Brown and Lugo1990) report a rapid accumulation in the first 15 y after disturbance, but no clear pattern after that, which highlights the need to include a wider dataset.
Regarding functional aspects of secondary forest succession, we would expect that the pioneer species are replaced by closed-canopy/old-growth species over time (Richards Reference Richards1996). However, this trajectory might differ for vegetation in plantations that are adjacent to other land-use types or primary forest (Gonzales & Nakashizuka Reference Gonzales and Nakashizuka2010). For example, native forests beneath pine plantations in Sri Lanka reveal a dominance of pioneer and bird-dispersed species and conversely lower proportions of old-growth species (Ashton et al. Reference Ashton, Gunatilleke, Gunatilleke, Singhakumara, Gamage, Shibayama and Tomimura2014). Several old-growth species in Asia have poor dispersal abilities and also a larger seed size compared to the pioneer species (Gunatilleke & Ashton Reference Gunatilleke and Ashton1987, Osuri et al. Reference Osuri, Chakravarthy, Mudappa, Raman, Ayyappan, Muthuramkumar and Parthasarathy2017). Hence, succession guilds, dispersal guilds and seed size are interlinked (Russo et al. Reference Russo, Porrs, Tan, Dennis, Schupp, Green and Westcott2007). In this context, there are limited data from South Asia for an integrated structural and functional understanding of the facilitative roles of plantation forests (Ashton et al. Reference Ashton, Gunatilleke, Gunatilleke, Singhakumara, Gamage, Shibayama and Tomimura2014).
We aim to understand the structural and functional succession dynamics of the regenerating native forest under eucalyptus plantations over 11 y in the southern Western-Ghats of India. In the eucalyptus plantations at Kalakad-Mundanthurai Tiger Reserve (KMTR), Selwyn & Ganesan (Reference Selwyn and Ganesan2009) documented the composition of such a regenerating forest in 2005 and we use this as our baseline. Through a comparison between our data collected in 2016 with that collected in 2005, clubbed with data from the neighbouring primary forest, we test the hypotheses that: (1) For the plantation forest from 2005–2016, in terms of structure – species richness, densities and basal area will increase over time (Barbosa et al. Reference Barbosa, Benato, Cavalheiro and Torezan2009, Richards Reference Richards1996). In terms of functional traits – densities of pioneer, bird-dispersed and small-seeded species (suit of traits associated with early-succession species) will decrease over time (and a converse increase in old-growth species) (Richards Reference Richards1996); (2) In terms of structure – compared to the primary forest, edge effects will increase species richness and density in the plantation forest (Martin et al. Reference Martin, Newton and Bullock2013, Tomimura et al. Reference Tomimura, Singhakumara and Ashton2012). In terms of functional traits – the plantation forest will have lower densities of large-seeded, mammal-dispersed and closed-canopy (suit of traits associated with old-growth species) tree species compared with the primary forest (Tomimura et al. Reference Tomimura, Singhakumara and Ashton2012); and (3) Regeneration of old-growth species will decline with increasing density of planted eucalyptus.
Methods
Study area
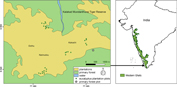
We carried out the study in eucalyptus (Eucalyptus cf. globulus) plantations of Kakachi and Nalmukku in KMTR which is located in the Agasthyamalai range of the southern Western-Ghats global biodiversity hotspot (Figure 1). Several parts of KMTR are comprised of eucalyptus plantations that were established in clear-felled primary forest in the 1960s–1990s for timber that was needed as fuel for the tea industry. Because of the felling ban that followed, the plantations have been relatively undisturbed since then. As a result, many of these plantations still have primary forest or tea estates in their immediate vicinity. The ‘plantations’ mapped in Figure 1 of about 26.3 km2 in area, include not only eucalyptus plantations of varying ages, but also patches of clear-felled (and regenerating) forest patches and tea estates. The continuous primary forest around these plantations are classified as mid-elevation wet-evergreen forest with Cullenia exarillata–Aglaia bourdillonii–Palaquium ellipticum as the dominant community (Ganesh et al. Reference Ganesh, Ganesan, Devy, Davidar and Bawa1996). Further details on the study area can be found in Chetana & Ganesh (Reference Chetana and Ganesh2012), Ganesh et al. (Reference Ganesh, Ganesan, Devy, Davidar and Bawa1996) and Ganesh & Davidar (Reference Ganesh and Davidar2001).
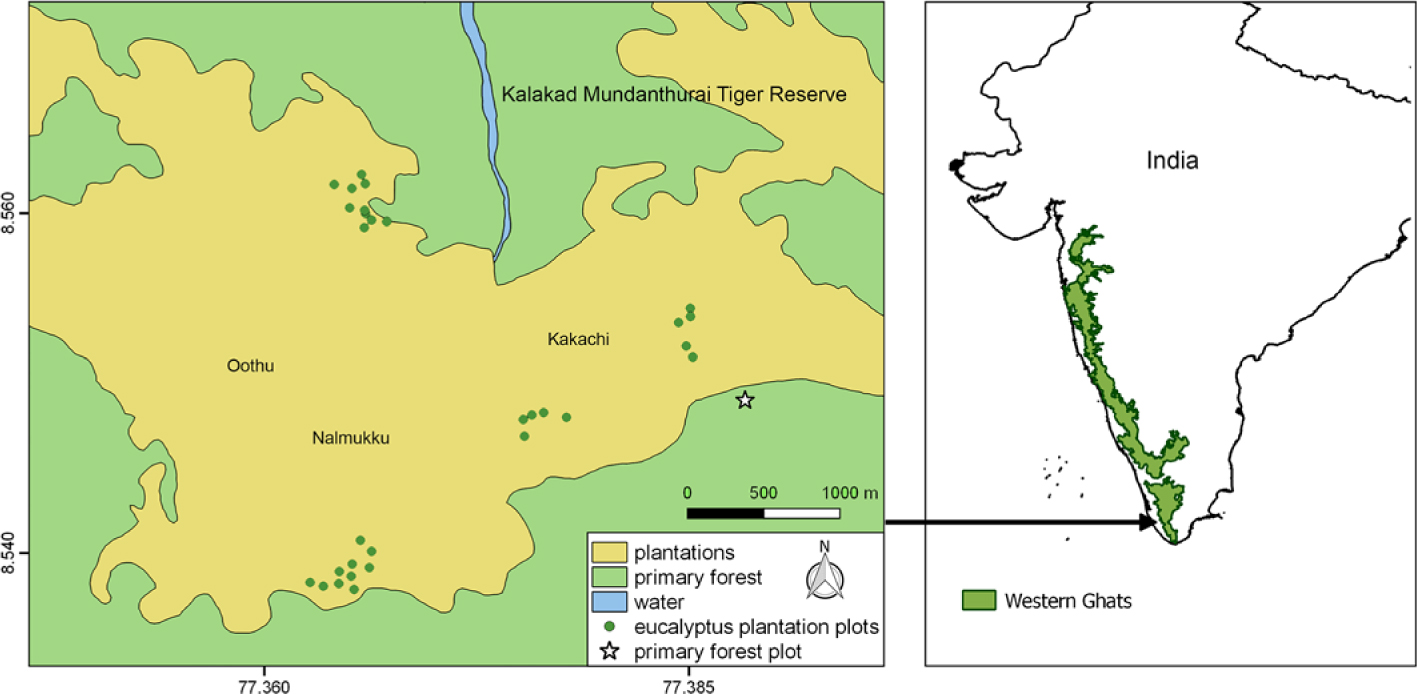
Figure 1. Map of the study area showing location of Kalakad-Mundanthurai Tiger Reserve, India showing area of the plantations and primary forest. Note that ‘plantations’ also include patches of clear-felled forest patches and tea estates that have not been separately mapped. The four clusters of green dots represent the four blocks of sampling locations, with each dot representing a 10 × 10-m quadrat sampled in 2016. The Fern-house primary forest plot is shown as a star. (Map modified from https://indiabiodiversity.org/.)
Vegetation data of the plantation forest
We undertook data collection in the field for vegetation composition in the plantation forest in July 2016 and established our sampling quadrats in the 25-y-old eucalyptus plantations mentioned by Selwyn & Ganesan (Reference Selwyn and Ganesan2009) (which were 36-y-old in 2016). The sampling method was a replica of that followed by Selwyn & Ganesan (Reference Selwyn and Ganesan2009) so as to get comparable results. In the same four blocks (that were at least one km away from each other) as that chosen by Selwyn & Ganesan (Reference Selwyn and Ganesan2009), we randomly selected thirty 10 × 10-m, non-contiguous quadrats and ensured that they were at least 50 m apart from one another. We acknowledge that 50 m might not be sufficient for a true replicate, but in order to avoid confounding factors including changing topography, we had to use a 50-m cut off (as used by Osuri et al. Reference Osuri, Chakravarthy, Mudappa, Raman, Ayyappan, Muthuramkumar and Parthasarathy2017). In each of these blocks, five to nine quadrats were sampled and all blocks were pooled for analysis. The number of quadrats varied in each block because the 25-y-old and the 40-y-old eucalyptus plantations are intermixed and we studied only the former. The mean approximate distance of the 2016 plantation forest plots from the nearest primary forest was 275 m (range = 10–800 m). While selecting the plot location, we excluded areas with recent prominent anthropogenic disturbances as indicated by cut stems. In each quadrat, we measured the dbh (diameter at breast height; 1.3 m height from ground level) of the trees which had a dbh ≥1 cm. We omitted plants which were classified as shrubs through literature and/or primary observations (also from the 2005 data). These shrubs account for a relatively small percentage of the total woody biomass and have hence also been omitted from the long-term data of the primary forest plots. For multi-stemmed trees, we measured the dbh and calculated the basal area of all the stems separately and summed (the basal areas) for analyses. We considered trees having a dbh ≥10 cm as adults (trees) and those between 1 cm and 10 cm as saplings. To count the number of seedlings (with stem diameters <1 cm), we established sub-quadrats of 1 × 1-m at the four corners of each 10 × 10-m quadrat. We identified all plants on field using standard literature (Gamble Reference Gamble1915).
Sampling effort
For the mid-elevation primary forest in the study area, the species-accumulation curve saturates by about 30 (10 × 10-m) quadrats (Ganesh et al. Reference Ganesh, Ganesan, Devy, Davidar and Bawa1996). We hence established 30 such quadrats in the plantations and considered 30 quadrats for the primary forest data as well. Selwyn & Ganesan (Reference Selwyn and Ganesan2009) had established 40 quadrats in 2005 and in order to make the data comparable with ours, we randomly selected 30 quadrats out of these for all further analyses. We acknowledge our limitations of using 10 × 10-m quadrats which have a high edge: area sampled ratio but did so in order to make a valid comparison. We also believe that sampling a total area of 0.3 ha is in general, small, and might affect the results in some ways although the broader patterns might be similar given the species-accumulation curves.
Vegetation data of the primary forest
The Ashoka Trust for Research in Ecology and the Environment (ATREE) has established three permanent 1-ha plots during 1990 at three different sites within KMTR (https://www.atree.org/node/164) and are being regularly inventoried since 1995 (and every 5 y thereafter). Among these plots, we selected the Fern-house plot (8.549010 N, 77.388296 E) because of its proximity to the plantation forest so that it is comparable with the plantation forest data. In the permanent plot, out of the one hundred 10 × 10-m quadrats, 30 were randomly selected and analysed for similar parameters between 2004–2016. Since the census of permanent plots involved measuring only trees (≥10 cm dbh), data for the other two life stages viz. saplings and seedlings were not available for comparison.
Dispersal and successional guilds
We classified all the plants encountered into their dispersal modes and succession stages following Chetana & Ganesh (Reference Chetana and Ganesh2012), Ganesh & Davidar (Reference Ganesh and Davidar2001), and T. Ganesh (pers. comm.) with a few modifications as follows. For both past (2005) as well as current (2016) data, we classified all species into their dispersal modes: birds, mammals, autochorous and unknown by merging a few categories mentioned in Ganesh & Davidar (Reference Ganesh and Davidar2001) (e.g. large birds and birds was considered as birds for analyses). Similarly, we classified all the species into the categories: gap, closed-canopy, introduced and unknown for succession stages following Ganesh & Davidar (Reference Ganesh and Davidar2001) instead of the classification made by Selwyn & Ganesan (Reference Selwyn and Ganesan2009) into pioneer, secondary and climax. We referred to pioneer or early succession species as gap species, and climax, late or old-growth species as closed-canopy species. We also made a separate category for the introduced species including Eucalyptus sp., Acacia sp. and Aleurites moluccana (L.) Willd. The classification by Selwyn & Ganesan (Reference Selwyn and Ganesan2009) involved a subjectively defined stage of secondary species, and in order to ensure a reasonable comparison, we omitted this classification and followed the one by Ganesh & Davidar (Reference Ganesh and Davidar2001) for both the plantation and primary forest data.
Seed size classes
We classified all species reported into three seed-size classes based on the seed length (small: <1 cm, medium: 1–3 cm, large: >3 cm) following Osuri et al. (Reference Osuri, Chakravarthy, Mudappa, Raman, Ayyappan, Muthuramkumar and Parthasarathy2017). For seed size, we used seed length as a proxy, and was considered as the diaspore excluding the dispersal morphology (Russo et al. Reference Russo, Porrs, Tan, Dennis, Schupp, Green and Westcott2007). We obtained seed length data from various published and unpublished sources (see Appendix 1 for sources).
Data analyses
To compare densities, species richness and basal areas across years, guilds and life stages, we plotted mean values with 95% confidence intervals (CI). We considered values to be significantly different across groups if their confidence intervals did not overlap with each other. To test if there have been significant changes in the seed size classes of communities, we expressed the densities per seed class as a proportion of the total density pooled for all quadrats for that year/area. Then, to check if the proportion of total individuals of a particular seed-size class varied across years, we performed a two-proportion Z-test (Zar Reference Zar1999).
In order to compare the size-class distribution of the plantation forest with the primary forest, we plotted the relative percentage of individuals across six dbh (interval of 10 cm) classes for trees.
At the community level, to understand the compositional difference between the plantation and primary forests, we performed a non-metric multidimensional scaling (NMDS) ordination for only trees, due to lack of sapling and seedling data from the primary forest. We square-root-transformed the abundance data and used the Chord distance (Legendre & De Cáceres Reference Legendre and De Cáceres2013) for the visualization of results in two dimensions. We also correlated the NMDS axes with the functional groups using Generalized Linear Models (GLMs) to understand the variables driving the patterns.
Finally, to test the effects of eucalyptus density on the plantation forest structure and functional groups, we used a multivariate linear regression (McCullagh & Nelder Reference McCullagh and Nelder1989). Data from both the years (2005 and 2016, total 60 quadrats) were pooled and log (1+x)-transformed in order to reduce the variability (Zar Reference Zar1999). Eucalyptus density was set as the predictor variable and species richness (excluding eucalyptus), density (excluding eucalyptus), dispersal guilds, succession guilds and seed-size classes were set as dependent variables.
For all the data analysis, we used PAST v3.0 (Hammer et al. Reference Hammer, Harper and Ryan2001), MINITAB v13 (Minitab I.N.C., Pennsylvania State University, USA) and STATISTICA v12 (StatSoft, I. N. C., Tulsa, USA).
Results
Species richness and density per plot
With the plantation and primary forest samplings combined, we recorded 75 species in total (Appendix 1). The mean species richness per plot increased by 67% (from 2.9 species per plot, 95% CI = 2.3–3.6 to 4.9 species per plot, 95% CI = 4.2–5.6) over time for trees in the plantation forest (Figure 2a). Mean species richness of trees in the 2016 plantation forest was similar to that of the primary forest. There was a decline in mean density of saplings (from 38.1 saplings per plot, 95% CI = 28.9–47.3 to 21.4 saplings per plot, 95% CI = 17.2–25.7) and seedlings (from 5.8 seedlings per plot, 95% CI = 4.5–7.0 to 3.3 seedlings per plot, 95% CI = 2.2–4.4) in the plantation forest over time (Figure 2b). The mean density of trees in the plantation forest in 2016 (13.5 trees per plot, 95% CI = 12.2–14.7) was 87.9% greater than that of primary forest (7.16 trees per plot, 95% CI = 6.10–8.22).
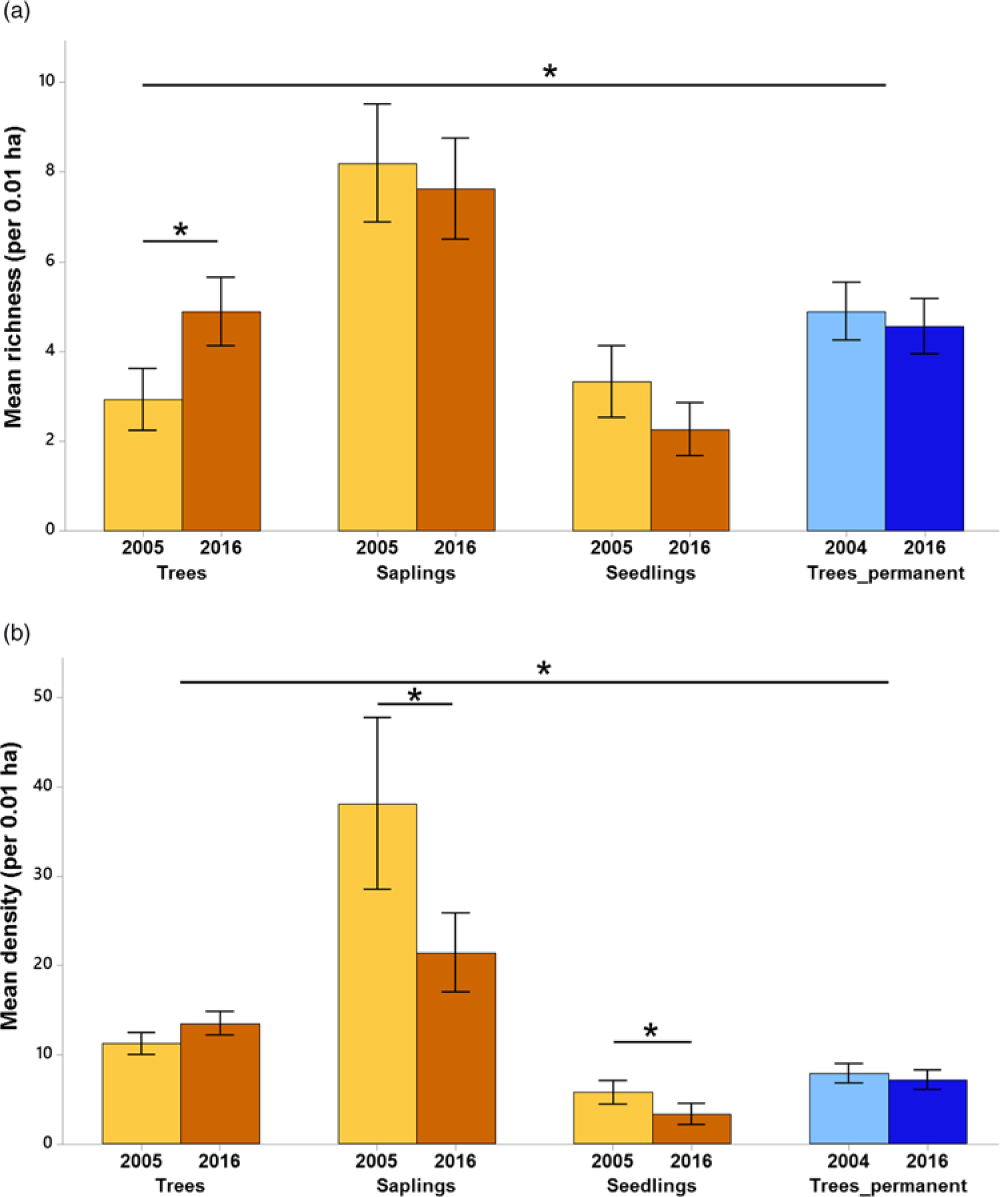
Figure 2. Species richness (a) and density of individuals (b) across years and life stages in Kalakad-Mundanthurai Tiger Reserve, India. The bars for trees, saplings and seedlings are for the plantation forest (ochre), whereas those for Trees_permanent represent data for the primary forest trees (blue). Lighter shades represent past data (2005 for the plantation forest and 2004 for the primary) and darker shades represent current data (2016 for both the forests). Values for seedlings are per 0.0004 ha. Bars represent means and error bars represent the 95% confidence intervals. Significant changes indicated by *.
Basal area and size-class distribution
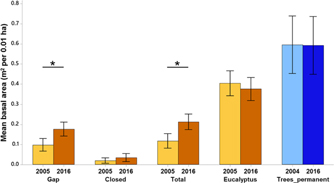
Mean basal area of eucalyptus (trees + saplings) did not change significantly over 11 y. The mean total basal area of native stems in the plantation forest (trees + saplings, excluding eucalyptus) increased by 80.1% from 0.11 m2 per 0.01 ha (95% CI = 0.08–0.15) in 2005 to 0.21 m2 per 0.01 ha (95% CI = 0.17–0.25) in 2016, and so did the basal area of gap species (Figure 3). The primary forest had a greater percentage (8.37%) of large diameter (>60 cm) trees as compared with the plantation forest (0.85%).

Figure 3. Changes in mean basal area across time – of gap, closed-canopy species, total (all species except eucalyptus), eucalyptus in the plantation plots (ochre) and trees of the primary forest labelled as Trees_permanent (blue) in Kalakad-Mundanthurai Tiger Reserve, India. Lighter shades represent past data (2005 for the plantation forest and 2004 for the primary) and darker shades represent current data (2016 for both the forests). Data for primary forest does not include saplings (1–10 cm dbh). Bars represent means and error bars represent the 95% confidence intervals. Significant changes indicated by *.
Composition at the community level
The non-metric multidimensional scaling showed distinct clusters for tree-composition of the plantation as well as the primary forest (stress value = 0.22). The NMDS Axis 1 was positively correlated with density of closed-canopy (b = 0.63; Adjusted R2 = 0.391; P <0.001) and negatively with autochorous species (b = −0.61; Adjusted R2 = 0.369; P <0.001). Axis 2 was negatively correlated with both density of gap (b = −0.65; Adjusted R2 = 0.413; P <0.001) and bird-dispersed species (b = −0.59; Adjusted R2 = 0.339; P <0.001). The ordination graph showed three clusters – one each for the plantation forest sampled during 2005 and 2016, and one for the primary forest (Figure 4). The primary-forest plots sampled during 2004 and 2016 overlapped considerably, indicating high compositional similarity. However, the 2005 and 2016 plantation-forest plots formed clusters that are spaced away from each other indicating compositional dissimilarity and that, over time, there has been a compositional shift. Further, in Figure 4, since the 2016 plots are aligned closer to the primary-forest plots, we can infer that the slight compositional shift has made the 2016 plantation forest resemble the primary forest only to a limited extent.

Figure 4. NMDS ordination plot showing clustering based on compositional dissimilarity for trees in Kalakad-Mundanthurai Tiger Reserve, India. The dots in ochre are for the plantation forest, whereas those in blue are for the primary forest. Lighter shades represent past data (2005 for the plantation forest and 2004 for the primary) and darker shades represent current data (2016 for both the forests).
Succession and dispersal guilds
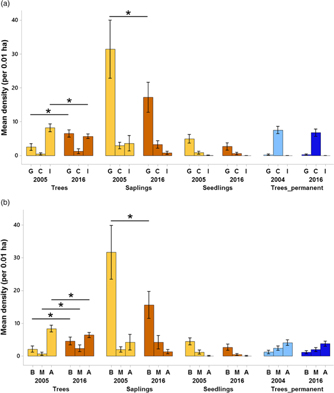
Regarding changes in succession guilds over time in the plantation forest, for trees, the mean density of gap species increased by 156% (from 2.53 trees per plot, 95% CI = 1.57–3.49 to 6.5 trees per plot, 95% CI = 5.47–7.52) over 11 y (Figure 5a). For the saplings, gap species declined by 45.2% (from 31.4 saplings per plot, 95% CI = 23.2–39.6 to 17.2 saplings per plot, 95% CI =13.0–21.4) over time. A comparison of trees from plantation and primary forest for the 2016 enumeration showed that the densities of closed-canopy species were 446% higher in the primary forest (mean = 6.7 trees per plot, 95% CI = 5.70–7.75) than the plantation forest (mean = 1.2 trees per plot, 95% CI = 0.54–1.92).
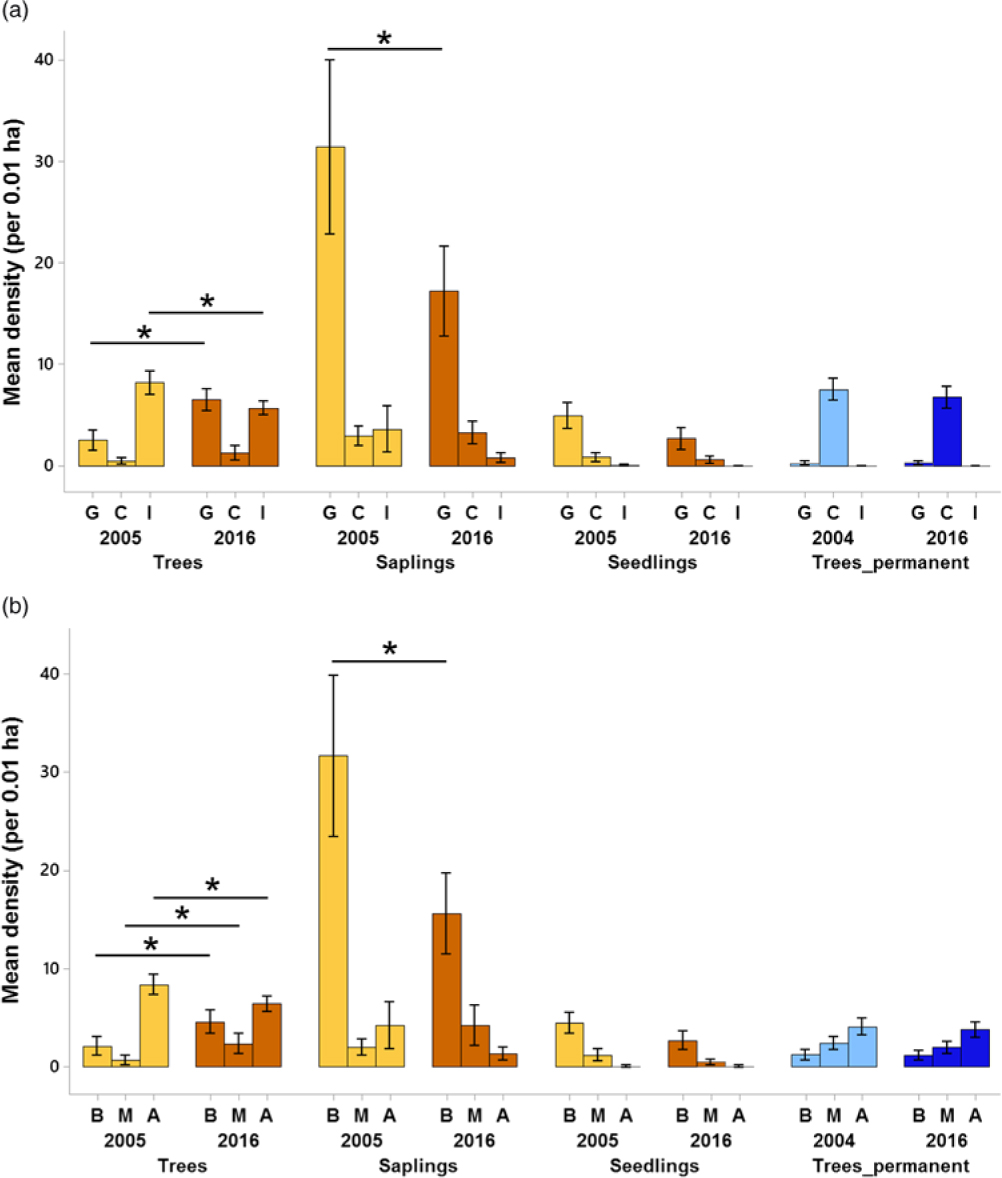
Figure 5. Changes in succession guilds (a) and dispersal guilds (b) across time for all the life-stages in Kalakad-Mundanthurai Tiger Reserve, India. The bars for trees, saplings and seedlings are for the plantation forest (ochre), whereas those for Trees_permanent represent data for the primary forest trees (blue). Lighter shades represent past data (2005 for the plantation forest and 2004 for the primary) and darker shades represent current data (2016 for both the forests). For a, G = gap species, C = closed-canopy species, I = introduced species, for b, B = bird dispersed, M = mammal dispersed, A = autochorous. Species with unknown status are not plotted. Values for seedlings are per 0.0004 ha. Bars represent means and error bars represent the 95% confidence intervals. Significant changes indicated by * (except those between plantation plots and primary forest).
Changes in the dispersal guilds were as follows (Figure 5b). For trees in the plantation forest, bird and mammal-dispersed species increased by 116% (from 2.13 trees per plot, 95% CI = 1.21–3.05 to 4.6 trees per plot, 95% CI = 3.48–5.71) and 238% (from 0.7 trees per plot, 95% CI = 0.20–1.19 to 2.36 trees per plot, 95% CI = 1.39–3.33) respectively over time and autochorous ones declined by 23.1% (from 8.36 trees per plot, 95% CI = 7.37–9.35 to 6.43 trees per plot, 95% CI = 5.68–7.17). For saplings, bird-dispersed species declined by 50.7% (from 31.7 saplings per plot, 95% CI = 23.8–39.53 to 15.6 saplings per plot, 95% CI = 11.64–19.5). In 2016, the primary forest had 69.3% (mean = 3.8 trees per plot, 95% CI = 3.02–4.57) lower densities of autochorous tree species than the plantation forest (mean = 6.43 trees per plot, 95% CI = 5.68–7.17).
Changes in seed-size classes
In the plantation forest, for saplings, the proportion of individuals belonging to small-seeded species declined by 18.2% (Z = 7.35; P <0.001), whereas those of medium-seeded species increased by 116% (Z = −7.2; P <0.001) over time (Figure 6). When we compared between trees of the primary and plantation forest, the primary forest had 138% greater proportion of trees belonging to large-seeded species (for 2016: Z = –3.78; P <0.001). We could also test that seed size classes showed significant associations with both successional (χ2 test, P <0.001) and dispersal guilds (χ2 test, P <0.001).

Figure 6. Changes in seed size classes across time and life-stages in Kalakad-Mundanthurai Tiger Reserve, India. The bars with ochre background (trees, saplings and seedlings) represent the plantation forest, whereas those with blue background (Trees_permanent) represent the primary forest trees. Each bar represents total density of individuals for that year and life stage and shaded regions within it correspond to proportion of total individuals of that seed size class. Significant changes indicated by pairs of same letters, for example, a,a represents significant difference between the proportion of large-seeded species of trees in plantation forest during 2005 and those of primary forest during 2004.
Effect of eucalyptus density
Overall, eucalyptus density had mixed effects on forest regeneration. For trees and saplings, we observed a significantly negative relationship between eucalyptus density and density of closed-canopy (slope: −0.458, P <0.05) and large-seeded species (slope: −0.486, P <0.001), and a positive relationship with only small-seeded species (slope: 0.383, P <0.05). For the seedlings, except for closed-canopy species, all other classes showed a significant and positive relationship with increasing eucalyptus density.
Discussion
The present work contributes towards bridging an important knowledge gap on the role of exotic tree plantations (other than pine) facilitating native forest regeneration in South Asia (Ashton et al. Reference Ashton, Gunatilleke, Gunatilleke, Singhakumara, Gamage, Shibayama and Tomimura2014). To our knowledge, this is the first study that evaluates both structural and functional aspects of regeneration in an Indian eucalyptus plantation landscape.
For the structural aspects, we found evidence for the hypotheses that species richness and basal area will increase (Brown & Lugo Reference Brown and Lugo1990, Poorter et al. Reference Poorter, Bongers, Aide, Zambrano, Balvanera, Becknell and Boukili2016, Richards Reference Richards1996) in the plantation forests over 11 y only for trees; whereas density of trees remained unchanged and that of saplings and seedlings, declined over time. It must be noted that this decline in the density of saplings is associated with increase in the density of trees over time, but the same is not true for seedling to sapling transition, indicating higher mortality at this stage. Tree richness in the plantation forest was similar to that of primary forest, but tree densities were significantly higher as predicted. Studies in the Neotropics have also found a similar pattern of increasing richness for trees over time in plantations (Barbosa et al. Reference Barbosa, Benato, Cavalheiro and Torezan2009) and comparable richness of saplings between plantations (albeit of native trees) and primary forests (Lima & Vieira Reference Lima and Vieira2013).
Regarding functional aspects of plantation forest, we found evidence to support the hypothesis that gap, bird-dispersed and small-seeded species decline over time, but only for the sapling stage (Richards Reference Richards1996). We could also support the hypothesis that primary forests support greater densities of closed-canopy, large-seeded species (old-growth species) than plantation forests (Ashton et al. Reference Ashton, Gunatilleke, Gunatilleke, Singhakumara, Gamage, Shibayama and Tomimura2014). These findings are consistent with other studies in plantations that have recorded a dominance of bird-dispersed, small-seeded pioneers in plantations as compared with primary forests (Gonzales & Nakashizuka Reference Gonzales and Nakashizuka2010, Parrotta et al. Reference Parrotta, Knowles and Wunderle1997, Tomimura et al. Reference Tomimura, Singhakumara and Ashton2012). Apart from plantation forests, such functional shifts to early-succession stages has also been reported from another disturbed site in the Western Ghats and also in forest fragments in India and globally (Anitha et al. Reference Anitha, Joseph, Chandran, Ramasamy and Prasad2010, Osuri et al. Reference Osuri, Chakravarthy, Mudappa, Raman, Ayyappan, Muthuramkumar and Parthasarathy2017, Santo-Silva et al. Reference Santo-Silva, Almeida, Melo, Zickel and Tabarelli2013).
Demographic filters
From the results, it is clear that the significant declines in gap/bird-dispersed and small-seeded species in one stage (saplings) is not associated with an increase in closed-canopy/large seeded species in the other stage (trees). This directional compositional change at the seedling/sapling stages might be an indicator for the future tree community composition. Santos et al. (Reference Santos, Peres, Oliveira, Grillo, Alves-Costa and Tabarelli2008) has summarized four potential mechanisms underlying such demographic filters at each life stage for closed-canopy species in forest fragments, and we believe that these might apply to our case as well. The first mechanism is reduced seed flux of closed-canopy species which depends on habitat occupancy of mammals and large birds. In KMTR, Raman & Sukumar (Reference Raman and Sukumar2002) report that habitat alterations negatively affect rare and large-bodied birds. From this study, we infer that reduction in mammal and large-bird occupancy might be one of the key reasons for a low seed flux of closed-canopy species. The second mechanism of Santos et al. (Reference Santos, Peres, Oliveira, Grillo, Alves-Costa and Tabarelli2008) is seedling mortality due to herbivory. We predict that conspecific negative density-dependent (Janzen–Connell) effects (Comita et al. Reference Comita, Queenborough, Murphy, Eck, Xu, Krishnadas, Beckman and Zhu2014) through increased herbivory might not be a key factor since trees of closed-canopy species are less abundant in plantation forests. At the sapling/adult stage, the third mechanism predicts interspecific competition from ruderals and climbers/lianas which might be a possibility considering the increase in lianas across the world’s secondary forests (Schnitzer & Bongers Reference Schnitzer and Bongers2011). The fourth mechanism predicts the mortality of closed-canopy species trees due to wind and desiccation. We observed several dead trees in the plantation forest plots, but were unable to identify them and hence need more evidence to test this. We must note that the above mechanisms represent only proximate causes of the observed successional pattern and we lack broader understanding of factors operating at the landscape level that shape the regeneration trajectory (Arroyo-Rodríguez et al. Reference Arroyo-Rodríguez, Melo, Martínez-Ramos, Bongers, Chazdon, Meave, Norde, Santos, Leal and Tabarelli2017).
Conservation value of primary and plantation forests
Over a span of 36 y since the establishment of the plantations, today, in spite of some advances towards primary forest structure (e.g. basal area), only miniscule advances towards primary forest function are seen (Figure 4) and several differences still exist. Firstly, one such structural difference is the greater percentage of large-diameter trees (>60 cm dbh) in the primary forest as compared with plantation forest. Recent evidence highlights the disproportionately large role played by such large-diameter trees in regulating tropical forest carbon stocks (Lutz et al. Reference Lutz, Furniss, Johnson, Davies, Allen and Alonso2018). Secondly, Osuri & Sankaran (Reference Osuri and Sankaran2016) showed that a decrease in large-seeded species may reduce above-ground carbon stocks by 8% in the central Western Ghats. Our study thus supports the findings that primary forests are crucial in maintaining biodiversity and provide irreplaceable ecosystem services (Barlow et al. Reference Barlow, Gardner, Araujo, Ávila-Pires, Bonaldo and Costa2007, Watson et al. Reference Watson, Evans, Venter, Williams, Tulloch and Stewart2018). Hence, we advocate the use of primary forests as benchmarks for restoring structure and function of a region’s secondary forests.
Having argued for the conservation of primary forests, we also wish to highlight the conservation value of plantation forests. Given the fact that KMTR landscape consists of differentially modified habitats, it is necessary to recognize the role of plantation forests at the landscape level (Ashton et al. Reference Ashton, Gunatilleke, Gunatilleke, Singhakumara, Gamage, Shibayama and Tomimura2014). In the southern Western Ghats, in the mosaic of tea estates, plantations and primary forests, the plantation forests prove to be important for fauna (e.g. rain-forest birds) by providing greater structural complexity as compared with the tea estates (Raman Reference Raman, Hawksworth and Bull2006). By providing this complexity, plantation forests can also potentially serve as corridors for arboreal mammals by connecting primary forest fragments (Srinivas et al. Reference Srinivas, Venugopal and Ram2008).
Restoration implications
Previous studies have described two approaches to restore plantation forests – an active and a passive model (Ashton et al. Reference Ashton, Gunatilleke, Gunatilleke, Singhakumara, Gamage, Shibayama and Tomimura2014). In the KMTR plantation forest, closed-canopy tree species are lower in abundance compared with the primary forest. Given the fact that some of the plantation forests in KMTR have primary forest surrounding them, we would expect an adequate seed source for the closed-canopy species and their subsequent regeneration (passive approach). However, from the results, it is clear that such a passive approach may not be enough and a combination of two approaches might be needed. Undertaking active restoration of target closed-canopy species and monitoring their success might be a good long-term experiment (similar to Ashton et al. Reference Ashton, Gamage, Gunatilleke and Gunatilleke1998, Parrotta et al. Reference Parrotta, Knowles and Wunderle1997). To facilitate this, we now also have some preliminary data on success rate and nursery protocols of several closed-canopy species from Western Ghats (Raman et al. Reference Raman, Mudappa and Kapoor2009, Stewart & Balcar Reference Stewart and Balcar2003).
Author ORCID
Ashish N. Nerlekar https://orcid.org/0000-0002-3737-882X
Acknowledgements
This study was an outcome of the Field Course in Conservation Science, 2016 conducted by ATREE. T. Ganesh, N. A. Aravind, Prashanth M.B. and Seshadri K.S. are thanked for providing critical inputs during the initial stages of this project and D. Mudappa is thanked for providing a part of the seed size data. We thank Navendu Page, Seshadri K.S., T. Ganesh and Anand Osuri for providing critical comments on the manuscript, and Priyadarshini J.S. for giving inputs on the map. We thank Mathivanan M., Tamizhalagan (Chian) and the staff at the Agasthyamalai Community based Conservation Centre for providing logistical support. We thank Tamil and Suresh for helping during fieldwork. Lastly, we are grateful to the Field Director of KMTR for providing permission to undertake this work.
Financial support
None.
Appendix 1
List of species encountered belonging to three life-stages (trees, saplings, seedlings) during sampling through primary (2016 sampling of plantation forest) and secondary (2005 sampling of plantation forest, and 2004, 2016 samplings of primary forest) data from Kalakad-Mundanthurai Tiger Reserve, India. Each species is classified into succession guilds (G = gap/pioneer; C = closed-canopy/climax/old-growth; I = introduced; U = unknown) and dispersal guilds (B = birds; M = mammals; A = autochorous; U = unknown). Sources for classifying seed-sizes (S = small; M = medium; L = large) are Osuri & Sankaran (Reference Osuri and Sankaran2016), Osuri et al. (Reference Osuri, Chakravarthy, Mudappa, Raman, Ayyappan, Muthuramkumar and Parthasarathy2017), Divya Mudappa (unpubl. data), Ganesh (Reference Ganesh1996), BIOTIK (http://www.biotik.org/), India Biodiversity portal (http://indiabiodiversity.org/), Gamble (Reference Gamble1915), Eflora of China (http://www.efloras.org/flora_page.aspx?flora_id=2) and R. Ganesan (pers. comm.). Relative abundance values for plantation forest include trees + saplings and not seedlings. Values of primary forest include only trees. * Species reported exclusively as seedlings; # Species recorded in primary forest exclusively during the 2004 sampling.