

1 Introduction
Overconfidence, “the excessive faith that you know the truth” (Reference Moore and HealyMoore & Healy, 2008), is a widely documented bias in judgment and a fundamental cause of defective decision making (Reference Bazerman and MooreBazerman & Moore, 2013). Notwithstanding the prevalence of overconfidence in everyday life, the concept is not fully understood and cannot be explained by a single and robust theory (Moore, Tenney & Haran, in press) and there is still a lot of room to study its essence and seek to reduce the bias.
1.1 Overconfidence in subjective probability estimation
The most common format in prediction/forecasting/estimation studies is, simply, to ask people to provide a subjective point estimate of the target quantity. In Reference Budescu and ChenBudescu and Chen (2015) judges (subjects in a large forecasting tournament) were asked to provide subjective probabilistic forecasts of the likelihood of occurrence of various business, economy, policy, politics, and military events. In other contexts, judges were presented with pairs of statements (e.g., (a) Cleveland is more populous then Cincinnati and (b) Cincinnati is more populous then Cleveland), asked to select the more probable one and report a confidence level between 0.50 and 1.0 (Ariely, Au, Bender, Budescu, Dietz, Gu, Wallsten & Zauberman, 2000). The questions employed for this forced binary choice format can relate either to factual statements (as in the population example) or future events (e.g., which of two teams, A or B, will win next week’s game). Researchers typically ask each judge to make many judgments of this type, allowing the researchers to assess the accuracy of the subjective confidence. The forecasts are said to be over- (under-) confident in their judgment if the mean level of confidence across items exceeds (is lower) than proportion of events that actually occur (Moore et al., in press). Typically, people are found to be over-confident (Reference Gigerenzer, Hoffrage and KleinböltingGigerenzer, Hoffrage & Kleinbölting 1991; Reference Lichtenstein, Fischhoff, Phillips, Kahneman, Slovic and TverskyLichtenstein, Fischhoff, & Phillips, 1982; Reference Moore and HealyMoore & Healy, 2008) but the generality of the results was questioned (Reference Budescu and DuBudescu & Du, 2007; Reference Juslin, Winman and OlssonJuslin, Winman, & Olsson, 2000) and there are several theoretical accounts for the observed pattern (Gigerenzer, Hoffrage & Kleinbolting, 1991; Juslin, Winman & Hanson, 2007).
1.2 Overconfidence in subjective probability interval estimates
Alternatively, people can be asked to provide subjective probability intervals Footnote 1 for the target quantities corresponding to a confidence assigned by the researcher, i.e., to state a pair of values, Low and High, such that Pr(Low≤ True≤ High) = Target confidence. Researchers have adopted 3 formats for question in this context. People may be asked (1) simply to report lower and upper limits to achieve a certain level of confidence, and in some cases to also report the best estimate of the quantity; or (2) assess full probability distributions for uncertain quantities. In one classic study, Reference Alpert, Raiffa, Kahneman, Slovic and TverskyAlpert and Raiffa (1982) asked people to judge 5 fractiles (.01, .25, .50, .75, and .99) for 10 questions (e.g., the percentage of first-year students who prefer bourbon to scotch, excluding those who never drink). The fractile estimates were transformed to obtain two bounds of specific probability intervals (e.g., the .10 and .90 generate the 80% probability interval). Reference Abbas, Budescu, Yu and HaggertyAbbas, Budescu, Yu and Haggerty (2008) describe some variations on this approach; or (3) be presented with the entire possible range of outcomes divided into several intervals and estimate each interval’s likelihood of containing the true value. This format can be used to obtain multiple probability intervals. For example, Reference Haran, Moore and MorewedgeHaran, Moore and Morewedge (2010) required subjects to estimate the high temperature in Pittsburgh one month from the day when they completed the survey with all formats. People were asked to judge lower and upper bounds for a 90% probability interval format, the 5th and 95th fractiles for a fractile format, or subjective probability interval estimates. For the last format, called Subjective Probability Interval Estimate (SPIES), subjects were presented with 9 temperature intervals—below 40∘F, 40–49, 50–59, 60–69, 70–79, 80–89, 90–99, 100–109, and above 110∘F—and estimated their subjective probability that each bin would contain the actual temperature.
Calibration of probability intervals is measured by the hit rate over intervals for several uncertain quantities, at a certain level of confidence, C. For instance, imagine that subjects are asked to provide 90% probability intervals for N (e.g., N = 100) unknown quantities. The hit rate is the proportion of intervals, X/ N, that bracket the actual quantity (0≤ X/ N≤ 1). If X/ N matches the target probability/confidence (e.g., X/ N = C), the judge is said to be perfectly calibrated (Reference McKenzie, Liersch and YanivMcKenzie, Liersch & Yaniv, 2008). If X/ N < C—say only 60% of the supposedly 90% interval estimates contain the actual value—the judges are said to be overconfident since the hit rate is lower than the target confidence and, on average, the intervals are too narrow. Conversely, if X/ N> C, the judges are said to be underconfident since the hit rate exceeds the assigned confidence and the intervals are too wide, on average. The common practice of aggregating responses to a number of questions to measure calibration caused some researchers to question the “true existence of overconfidence” and offer alternative ways of comparing and interpreting intervals on different scales (Reference Glaser, Langer and WeberGlaser, Langer & Weber, 2013).
One of the most pervasive findings is that assessors display overconfidence when generating interval estimates (Reference Alpert, Raiffa, Kahneman, Slovic and TverskyAlpert & Raiffa, 1982; Reference Lichtenstein, Fischhoff, Phillips, Kahneman, Slovic and TverskyLichtenstein, Fischhoff & Phillips, 1982; Reference Jain, Mukherjee, Bearden and GabaJain, Mukherjee, Bearden & Gaba, 2013). The assessed extreme fractiles are systematically biased toward the center (underestimating tail probabilities), so the subjective intervals tend to be too narrow (Moore et al., in press). Overconfidence has been found in estimation of general knowledge questions as well as when forecasting real-life uncertain quantities (Reference Soll and KlaymanSoll & Klayman, 2004; Reference Budescu and DuBudescu & Du, 2007; Reference Speirs-Bridge, Fidler, McBride, Flander, Cumming and BurgmanSpeirs-Bridge, Fidler, McBride, Flander, Cumming & Burgman, 2010).
There have been many attempts to reduce overconfidence in probability intervals by helping respondents widen estimated intervals prior to their estimation. Common mechanisms applied are feedback, training, incentive schemes, inspiring people to search for more internal sources in memory, decomposing forecast task into smaller pieces and indicating estimates separately, and warning judges about the overconfidence bias (Jain et al., 2013; Moore et al., in press).
Reference Soll and KlaymanSoll and Klayman (2004) compared three elicitation formats: The range condition (e.g., I am 80% sure that this happened between __ and __.) asks judges to specify the lower and upper bounds of the probability interval, the two-point condition (e.g., I am 90% sure that this happened after __. and I am 90 % sure that this happened before __.) asks them to report the two bounds separately in two questions. The three-point condition is a variation on this format that asks judges to make one more estimate (e.g., I think it is equally likely that this happened after or before __.). The two- and three-point conditions encourage judges to sample their knowledge more than once and these estimates may have different systematic and random errors, as if they are obtained from different judges. This is similar to the approach taken by Reference Herzog and HertwigHerzog and Hertwig (2009) for point estimates. The authors showed that the three-point method indirectly helped people to be better calibrated.
Reference Haran, Moore and MorewedgeHaran, Moore and Morewedge (2010) showed that SPIES induced better calibration than the range and the two points format by mitigating overconfidence. Jain et al. (2013) tried to reduce overconfidence with another approach, called “time unpacking”. MBA students were randomly assigned to one of two conditions, packed or unpacked, and were asked to predict the lower and upper limits for 90% probability intervals of three financial indicators. In the packed condition, people forecasted the three quantities three months ahead. In the unpacked condition, they predicted the same quantities one month, two months, and three months ahead, in that order. The mean width (across the three quantities) of the predicted intervals in the unpacked condition was significantly larger than in the packed condition, which indicates that the time unpacking can also reduce overconfidence.
1.3 Wisdom of Crowds as a way of aggregating multiple predictions
“Wisdom of Crowds” (WoC) refers to the empirical observation that aggregates of opinions or estimates of multiple people often outperform judgments of experts. Galton (1907) asked people who attended the West England Fat Stock and Poultry Exhibition to guess the weight of an ox. The group median estimate, 1,207 pounds, was surprisingly close to the actual weight, 1,198 pounds. Psychologists discovered that averaging several predictions led to more accurate estimates than those of the average person (e.g., Gordon, 1924), and concluded that the aggregation approach reduces the impact of individual errors.
Simple (equal weighting) averaging, the most natural way to combine opinions, often yields more accurate estimate than the individual judgments on which they are based (Reference Larrick and SollLarrick & Soll, 2006). Reference Larrick, Mannes, Soll and KruegerLarrick, Mannes & Soll (2011) distinguish between two qualitatively different cases. If the estimates of several decision makers are on opposite sides of the true value—some overestimate it and some underestimate it–they “bracket the truth”. The distance between the estimates and the true value will be reduced by averaging them, because the average is closer to the actual value. Averaging improves the accuracy of the prediction because the errors from the two sides of the truth cancel each other. If all the judgments are located on the same side of the true value—all over-estimate, or all under-estimate it—they cannot cancel out each other. Averaging locks in the average individual error. Obviously, bracketing generates more accurate estimates.
The averaging method works well even in one mind/person. Reference Herzog and HertwigHerzog and Hertwig (2009) found that asking people to estimate unknown quantities more than once and aggregating the two outputs of the same person can improve the quality of the judgment. The assumption is that the second dialectical estimate has different systematic and random errors based on a different set of knowledge and process integrating the information than the first one, even though they are solicited within one mind. The study indicated that accuracy gain and bracketing rate were highest in the dialectical-bootstrapping condition where people generated a second estimate after being told that their first one is off the mark and instructed to think about new reasons and new perspectives.
Wisdom of crowds works because, even if individuals have biased knowledge that cause them to underestimate or overestimate certain unknown quantities, the pooled estimate could be much closer to the true value by offsetting the biases (see analysis by Davis-Stober, Budescu, Dana & Broomell, 2014). Integrating various opinions (a) maximizes the amount of information available to predict some events; (b) minimizes the impact of extreme sources that might bring about the estimate to be far from the true value; and (c) yields valid and ecologically representative aggregates (Budescu, 2005). In this sense averaging can transform inputs that are individually biased and, possibly, far from the actual quantity into a collectively wise output near the mark (Lyon, Wintle & Burgman, in press). Therefore, biased individual predictions could be a useful resources when forecasting uncertain events or quantities, if they contain relevant information that can be pooled to improve the accuracy of aggregate estimate (Reference Wallsten and DiederichWallsten & Diederich, 2001). As a result, enhancing the diversity of the judges who provide estimates is considered one of the best ways to enhance the WoC (Reference Herzog and HertwigHerzog & Hertwig, 2009; Reference Larrick, Mannes, Soll and KruegerLarrick et al., 2011; Reference SurowieckiSurowiecki, 2004).
One can question the optimality of equally weighting all the members of the crowd, as this method ignores differences in expertise, experience, etc. If additional information that can help identify more knowledgeable members of the group is available, differential weighting of the members may work better. For example, Reference Budescu and ChenBudescu and Chen (2015) showed how to improve the quality of aggregate predictions by identifying better performing individuals. Their contribution weighted model (CWM) beat the unweighted model by about 28%. The power of this model was derived from (a) its ability to isolate experts in the crowd and (b) to weight them accordingly. Unequal weighting models require measures of relative contribution, past performances, or subjective confidence. However the information is not always available, so we cannot always select judges who increase the accuracy of the group. In addition, it is sometimes difficult to define and identify experts, and in some domains they are no more accurate than non-experts (Reference Wallsten and BudescuWallsten & Budescu, 1983).
To summarize, equally averaging opinions of crowds has three obvious advantages. The strategy lets errors cancel out, gives some weight at least to the expert members, and can be applied without any information about relative expertise (Reference Larrick, Mannes, Soll and KruegerLarrick et al., 2011).
1.4 Collective wisdom in probability intervals to rectify overconfidence
Only a few studies have looked into the possibility and benefits of aggregating probability intervals, in the spirit of the WoC, to mitigate overconfidence and improve forecast accuracy by applying optimal mathematical combination rules of multiple intervals. Previous attempts to reduce overconfidence in interval estimates have focused on assisting people to be less overconfident by generating wider intervals. All WoC inspired methods are post hoc and do not try to affect the quality of the individual estimates.
Gaba et al. (2014) suggested several heuristics for combining interval forecasts. Assume that n judges were requested to provide subjective C=100(1−α)% intervals on an unknown quantity, in the form of lower and upper bounds ( L i, U i) where i = 1,2,.,n. The intervals are divided by the average width, ![]() = 1 / n ∑i = 1 n ( U i − L i), by quantity and time period being forecasted for the purpose of rescaling them. Let the combined intervals derived from approach A be ( L A *, U A *). The Averaging (A1) and Median (A2) heuristic utilize the mean and the median of the distribution of estimates for each bound, respectively. The minimum of lower bounds and the maximum of the upper bounds, across all n respondents, define an Enveloping approach (A3). The Probability averaging heuristic (A4) assumes that each interval judgment follows an individual normal distribution. Under normality the 90% probability intervals, for instance, can be expressed as
= 1 / n ∑i = 1 n ( U i − L i), by quantity and time period being forecasted for the purpose of rescaling them. Let the combined intervals derived from approach A be ( L A *, U A *). The Averaging (A1) and Median (A2) heuristic utilize the mean and the median of the distribution of estimates for each bound, respectively. The minimum of lower bounds and the maximum of the upper bounds, across all n respondents, define an Enveloping approach (A3). The Probability averaging heuristic (A4) assumes that each interval judgment follows an individual normal distribution. Under normality the 90% probability intervals, for instance, can be expressed as ![]() where
where ![]() and
and ![]() . Simple averaging of midpoints and probability averaging of bounds (A1.4), combining A1 and A4 and their benefits, uses midpoints of estimated intervals with the widths from A4.
. Simple averaging of midpoints and probability averaging of bounds (A1.4), combining A1 and A4 and their benefits, uses midpoints of estimated intervals with the widths from A4.
Gaba et al. (2014) asked 59 analysts working at an Asian brokerage firm to forecast 90% subjective intervals for 5 questions one month, two months, and three months from the day when they answered. The judgments for each quantity were combined according to the various heuristics using group sizes, k, ranging from 1 to 20. The hit rate with A3 (Enveloping) increased rapidly and was close to 100% at k = 20, which is an indication of underconfidence, while the rates with A1 (Averaging) and A2 (Median) did not increase as much and the combined intervals remained overconfident at the highest k. The hit rate with A4 (Probability averaging) increased as a function of k, but not as fast as with Enveloping, but it reduced overconfidence significantly.
The Mean Absolute Error (MAE), the distance between the actual value and the midpoint of interval is another measure of evaluating the quality of the procedures. The MAE of A3 (Enveloping) increased fast, as a function of group size, whereas the errors of the other heuristics fell at different rates. The hit rate of A1.4 closely followed the one in A4 (Probability averaging) and MAE in A1.4 had, as expected, the same values as A1 (Averaging).
Lyon et al. (in press) meta analyzed results from 15 experiments to examine whether various aggregation methods of probability intervals perform better than the unweighted average. Their work did not focus on the intervals’ hit rate but on the distance between the midpoint of the intervals and the actual value. This is an interesting approach but it does not address at all the key issue of the mis-calibration research, the width of the intervals. Lyon et al. compared four methods that they describe as psychologically motivated and statistically motivated methods, as well as some more complicated methods integrating elements of the two approaches. The various methods are listed in Table 1.
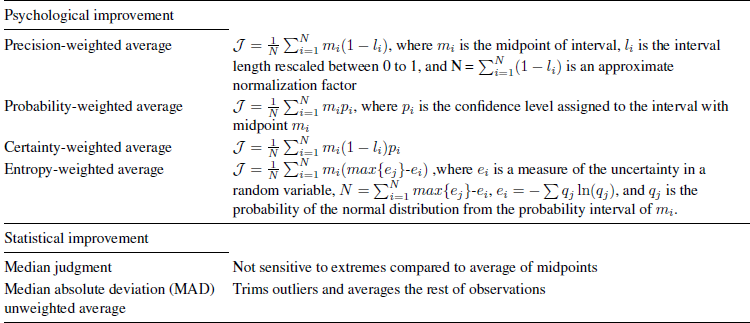
All methods outperformed the unweighted average and the statistically motivated methods produced more accurate point estimates than the psychologically motivated ones. The most accurate methods were certainty-weighted average and MAD-filtered unweighted averages.
1.5 The current paper
Decades of research have investigated the WoC effect on the accuracy of point estimates and showed that various aggregate predictions tend to have less error than individual predictions. Only a few studies have paid attention to the WoC effectiveness in aggregating interval estimates. Our goal is to fill this gap by testing the ability of several WoC algorithms to improve calibration of interval estimates. All the algorithms operate on pairs of lower and upper bounds of various quantities provided by groups of judge operating individually and independently of each other. We will demonstrate that such collective probability interval estimates can reduce the typical overconfidence of the individual estimates, will attempt to determine which method yields the most accurate and best calibrated intervals, and provide some insights into the aggregation process.
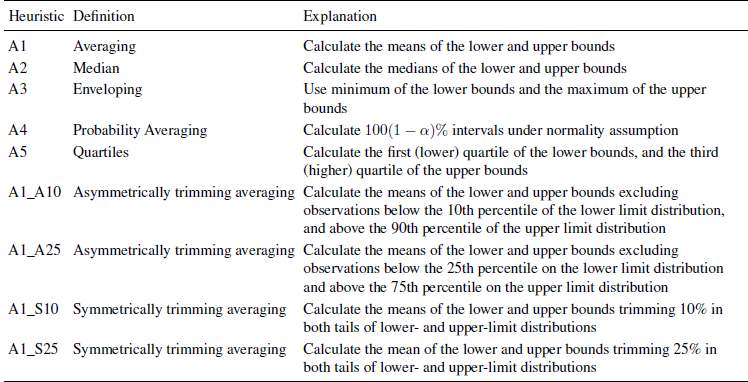
Naturally, we start with the methods described by Gaba et al. (2014). Their Enveloping heuristic, A3, generated extreme combined lower and upper bounds, and resulted in collective underconfidence, while the other heuristics failed to fully eliminate the overconfidence. We propose a few additional heuristics, which have the potential to come closer to the target confidence level: The first, A5, which we label Quartiles, is based on the lower quartile (Q1) of the n lower bounds and the upper quartile (Q3) of the n upper bounds. It is a variation of the Enveloping heuristic (A3) with a view to removing extreme estimates of the lower and upper bounds of respondents who heed Alpert and Raiffa’s (1982, p. 301) advice to “For heaven’s sake, Spread Those Extreme Fractiles! Be honest with yourselves! Admit what you don’t know!” and produce excessively wide intervals (see Reference Glaser, Langer and WeberGlaser et al., 2013; Reference Russo and SchoemakerRusso & Schoemaker, 1992).
We also consider 4 variations of the Averaging (A1) that trim extreme observations. We consider two symmetrically trimmed, and two asymmetrically trimmed versions. The idea is, as in the Quartiles (A5) heuristic that the extreme estimates are from respondents who have unreasonably wide intervals. Asymmetrically trimming Averaging heuristics, A1_A10 and A1_A25, trim observations that are below 10th or 25th percentiles on the lower-limit distribution and above 90th or 75th percentiles on the upper-limit distribution and average the rest of observations. The rationale for the trimming is to exclude the estimates of judges heed Alpert and Raiffa’s advice. The heuristics, A1_S10 and A1_S25, trim 10 or 25% in both tails of the upper- and lower-limit distributions, eliminating 20% and 50% of the total judgments, respectively, and average the rest of observations. The additional trimming on the other side of the distributions leads to intervals that are wider than A1_A10 and A1_A25 by removing values that are above 90th or 75th percentiles among lower bound estimates and 10th or 25th percentiles below upper bound estimates. Table 2 summarizes all heuristics that are applied to our study.
We re-analyze a few published data sets (see details below), and we focus on the hit rate of the various aggregated intervals, as a function of the group size. This dependent variable allows us to compare meaningfully results from various domains and using different scales. The hit rate of probability intervals is affected by two distinct factors, their bias and their width. To fully understand the effect of the various aggregation algorithms on the crowds’ performance, we also compare the effects of the various aggregation methods of these two factors.
2 Method
2.1 Subjects and data
We conducted a literature review of studies of probability interval estimates searching for datasets providing (a) both lower and upper bounds, (b) the true values, (c) a large enough number of items, and (d) a large enough number of judges. We selected two studies for our analysis in accordance with these considerations. The data sets selected allow us to compare the various aggregation methods, and examine the effects of group size on calibration.
Glaser, et al. (2013) collected probability intervals for general knowledge questions, and stock market forecasts in 3 distinct phases of an experiment. We re-analyze only the knowledge questions. The subjects were required to report upper and lower limits of 90% probability intervals for 10 questions concerning general knowledge (e.g., the length of the river Orinoco in kms, or the weight of an empty Boeing 747 in kgs) and 10 economics and finance questions (e.g., the number of pharmacies in Germany in May 2001, or the number of cars that BMW has sold in March 2001 worldwide). Thirty three professionals working as traders in a large German bank and 75 advanced students majoring in Banking and Finance at the University of Mannheim participated in the project. 13 students were excluded from our re-analysis due to excessive rates of missing data. We analyze results of 95 subjects-33 traders and 62 students. We refer to these data as GLW.
We also analyzed data from the Reference Soll and KlaymanSoll and Klayman (2004) paper. Thirty three undergraduate and graduate students from the University of Chicago were recruited and assigned into either range (e.g., “two numbers such that you are 80% sure that the correct answer lies somewhere between the two”) or two-point condition (e.g., “a lower estimate such that you are 90% sure that the child is not younger than that and an upper estimate such that you are 90% sure that the child is not older than that”). The subjects estimated 80% probability intervals for 50 quantities from 4 domains including college’s overall quality score, the average box office gross of ’90s movies, invoice price of cars, and winning % of National Basketball Association teams. Typically, judges have to rely on their knowledge and memory when making predictions, but in this instance the researchers provided relevant objective cue values and the judges had to decide how to combine the additional resources and their knowledge for answering accurately (e.g., academic reputation rating, number of films she has starred in, size of car, average points per game for each domain). Because of missing data and a programming error in the original research only data from 25 students and 48 questions were re-analyzed across subject groups, the item domains, and elicitation methods. We refer to these data as SK.
Procedure
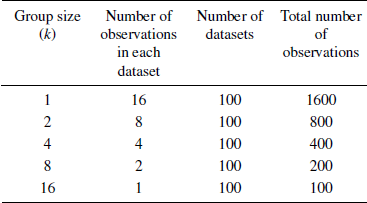
Grouping: The general approach is to create groups of size k = 2g(g = 0 to 6), aggregate the lower and upper bounds within each group according to the various methods and calculate the level of calibration of the group. In order to identify the net effect of grouping (as opposed to the extra information associated with larger groups) we used the following method, illustrated with the GLW (2012) data:
(1) A set of 64 observations were randomly selected from the n = 95 judges. These 64 judges were randomly assigned to smaller groups and analyzed as 64 individuals (k = 1); 32 groups of size k = 2; 16 groups of size, k =4; 8 groups of size, k =8; 4 groups of size, k = 16; 2 groups of size, k = 32; and one group of size k = 64. In all these cases the complete information (from all 64 judges) was considered, but the grouping was different.
(2) To reduce the effect of the random selection and reshuffling, this process was repeated R = 100 times with different random groupings.
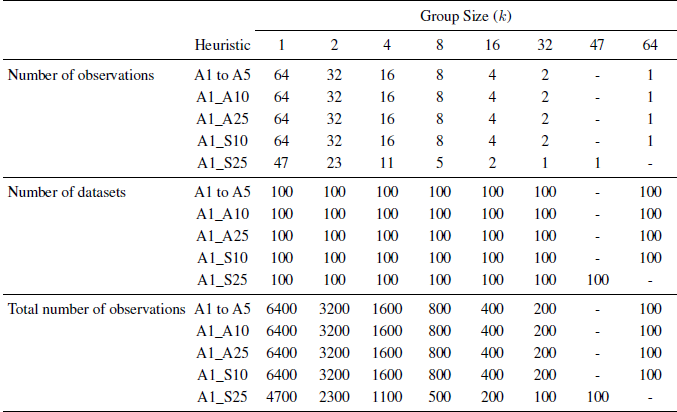
The four heuristics suggested by Gaba et al. (2014) and Quartiles (A5) analyze all the observations, some of the new heuristics that involve trimming use fewer observations. Methods A1_A10, A1_A25, A1_S10, and A1_S25 analyze only 85, 71, 75, and 47 of the judges, respectively. Thus, for the A1_S25 method we analyze groups of size k = 2, 4, 8, 16, 32, and 47. Table 3 summarizes the design by presenting the number of observations and group sizes. For each of the groups created by this process, the nine heuristics were used to aggregate the judgments and create “collective probability intervals” (Note that A5 (Quartiles) can only be created for k≥ 4, so it does not apply to k = 2).
For the SK (2004) data, we used the same process but because of the smaller sample size, we compare only k = 1 to 16 or 1 to 32. Also, given the small number of judges, we did not include the 4 heuristics involving trimming.
Measures of Performance: We evaluate the combined intervals on two measures. The first measure ( C k), hit rate, tests the calibration by calculating how many aggregate intervals bracket the true value. The measure is defined as:
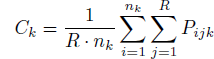
where P ijk is the proportion of intervals containing the actual value based on groups of size k, and it is being averaged across all R replications and n k groups of size k. The average hit rates were obtained for each group size and compared to see if, and how fast, the rates are reaching the target levels, e.g., 90% by increasing group size and the different methods.
The Mean Squared Error (MSE) is the overall variation of the observed hit rates around the target confidence level:
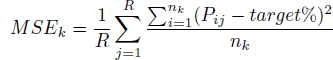
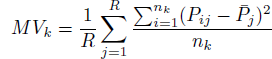
MSE can be decomposed into Mean Variance (MV) and Mean Squared Bias (MSB) in order to track the source of miscalibration. It is expected that both MV and MSB would decrease when combining the intervals and increasing the group size. The MV measures how spread out the hit rates of the various subgroups of judges are. If MV decreases as a function of group size it indicates that the hit rates across subjects become more regular by combining observations. The MV k is defined as:
The Mean Squared Bias (MSB) is defined as the squared discrepancy between the proportion of well-calibrated intervals and the target confidence.
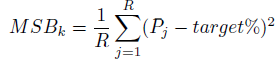
For instance, if a person was asked to report 80% probability intervals for 100 unknown quantities and 70 intervals indeed contained the actual value, her squared bias is (70%-80%)= (-10%)2. The squared biases of judges are averaged across replications for each k.
3 Results
3.1 Re-analysis of the GLW data
We compared first the hit rates of 4 variations on Averaging (A1) (with different trimmings) in each item domain, identified the best trimming method and included it in the comparison with the 5 heuristics (no trimming). Figure 1 present the hit rates achieved in 4 variations separately for each domain. The symmetric methods, A1_S25 and A1_S10 show the highest performance in both domains and A1_A10 has the worst performance.
Hit rates of 4 variations on averaging with trimming as a function of group size in general knowledge and economics/finance questions (GLW data). Note. The largest group size only for A1_S25 is 47.
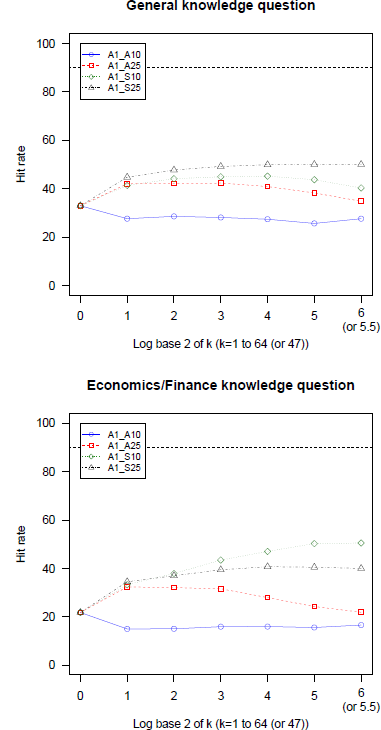
Figure 2 present the hit rates of 5 heuristics and the best functioning trimming heuristic in each domain. The economics and finance domain initially (k = 1) had lower hit rate (22% compared to 33%), indicating more serious overconfidence. The hit rate of Median (A2) tends to be higher than Averaging (A1) for larger group sizes, but both rates increase relatively slowly and do not come close to the target, 90%, indicating that they cannot substantially mitigate overconfidence. In fact, the hit rates of the simple Averaging (A1) are not monotonicFootnote 2 in k. Enveloping (A3) performs well increasing calibration rates up to the 100% in both domains but over-corrects, and for large k the intervals are too wide and result in underconfidence. Probability averaging (A4) shows mixed results, by mitigating overconfidence rather successfully in one domain but over-correcting in the other. The Quartiles method (A5) leads to much higher rates than Averaging and Median method but not as high as Enveloping, and increases at a moderate rate. Also it does not seem to need large group size because the hit rate does not change much after k = 4. The best versions of the trimmed mean heuristics correct for overconfidence noticeably better than Averaging (A1) and even Median (A2) by excluding extreme observations, but are not as good as Quartiles (A5) and probability Averaging (A4).
Hit rates of and of 5 heuristics and the best variation on the Averaging (A1) as a function of group size in general knowledge and economics/finance questions (GLW data). Note.The largest group size only for A1_S25 is 47
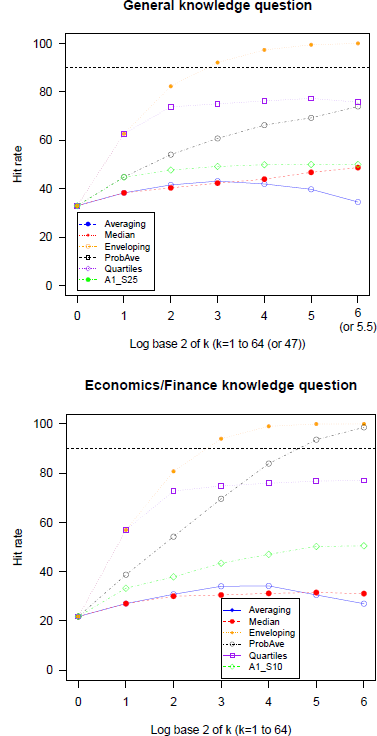
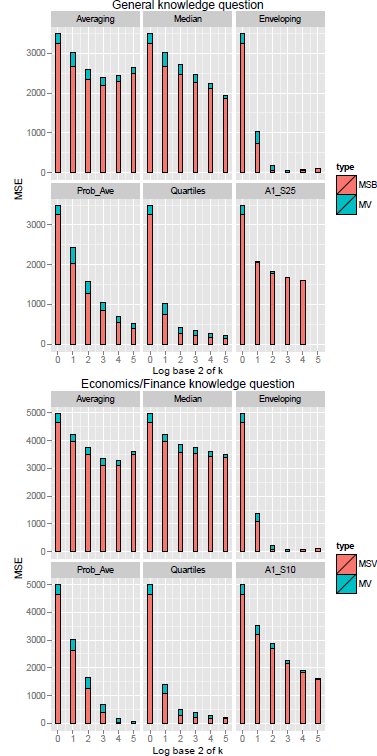
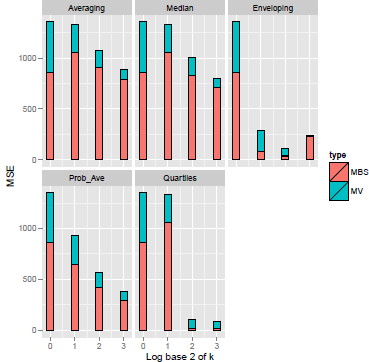
Figure 3 presents the mean squared error (MSE) and its components-mean variance (MV) and mean squared bias (MSB). Note that MV and MSE are not defined for the case with max(log2 k) = 6 as there is only one observation for each item. Several results stand out: (1) MSB dominates MV (2) MV tends to decrease monotonically as a function of group size with a few minor exceptions and (3) MSB also decreases except for in Averaging and Enveloping cases. Typically, MSE was also monotonic in group size, with a few exceptions due to the increase in MSB in Averaging. The MSE of Enveloping (A3) decreases most rapidly and asymptotes at k = 4 with only minor changes for larger samples. Averaging (A1) and Median (A2) are less sensitive to group size, than the other heuristics. The MSE of A1_S25 and A1_S10 drop significantly faster than Averaging (A1), proving the trimming procedure prior to averaging is beneficial. Finally, Probability averaging (A4) and the Quartiles method (A5) showed less rapid decline than Enveloping, but clearly outperformed Averaging (including the trimmed versions) and the Median. Overall, the MSE of Quartiles (A5) seems the better of the two.
Mean Variance (MV), Mean Squared Bias (MSB), and Mean Squared Error (MSE) in general knowledge and economics/finance questions as a function of group size for six aggregation heuristics (GLW data).
3.2 Analysis of SK data
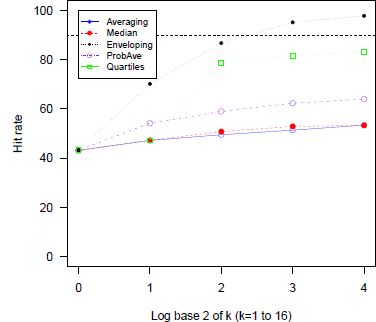
Figure 4 present the hit rates in the SK data, combined across all the conditions in the study. Miscalibration was reduced by combining intervals but at different rates for the 5 heuristics. The hit rates with Enveloping (A3) increased in leaps and bounds significantly alleviating overconfidence but exceeded the target rate, 80%, generating underconfident intervals for large groups. Averaging (A1), Median (A2), and Probability Averaging (A4) performed less well in reducing overconfidence and the hit rates never exceeded 65%. Quartiles (A5) was the best procedure attaining 81.5% at k = 8 which is very close to the target even though the rates at k = 8 and 16 (83%) were slightly higher than 80%. It did not present a manifest increase at k = 16 as shown in the previous study.
Average hit rates across question domains and elicitation conditions as a function of group size for five aggregation heuristics (SK data). Note. The rate of log2 4(=2) in Quartiles replaced by the one in A1.
The results of MV, MSB, and MSE replicate the patterns of the first study. Both MV and MSB decreased monotonically with all heuristic all the way down to k = 16 except for some cases of MSB which increased, occasionally, due to underconfidence. Averaging and Median methods showed only modest declines in MSE and Enveloping (A3) and Quartiles (A5) reduced MSE most efficiently followed closely by Probability averaging (A4) (Figure 5).
Mean square error across question domains and elicitation conditions as a function of group size for five aggregation heuristics (SK data).
Discussion
All methods compared were beneficial: They all reduced overconfidence, increased the hit rates, and reduced the MSE to different degrees in both studies, indicating that WoC can be used in this context. One of the remarkable results in the WoC literature on point estimates is that very simple procedures, such as calculating the mean or the median of all the estimates, work extremely well. Clearly, simple averages are not sufficient in the context of interval estimates. Trimmed averaging performs better than unweighted averaging (A1). Interestingly, symmetrically-trimmed averages outperform the asymmetric-trimming methods, indicating that it is important not only to exclude extremely high (low) estimates of the upper (lower) bounds that may lead to too excessively wide intervals but also to reduce the impact of extremely high (low) estimates of the lower (upper) bounds that tend to increase the bias.
The degree of improvement in the calibration of the probability intervals by averaging and the median is quite modest. Interestingly, we do not replicate the results reported by Gaba et al. (2014), who found that the average was better than the median. In our data they function equally well in some cases and the median improved the calibration of the interval estimates more than the average in the general knowledge questions in the GLW study. The inconsistency may be explained the skewness of the distributions of upper and lower limits. In the GLW study the distributions were positively skewed in both groups: the average skewness of two estimates across 20 items is 5.33 and 6.34 for the lower and upper bounds, respectively. In the SK study, the estimates are less skewed: the mean skewness across the 47 items was 0.42 and −0.32 for the lower and upper limit distributions, respectively, and averaging works somewhat better. Support for this explanation is obtained from the fact that symmetric trimming, which reduces the skewness, performs better than regular averaging for both measures of performance in GLW.
Although the hit rates of the Enveloping method increased rapidly, mitigating overconfidence and reducing MSE substantially in both studies, Enveloping is not a particularly good procedure because its hit rate exceeds the target confidence for moderate sample sizes by widening the distance between two end points rendering the aggregate interval enormous, coarse and uninformative (Reference Yaniv and FosterYaniv & Foster, 1995).
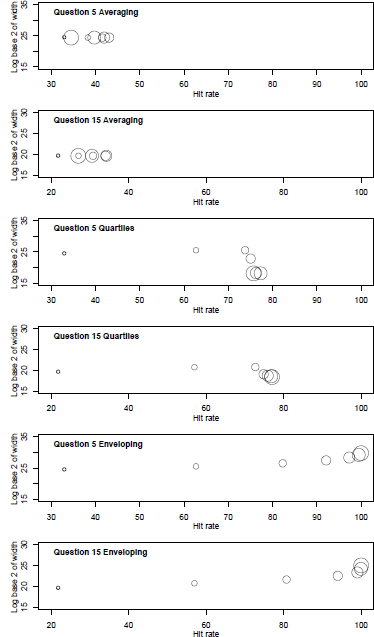
Figure 6 illustrates this point. It shows the median widths of intervals of two questions (Q5 and Q15) in the GLW study for the Averaging, Enveloping, and Quartiles heuristics. The median widths of the Enveloping intervals were much wider at the largest k whereas the width with Averaging and Quartiles are relatively constant. In other words, Enveloping simply replaces overconfidence with excessive underconfidence.
Log base 2 of Median width of grouped intervals for two questions as a function of hit rate and groups size for Averaging, Quartiles, and Enveloping heuristics (GLW data). Circle size ordered by group size, 1...64.
Is one type of miscalibration better or worse than the other? In some cases, one could invoke cost considerations to answer this question as the costs associated with the two may vary widely. But, in general, people may not wish to trade-off the informativeness of narrow intervals for higher hit rates (Reference Yaniv and FosterYaniv & Foster, 1995).
Both probability averaging (A4) and the Quartiles method (A5) offer a nice compromise as they reduce overconfidence markedly and help reduce MSE. The Quartile heuristic has the advantage of not relying on assumptions about the shape of the distributionsFootnote 3, and we propose that it provides an excellent tool for combining interval forecasts. The key principle driving the Quartiles heuristic are the same ones that drive MAD filtered Unweighted Average (Lyon et al., in press), namely trimming extremes that give rise to various biases prior to aggregating interval forecasts. In this case, we treat estimates below the 25th percentile in the distribution of lower bounds and greater than the 75th percentile of the upper bounds as “extremes”. Since the average and the medians of these distributions do not widen the intervals enough to rectify overconfidence, and since the Enveloping heuristic induces underconfidence, the Quartiles Heuristic is a happy compromise between these extremes.
We have illustrated the efficacy of the Quartiles heurists in two separate studies where the original judgments were extremely overconfident, but we hasten to caution that it may not always work. We illustrate the point with data from another study (Reference Budescu and DuBudescu & Du, 2007) where the judges were only slightly overconfident. Sixty-three graduate students who attended in the Business school of the University of Illinois at Urbana-Champaign were asked to forecast future prices of 40 anonymized stocks. Subjects were shown time series of the monthly prices of all stocks for Year 1 and asked to predict the price of Month 3 for Year 2. Among other judgments, they provided 50%, 70% and 90% probability intervals. We chose only 90% interval estimate data that displayed slight overconfidence (mean hit rate = 82%). We refer to these data as BD.
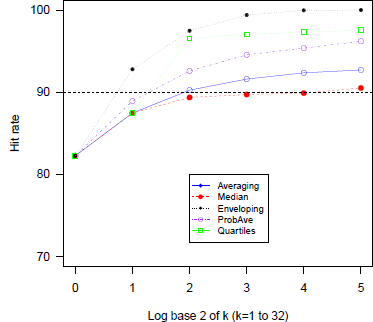
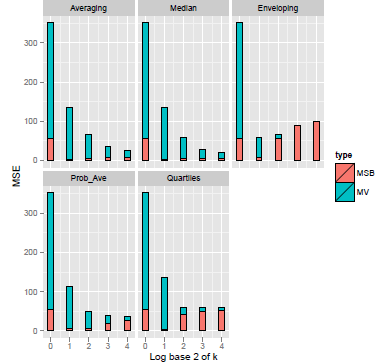
Figure 7 displays the hit rates bases of the 5 heuristics, as a function of group size. The various procedures reduce overconfidence, and the ordering of the rate of increase in the hit rate is similar to the one shown in the previous studies. Enveloping (A3) widens the intervals and 99.4% of the actual prices lie between its two bounds at k = 8. The hit rates in Probability Averaging (A4) and Quartiles (A5) also exceed the target confidence level (90%) for k ≥4 (hit rate of Quartiles reaches a plateau at k = 4). Both Averaging and Median increase more slowly and, in this case, they achieve the best results (especially the median). Figure 8 shows the MSE and its components. MV dominates MSB in smaller k and MV decreases as a function of group size for all methods. MSE also tends to be diminished except in Enveloping (A3). However MSB shows an apparent rebound due to underconfidence except for the Median (A2). Thus, Quartiles is not the best aggregation heuristic if we need to resolve less severe overconfidence. In this case, one would do better by using the Median.
Hit rates as a function of group size for five aggregation heuristics (DB data).
Mean variance, Mean squared bias, and Mean squared error as a function of group size for five aggregation heuristics (DB data)
Our examples suggest that (1) the Quartiles method works best when most judges are highly overconfident; (2) when overconfidence is low, the Median is a better choice, but (c) if one has access to only a small group of forecasters, Enveloping could be one’s best bet. These conclusions are consistent with the results reported by Gaba et al. (2014). Future work should seek to identify and fully characterize the cases where different heuristics perform best in terms of reducing overconfidence while taking into account various factors such as maximal group size available for aggregation, the degree and the type of the skewedness of the two distributions and the correlation between the various members of the crowd.
Like most work on this topic in the JDM literature, we focused on the hit rate and its distance to the target confidence levels. Given our interest in aggregation over multiple judges we also reported results related to the MSE. We did not study systematically the width of the various aggregated intervals and the absolute distance between the midpoint of intervals and the realized value as a function of group size. The data sets we re-analyzed used multiple items from various domains measured in different metrics that vary widely (for example, in the GLW data they range from 58 years to 11 million customers). The direct implication is that the width and the distance from the target cannot be easily compared across items. One possible solution is to re-scale the judges’ estimates to of the lower and upper limits for the return. Gaba et al. (2014) rescaled by ![]() to place all the estimates be on the same scale.
to place all the estimates be on the same scale.
Another appealing possibility is to focus on scoring rules that consider simultaneously the hit rate and the width of the interval, like the one proposed by Reference Jose and WinklerJose and Winkler (2009). For 100(1− α)% probability intervals their Q-score is defined as:
where L and U are the lower and upper limits of the intervals provided by the judge, x is the actual value, and g is a scaling constant. Without any loss of generality set g = 0, so all scores are negative. It follows that the closer a score is to 0 (less negative), the better it is. Q-scores increase (i.e., improve) when the interval ( U− L) is tight and informative, and when the distance between the actual value and the relevant end point is short, so the Q-score is a comprehensive measure of the quality of the probability interval that aggregates accuracy and informativeness (Reference Yaniv and FosterYaniv & Foster, 1995).
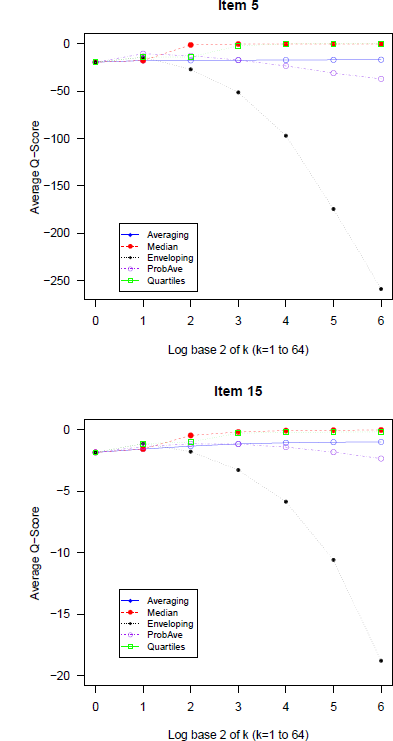
To illustrate the approach and compare its results to our analysis we display in Figure 9 the average Q-scores for items 5 and 15 from the GLW data (the same one analyzed in Figure 6) for the five approaches used in our analysis as a function of the group size. The Q-scores of Enveloping (A3) drop rapidly as a function of k confirming the detrimental effect of the wide intervals. The Quartiles (A5) and Median (A2) methods perform best, followed by Averaging (A1) and Probability averaging (A4).
Average Q-scores as a function of group size for the 5 methods for two items
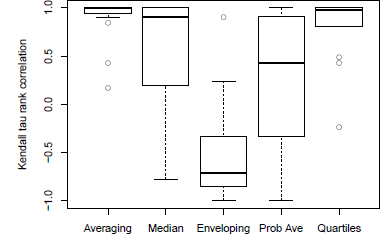
One obvious problem of the Q-scores is that they are scale-specific so one can’t combine them meaningfully across multiple items, unless they use the same units. To overcome this problem, we calculated the Kendall τ rank correlation between group size and the mean Q-score for every item and each method. Figure 10 compares the distribution of the 20 coefficients for each method. Only Averaging and Quartiles have consistent positive correlations (with 3 outliers for some very difficult items), and we observe mixed result for Probability averaging (A4) and Median (A2). These additional analyses using the alternative measures highlight the excellent performance of the newly proposed Quartiles heuristic.
Distributions of Kendall rank correlation between mean Q-scores and group size for all methods.


 Open access