


1 Introduction
Although debate continues about technical and scientific issues surrounding climate change, the human dimensions of the problem pose significant impediments to developing and implementing solutions to mitigate its impact. Slowing climate change will almost certainly require a reduction in greenhouse gas emissions, but agreeing upon who should reduce emissions by how much has thus far proven an intractable problem. Despite longstanding agreement that combating anthropogenic climate change is a serious issue that necessitates international cooperation (United Nations, 1992), failures such as occurred in Copenhagen in 2009 show that nations are unable to agree on what constitutes a fair sharing of the emissions reduction burden (Reference Lange, Löschel, Vogt and ZieglerLange et al., 2010). In this paper we show that the difficulty of reaching agreement is, in part, due to the self-serving bias—the pervasive tendency to believe that what is beneficial to oneself is also fair. The self-serving bias, and not intrinsic cross-cultural differences in what is judged a fair distribution of sacrifices, may represent the primary obstacle standing in the way of agreement.
Alternatively, one might consider the social dilemma structure of the problem (e.g., Tavoni et al., Reference Tavoni, Dannenberg, Kallis and Löschel2011) or other strategic concerns (e.g., Finus, 2001, chapter 9) to be the largest obstacles in combating climate change. This paper takes these structural issues as givens and implicitly assumes that they are the reason formal agreements are needed in the first place. In particular, a pre-condition for getting parties to agree to self-sacrifice in pursuit of a collective solution is to reach an agreement regarding the fair distribution of burdens. This paper focuses on the role that the self-serving bias, as opposed to differing fundamental beliefs about fairness, plays in impeding such agreement.
The countries that take part in climate change negotiations differ on myriad dimensions of potential relevance to a fair assignment of burdens, including their levels of past and projected emissions, the costs of mitigation, and the benefits obtained by successfully addressing the problem. Research on the self-serving bias (Reference Messick, Sentis, Messick and CookMessick & Sentis, 1983; Reference Bazerman, Moore and GillespieBazerman et al., 1999; Reference Diekmann, Samuels, Ross and BazermanDiekmann et al., 1997; Reference RabinRabin, 1995; Reference KonowKonow, 2000) shows that asymmetries between parties on dimensions relevant to a negotiation contribute to the bias, because people place greater weight on dimensions that support a settlement that is more beneficial to themselves (Reference Thompson and LoewensteinThompson & Loewenstein, 1992; Reference Wade-Benzoni, Tenbrunsel and BazermanWade-Benzoni et al., 1996; Reference Di, Galiani and SchargrodskyDi Tella et al., 2007).
The self-serving bias has been documented and shown to play a central role in negotiation impasse both in laboratory studies (Reference Loewenstein, Issacharoff, Camerer and BabcockLoewenstein et al., 1993; Reference Babcock, Loewenstein, Issacharoff and CamererBabcock et al., 1995; Reference Carlson and RussoCarlson & Russo, 2001; Reference Farmer and PecorinoFarmer & Pecorino, 2002) and field studies (Reference Babcock, Wang and LoewensteinBabcock et al., 1996; Reference Lange, Löschel, Vogt and ZieglerLange et al., 2010). Moreover, because negotiators are averse to accepting settlements that are even slightly below what they perceive to be fair (Reference Loewenstein, Thompson and BazermanLoewenstein et al., 1989), and because the self-serving bias leads to incongruous perceptions of fairness, there is often no settlement upon which all parties will agree, even when large joint gains are available from agreement. The large number of nations involved in climate change negotiations makes the problem even worse, not only by increasing complexity over and above that which would exist with only two parties but also by multiplying the number of possible self-serving arguments.
To illustrate the self-serving selection of fairness norms, consider the following study by van Avermaet (reported in Messick, Reference Messick and Wright1985). Subjects filled out questionnaires and were then given money which was to pay themselves as well as another person in the study for their work. If told that the other person was given half the amount of time to work and completed half as many questionnaires, subjects kept on average two-thirds of the money, an allocation proportional to both the time spent and work done. But if the other person was given twice as long and completed twice the number of questionnaires, subjects instead chose the norm of equal division and kept half the money for themselves. And finally, subjects tended to keep more than half the money in both the case where the other person was given twice as much time and filled out half as many questionnaires and the opposite case (half the time and twice the questionnaires). This indicates that subjects chose time spent or work completed as the fair payment criterion depending on which was in their own favor.
In the context of climate change, the difference in fairness norms is evidenced by the focus of some policy proposals on equal entitlement (equal per capita emission allotment) and of others on relative needs and burdens of developing versus developed nations (Reference Klinsky and DowlatabadiKlinsky & Dowlatabadi, 2009). As for which parties prefer which policies, Lange et al. (2010) show that selections of fairness criteria by agents involved in international climate policy tend to correspond to their material self-interest. Furthermore, agents are more likely to believe that self-interest influenced other parties’ selections of fairness criteria than to believe they themselves were so influenced. Though this evidence is consistent with self-serving bias (or conscious self-serving arguments, as Lange et al. (2010) propose), Lange et al.’s, study cannot rule out the possibility that there are legitimate cross-cultural differences in perceptions of what is fair, and that these differences lead to disagreement independent of the role of material self-interest.
Indeed, comparisons of fairness judgments between Americans and Chinese provide evidence of subtle dissimilarities. While members of the two cultures have similar judgments of fairness in health and safety risk scenarios, Chinese subjects tend to give other goals besides fairness more weight and are less likely to consider the fair option to be the best option overall (Reference Bian and KellerBian & Keller, 1999). In the domain of price fairness, Chinese consumers consider their own price more unfair if a friend was given a better price than if a stranger was given a better price, while Americans are less sensitive to this distinction (Reference Bolton, Keh and AlbaBolton et al., 2010). Gao (2009) found that Chinese were more tolerant of the use of market power than European cultures. One general pattern is that Chinese judgments of fairness tend to be more context dependent than those of Americans. To the extent that fairness judgments influence negotiation positions, disentangling the role of self-serving bias may give hints as to the sort of interventions that can most effectively facilitate agreement.
In particular, given the importance of agreement on a suitable plan to mitigate climate change, establishing whether disagreement is driven by self-serving bias, or by fundamental cross-cultural differences in what is perceived as fair, is of great significance. By using a controlled experiment, we attempt to establish the role of self-serving bias. Because we cannot randomly assign individuals to nationality and assess the effect that this has on their fairness judgments, we employ an approach that draws on the concept of the veil of ignorance first proposed by John Harsanyi and named by John Rawls (Reference HarsanyiHarsanyi, 1953; Reference RawlsRawls, 1971; Reference Norton and ArielyNorton & Ariely, 2011). The veil of ignorance is a judgment of social justice (fairness) made by people who do not know their own interests because they do not know what role they will be assigned. A classic application of the veil of ignorance is an indictment of slavery based on the observation that few would endorse the institution if they were unaware of whether they were the ones who would be enslaved.
We explore how judgments of the fairness of allocations of economic sacrifices resulting from reductions in greenhouse gas emissions are influenced by placing individuals in situations in which they are aware of their own national interests or not. We presented subjects with graphs that displayed current and projected per capita GDP (or income) of two countries (or farmers, in one scenario). The different possible divisions could be altered dynamically with a slider that was controlled by the subject (Figure 1), which led to shifts in per capita income over time for both parties. Subjects could move the slider between one extreme that placed all burdens on one party and the other extreme that placed all burdens on the other party, until they found the division of sacrifice that they deemed most fair.

Figure 1: Graphical fairness elicitation.
We randomly assigned students from the United States and China to one of three scenarios that varied the degree to which they were aware of their own national interests—i.e., were behind the veil of ignorance. One scenario, designed to show the impact of the self-serving bias, made the domain (climate change) explicit as well as the two countries involved (China and the United States). A second scenario disguised the countries (using the generic labels “Country A” and “Country B”), and also altered the nature of the environmental problem so subjects would be unlikely to realize that it was about climate change. A third scenario disguised the problem even further, casting it as a negotiation between two neighboring farmers. Although the scenarios differed on multiple dimensions, the relative economic consequences of shifting burdens between the parties were identical in all three.
Our goal in this research is not to suggest implementing a veil of ignorance in real climate negotiations as a policy recommendation (though if doing so were possible, we would support it). Our contribution is to demonstrate a simple experimental procedure that can isolate the effect of self-serving bias from the possible effects of cultural differences in perceptions of fairness. Doing so helps us clearly establish that self-serving bias plays a role in the inability of parties to reach agreement. Our findings also suggest that interventions that eliminate the self-serving bias in international climate policy negotiations may be of tremendous value.Footnote 1 Finally, our study identifies subpopulations that may be more susceptible to self-serving bias, which may facilitate targeted interventions to influence opinion and allow agreement.
2 Method
The survey was conducted as a randomized experiment with a 2 (Population) X 3 (Context) X 2 (Slider position) between subjects design. The two populations were Chinese students who completed the survey in Mandarin and American students who completed the survey in English. We used students for two reasons. First, students represent a relatively similar demographic across different countries. Although college students are not representative of the population of either China or the U.S., the similarity of their social and economic position enhances the validity of comparing and averaging across their responses. Second, college students are sufficiently intelligent and well educated to think about the kinds of issues that were posed by the elicitation method, and they have credibility as a nation’s likely future policy makers. Subjects were recruited either at the end of classes or from public locations at their respective universities. We describe the recruitment procedures and monetary incentive below. Following recruitment, an experimenter guided subjects to a computer terminal, where they completed the online survey.
Each subject was randomly assigned to one of three contexts, all of which involved two parties that needed to share the economic burden associated with solving a joint problem. One context involved the U.S.A. and China, the second involved two generic countries (“Country A” and “Country B”), and the third involved two neighboring farmers (“Farmer A” and “Farmer B”). The key sections of the description for each of the three contexts are presented in Table 1. In addition to this context, the economic state of the two parties was summarized by per capita GDP (USA/China and CountryA/B contexts) or income (FarmerA/B context) and associated projected growth rates for each of the two parties. This information was presented numerically as well as graphically and was identical for each of the three contexts.
Table 1: Three survey contexts.

After seeing this information, subjects were presented with graphs that displayed current and projected per capita GDP (or income), under different possible divisions of the economic burden associated with solving the problem (Figure 1). The different possible divisions could be altered dynamically with the slider. As the slider was moved, the lines in the graphs indicating both countries’ (or farmers’) “with sacrifice” per capita GDP (or income) shifted, and subjects could move the slider until they found the division of sacrifice that they deemed most fair. To test and control for anchoring effects, the starting position of the slider was randomized across subjects to be all the way to the left or all the way to the right. Subjects were not aware that the study involved Chinese and American populations, that there were three different contexts (they were only aware of the particular context in which they made a choice) or that the slider position was randomized.
After submitting their decision, subjects were told what percentage of the burden they had allocated to each party and were presented with a table indicating the numerical implications of this decision (per capita GDP or income for each of the two parties in the year 2010, 2020, 2030 and 2040). The same graph and slider were presented on this page (with the slider starting at the position they had specified on the previous page), and subjects had the opportunity to revise their decision. As they moved the slider on this page, the numbers in the table as well as the lines on the graph changed. After submitting the slider position this second time, subjects answered several attitudinal and demographic questions.
2.1 Construction of Stylized Model of Relative Burdens
Our goal in presenting per capita GDP for the U.S. and China both with and without the necessary sacrifices needed to combat climate change was not to develop a model that was as realistic as possible; nor was it to capture the underlying uncertainty that is unavoidable in such an endeavor. Rather, our goal was to create a simplified version of the problem that captured a few of its most important features.
We based the model on parameter estimates taken from maximally authoritative sources. Because the U.S. GDP growth is not expected to have dramatic long-term changes, we used the historic 30-year average according to data from the U.S. Bureau of Economic Analysis. Because China’s GDP growth is very unlikely to remain at recent historic levels, such an assumption for China would have been inappropriate. Instead, we referred to a Goldman Sachs Global Economics Paper (Reference Wilson and StupnytskaWilson & Stupnytska, 2007) for projections of China’s GDP growth over the next 30 years. To make the presentation and interpretation of this information as simple as possible for subjects, we used the average projected growth rate over this time frame, and we expressed all numbers in terms of nominal rather than real GDP. Population growth rates for both countries were assumed to remain at their 2009 levels.
The most controversial assumption of the model is that the necessary economic sacrifice required to combat climate change is 1% of world GDP. This estimate was taken from the Stern Review on the Economics of Climate Change (Reference SternStern, 2006) written for the British government. Because our scenario involved only two parties, we used 1% of joint GDP as the required sacrifice.
With these figures, we calculated the absolute dollar sacrifice that must be made by the two parties. The slider presented to subjects (Figure 1) operated linearly on this absolute dollar amount. That is, if located one third of the way from the left, the U.S.A. (or Country/Farmer A) would bear two-thirds of the absolute dollar cost and China (or Country/Farmer B) would bear one-third. The implications of this division on per capita GDP (or income) with sacrifice would then be immediately reflected in the graph.
We reiterate that this model is intended only as a qualitatively appropriate simplification of the economics underlying the problem. For example, our design does not attempt to incorporate other features that are relevant to fairness, such as how each party’s historic behavior has contributed to the problem (Reference Rive, Torvanger and FuglestvedtRive et al., 2006). Also, to allow for a graphical elicitation procedure that does not require multiple dependent inputs, our study simplifies the negotiation process to include only two parties. That is, rather than attempting to capture all the inherent complexity of multi-national climate change negotiations, our design serves as a proof of concept that the relative roles of self-serving bias and cultural differences in fairness judgments can be disentangled.
The key property of international climate negotiations that is reflected in our design is the fact that one party is wealthier but growing more slowly and the other party is poorer but growing more quickly. Even substantial deviations in the parameters used would leave these features unchanged. It is also important to note that the only numerical details initially given to subjects were the current per capita GDP (or income) and the growth rate for each party. The model of relative burdens was presented only graphically and the potentially confusing numerical details were not presented to subjects. To avoid overwhelming them with information, we showed subjects numerical implications of their choices only after making their initial decision. At this point they could revise their choice if they so desired.
2.2 Recruitment procedures
The survey was conducted with subjects recruited from Renmin University of China in Beijing, China and from Carnegie Mellon University in Pittsburgh, Pennsylvania, U.S.A. The Renmin University subjects were recruited from large class lectures with a brief announcement of the opportunity to participate in a survey for a fixed cash payment of 15 Yuan (approximately US$2.25). Interested students were taken to a computer lab where they completed the survey online. Seats were not assigned and so it was clear to subjects that responses could not be traced to particular individuals. Furthermore, dividers between computers prevented communication between subjects. Subjects were not informed of the topic of the survey in advance, but were told that it would take approximately 15 minutes and had no impact on their standing in the class from which they were recruited.
Approximately half the Carnegie Mellon University subjects were recruited by the same method. To reach the required number of subjects, however, it was necessary to use an additional recruitment procedure. In the student center, which is centrally located on campus and frequented by most students, a researcher was stationed with several laptop computers. All Carnegie Mellon University subjects were given a cash payment of $5 (roughly equivalent in purchasing power to the 15 Yuan given to Chinese subjects). One minor difference in procedure at Carnegie Mellon University was that there were no dividers between computers. However, subjects were instructed not to communicate during the survey and all subjects complied with this instruction.
3 Results
There were 292 Renmin University subjects and 429 Carnegie Mellon University subjects. However, 97 of the Carnegie Mellon University subjects were not U.S. citizens. Because country of citizenship is directly relevant to the self-serving bias in these contexts, the main analysis is restricted to the 332 Carnegie Mellon University subjects who are also U.S. citizens and the 292 Renmin University subjects (all of whom were Chinese citizens).
3.1 Demographic and Attitudinal Data
The vast majority of subjects from each population were between 18 and 20 years old (76.7% in China and 77.4% in the U.S.). Details are provided in Tables 4 and 5 in the Appendix.
In addition to demographic information, subjects were asked several questions relating to global warming, the environment, patriotism and social issues. The biggest differences between the two populations are in their responses to the environmental questions. Chinese subjects are less satisfied with the quality of air, the quality of water and efforts to preserve the environment in the city or area in which they live. Furthermore, we expected Chinese subjects to be hesitant to report low patriotism. For this reason, we included other questions that we suspected would correlate with their political attitudes. In particular, the Chinese government opposes both gambling and pre-marital sexual activity, though both are in fact commonplace. Though opposing the Chinese government directly is forbidden, holding divergent views on these topics is more acceptable. Detailed results for these attitudinal questions are presented in Tables 6 and 7 of the Appendix.
3.2 Fairness Judgments
The American and Chinese subjects strongly disagreed on the fair division of burden in the USA/China context, in a manner consistent with the self-serving bias. However, their judgments of what constitutes a fair division were virtually identical when behind a mild veil of ignorance. Thus, the different perceptions of what is fair in the USA/China context did not result from inherent cultural differences. In the USA/China context, American subjects proposed that China should bear 41.7% of the cost while Chinese subjects specified that they should bear 26.3% of the cost (t=−6.17, p<.0001). However in the CountryA/B context, American subjects specified that country B (which was equivalent to China in the first scenario) should bear 33.9% of costs and Chinese subjects specified that country B should bear 33.6%. These mean results are presented in Table 2, while the implications of these judgments on nominal per capita GDP (or income) in the year 2040 are presented in Table Table 3. A two-way ANOVA reveals this interaction between population and context to be highly significant, F(1,437)=18.49, p<.0001.
Table 2: Final ratio (percent burden on China/B).
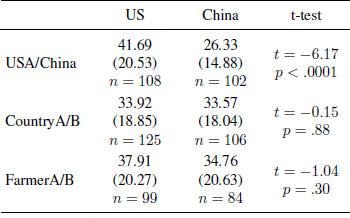
Standard errors in parentheses
Table 3: Nominal per capita GDP (or income) in 2040.

As for the Carnegie Mellon University subjects who were not U.S. citizens, their mean judgment of the fair burden on China in the USA/China context was 33.23% (n=31), which is lower than that of U.S. citizens (t=2.02, p<.05) and higher than that of Chinese citizens (t=2.05, p<.05). Their mean judgments were not significantly different in the CountryA/B (38.12%, n=33) or FarmerA/B (38.67%, n=33) contexts (t=−1.04, p=.30 and t=−0.91, p=.37, respectively).
A more detailed breakdown of the distribution of responses of U.S. and Chinese citizens is presented in Figure 2. Note that the difference between the USA/China context and the CountryA/B context for both the American and Chinese subjects is driven not by a small number going to extremes, but was produced by a more incremental mean-shift of each population.
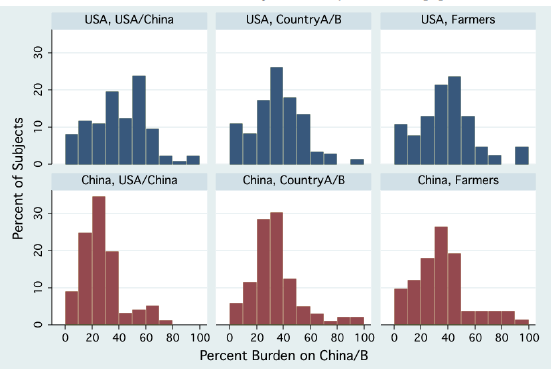
Figure 2: Distribution of fairness judgments by context and population.
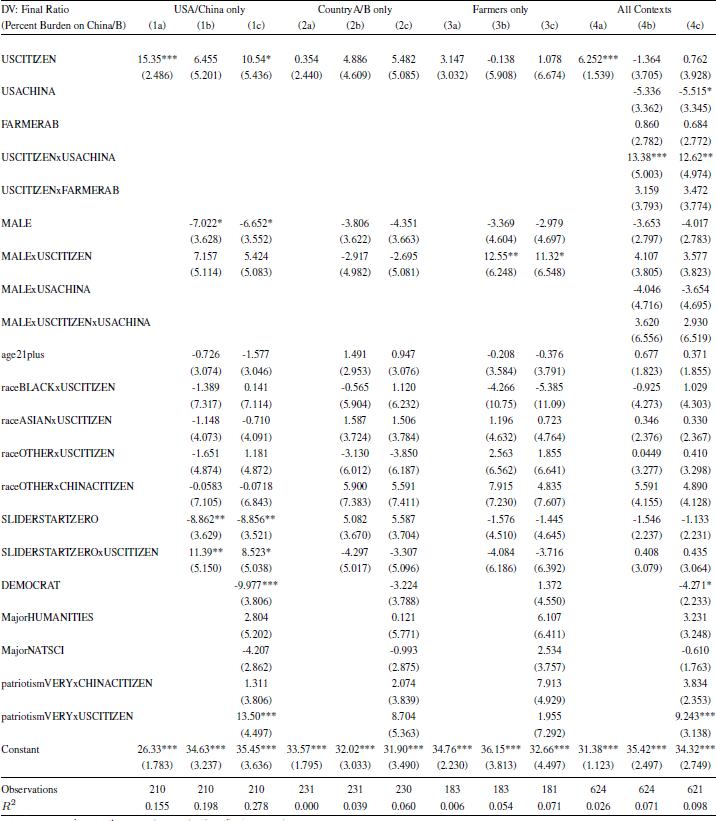
To examine the data in more depth and to control for the various demographic differences between the two populations, we ran regressions with the percent burden on the second party (China, Country B or Farmer B) as the dependent variable. The main insight from these regressions is that the self-serving bias is very robust to statistical controls in the USA/China scenario, and the lack of difference is equally robust in the other two scenarios. Furthermore, there is evidence of what could be called “motivated anchoring” on the part of Chinese subjects. That is, only in the USA/China context, Chinese subjects were more likely to propose divisions that favored China when they did not have to move the slider very far to do so. This effect is not present for American subjects, F(1,194)=0.01, p=0.92. The fact that this effect is found only for the USA/China scenario supports the idea that the bias is motivated. That is, subjects did not exhibit such anchoring when behind the veil of ignorance. Table 8 in the Appendix presents these models broken down by context and also for all three contexts combined.
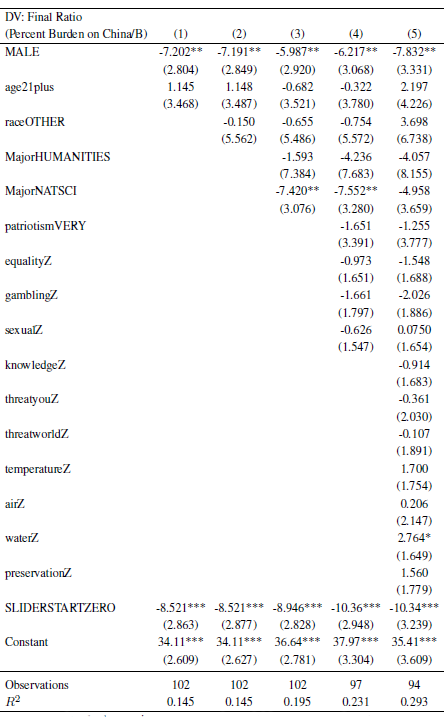
For a more detailed examination of the predictors of responses in the USA/China scenario, where we observe self-serving bias, we conducted regressions separately for each population and including all of the attitudinal variables (Tables 9 and 10 in the Appendix). The main insights gained from the regressions of U.S. citizen responses are that Democrats are less self-serving and those who are very patriotic are more self-serving. As for Chinese citizens, the self-serving bias is stronger for males and stronger for those who study natural sciences. Also, the tendency for Chinese subjects to give more self-serving judgments when the slider begins on the end of the scale favoring China is robust to controls.
Finally, we ask whether agreement between the two countries increases when subjects are placed behind the veil of ignorance. A statistic to measure potential agreement is the proportion of pairs of U.S. and Chinese subjects whose judgments are compatible. That is, we calculate the probability that a random U.S. subject and a random Chinese subject in our sample give fairness judgments that would require no additional concessions by either side for an agreement to be achieved. Assuming two continuous and identical distributions of responses—i.e., the judgments of what is fair are identically distributed across countries—then the maximum possible agreement frequency would be .5. We therefore construct an index of agreement relative to this theoretical maximum and express the result on a zero to one scale—an index score of zero indicates agreement between the two populations never occurs, while a score of 1 indicates that subjects from one country are as likely to agree with subjects from the other country as with those from their own (agreement frequency of .5). In the USA/China context, the index of agreement between US-China pairs is a modest .54. However, in the CountryA/B context, the index of agreement between US-China pairs is .95. The index of agreement for the FarmerA/B context is also high (.87). This improvement in the veil of ignorance context is quite dramatic and suggests that, once we remove the nationalistic self-serving bias, agreement may occur with very high frequency.
4 Discussion
We first demonstrated that differing perceptions of fairness pose a problem for obtaining international agreement on the distribution of the economic burden of mitigating climate change. In judging what is “fair,” subjects from the U.S.A. and from China provided very different responses. Both groups’ ideas of fairness tended towards their own national interests. The likely resulting impasse mirrors the outcome of recent high-level negotiations, such as in Copenhagen in 2009.
In light of the large disagreement between American and Chinese subjects in the USA/China context, the most dramatic finding is that this difference is completely eliminated by merely labeling the parties “Country A” and “Country B” and changing the problem from climate change to a different but analogous situation. We argue that this points to self-serving bias as the driving force behind disagreement, as opposed to fundamental cultural differences in beliefs about what is fair. Moreover, as we anticipated, our results indicate that common ground in allocating the burden of mitigating climate change is possible if negotiators can somehow be immunized against the self-serving bias.
The fact that no demographics affected assessments of fairness in the two veil of ignorance conditions (with the possible exception of gender for American subjects, but only in the neighboring farmers context) further points to the robustness of the methods. Only where countries were identified and the context was familiar did variations in demographics matter, and they mattered in a fashion consistent with the values of those groups (e.g., those who are more patriotic). The fact that certain subpopulations exhibit greater tendency to be influenced by self-serving bias also raises the possibility that these groups could be targeted in any intervention designed to alleviate the bias.
The point of this exercise has not been to estimate the fair distribution of greenhouse gas mitigation burden for the U.S. and China. Nor has it been to propose the veil of ignorance as a feasible intervention in real climate negotiations. Instead, it is to suggest that there could be a broad consensus about the fair distribution of burdens between different parties in this kind of negotiation. Moreover, by using an experiment in which our manipulated treatment variable affects the presence of self-serving judgments, we show that disagreement is not due to ingrained cultural differences in beliefs about fairness. We therefore go beyond existing research in more cleanly demonstrating the impact of self-serving bias as an impediment to reaching agreement. Our study gives reason for optimism that interventions to mitigate self-serving bias, if discovered, can greatly improve our prospects of reaching an international agreement on greenhouse gas emissions reduction and climate policy.
Appendix
Table 4: Race by population.
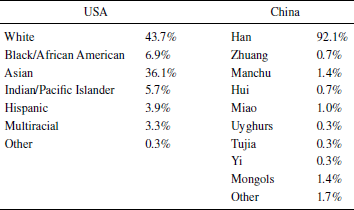
Table 5: Demographics by population.
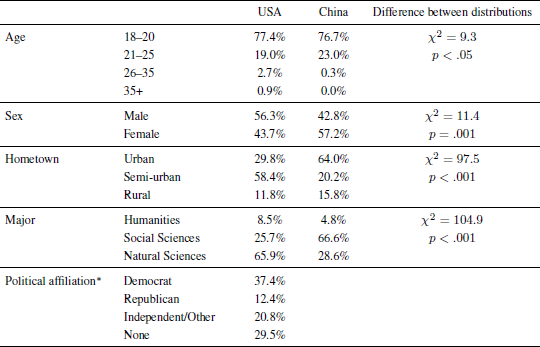
* Due to the lack of political freedom in China, political affiliation is not an applicable question.
Table 6: Patriotism and social issues items.
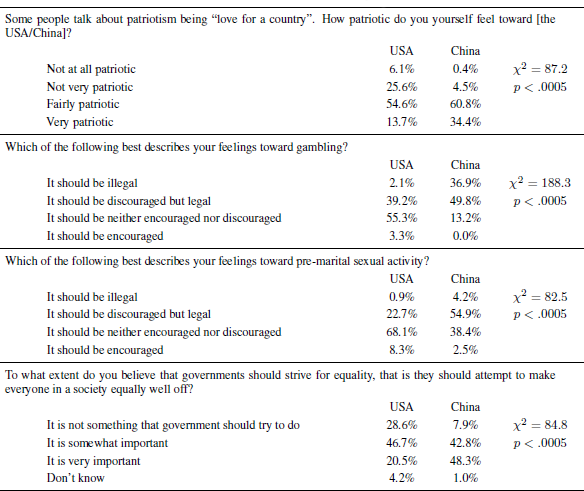
Note: The patriotism question was taken from a survey commissioned by the BBC.
(http://www.icmresearch.co.uk/pdfs/2002_december_bbc_radio_4_patronism_poll.pdf)
Table 7: Global warming and environmental items.
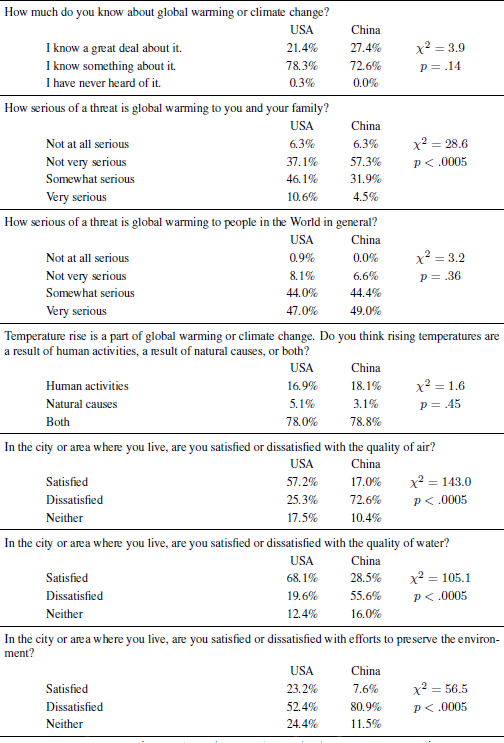
Note: These questions are taken from the Gallup World Poll set of core questions.
(http://media.gallup.com/dataviz/www/WP_Questions_WHITE.pdf)
Table 8: OLS regression analysis.
Standard errors in parentheses;
*** p<0.01
** p<0.05.
* p<0.1
Note: The variable USCITIZEN is equal to 1 for Carnegie Mellon University subjects who are also U.S. citizens and is equal to 0 for Renmin University subjects (recall that CMU subjects who are not U.S. citizens are excluded from this analysis). The variable raceOTHERxUSCITIZEN is equal to 1 for American subjects who identified themselves as Indian/Pacific Islander, Hispanic, Multiracial or Other and is equal to 0 otherwise. The variable raceOTHERxCHINACITIZEN is equal to 0 for the Chinese subjects who identified themselves as Han. Majors were coded as humanities, social sciences or natural sciences and these classifications were used to create the dummy variables MajorHUMANITIES and MajorNATSCI. The patriotismVERY interaction variables are equal to 1 for subjects who identified themselves as very patriotic and equal to 0 otherwise. Finally, the variable SLIDERSTARTZERO is equal to 1 if the slider starting position was randomly determined to be to the far left (zero burden on China/Country B/FarmerB) and 0 if the slider starting position was randomly determined to be to the far right (full burden on China/Country B/FarmerB).
Table 9: OLS regression analysis for US citizens and USA/China context only.
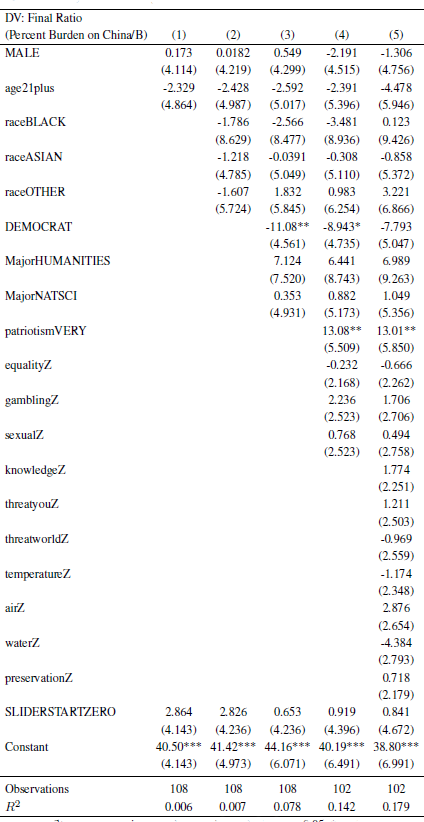
Note: The patriotism item is included as the patriotismVERY dummy for ease of interpretation. The other attitudinal variables (none of which significantly predict the dependent variable) are included as z-scores. Higher values are associated with greater belief in the importance of the government pursuing equality for equalityZ, greater approval (or less disapproval) for gamblingZ and sexualZ, greater knowledge of climate change for knowledgeZ, greater concern for threatyouZ and threatworldZ, more belief that climate change is due to human activity for temperatureZ and more dissatisfaction for airZ, waterZ and preservationZ.
Standard errors in parentheses;
*** p<0.01
** p<0.05.
* p<0.1
Table 10: OLS regression analysis for China citizens and USA/China context only.
Standard errors in parentheses;
*** p<0.01
** p<0.05.
* p<0.1


 Open access