

1 Introduction
In economic theory, risk aversion is assumed to be a key determinant of human decision making. Naturally, the study of risk aversion has gained a lot of attention, attracting researchers from all over the world. For the past two decades, a number of scholars have argued that highly intelligent individuals tend to be less risk averse (Reference Benjamin, Brown and ShapiroBenjamin, Brown & Shapiro, 2013; Reference Dohmen, Falk, Huffman and SundeDohmen, Falk, Huffman & Sunde, 2010, 2018; Reference FrederickFrederick, 2005), and thus more likely to optimize their choices in line with the normative benchmark of Expected Utility Theory (Reference RabinRabin, 2000; Reference Rabin and ThalerRabin & Thaler, 2001). Although a substantial amount of empirical evidence supports this conclusion (Reference Dohmen, Falk, Huffman and SundeDohmen et al., 2018), several studies do not find cognitive ability to be consistently related to risk aversion. For instance, some studies have found cognitive ability to be negatively related to risk aversion in the domain of gains but positively related in the mixed domain (Reference Burks, Carpenter, Goette and RustichiniBurks, Carpenter, Goette & Rustichini, 2009; Reference Chapman, Snowberg, Wang and CamererChapman, Snowberg, Wang, & Camerer, 2018). Similarly, Andersson, Holm, Tyran and Wengström (2016), concluded that the relationship might be spurious and dependent on the choice architecture of the decision task used to elicit risk preferences. Specifically, they reported a negative relationship when the percentage of alternative responses indicating risk aversion was set to 80% and a positive relationship when this was set to 50%. A potential explanation for this result is that people with low cognitive ability tend to make more random errors, leading risk aversion to be overestimated for this group when the percentage of alternatives permitting a choice indicating risk aversion is high, while underestimated when the opposite is the case (Reference Andersson, Holm, Tyran and WengströmAndersson et al., 2016). Finally, several studies suggest that the negative relationship between cognitive ability and risk aversion exists only when the decision task used to elicit risk aversion is unincentivized and purely hypothetical (Reference Sousa and RangelSousa & Rangel, 2014; Reference TaylorTaylor, 2013, 2016). In summary, it is unclear whether a negative relationship actually exists, and if so, to what extent. The purpose of this study is to investigate the nature of the relationship between cognitive ability and risk aversion, through a systematic literature review and meta-analysis.
The remainder of this article is organized as follows. First, a brief definition of cognitive ability and risk aversion is provided. Next, several theoretical explanations for why cognitive ability and risk aversion might be negatively related are presented, followed by an outline of the present investigation. Then the literature review and meta-analysis are discussed.
1.1 Defining Cognitive Ability and Risk Aversion
When conducting a systematic literature review and meta-analysis it is important to define the key variables of interest (Reference Borenstein, Hedges, Higgins and RothsteinBorenstein, Hedges, Higgins & Rothstein, 2009; Reference CooperCooper, 2010).
Cognitive ability is one of the best researched, yet most controversial constructs within the field of psychology (Reference EysenckEysenck, 1998; Reference Freund and KastenFreund & Kasten, 2012; Reference SternbergSternberg, 1985). In general terms, cognitive ability is considered an extensive category, encompassing a wide range of abilities such as reasoning, problem solving and abstract thinking (Reference GottfredsonGottfredson, 1997). Throughout the history of the field, several influential scholars have attempted to converge on a single definition of the construct (Reference CarrollCarroll, 1997; Reference Freund and KastenFreund & Kasten, 2012). Although no uniform definition of cognitive ability exists, Reference Murphy and DavidshoferMurphy and Davidshofer (1998) provides a definition that has proven useful in applied psychology (e.g., Reference Seijts and CrimSeijts & Crim, 2009; Reference Yeo and NealYeo & Neal, 2004). In line with their definition, cognitive ability will for the purposes of this study be defined as individual differences in the capacity to successfully perform tasks that require the manipulation, retrieval, evaluation or processing of mental information. This definition is closely related to what psychologists refer to as g or general cognitive ability, a factor considered to be the core of, and primary source of variance common to, cognitive abilities and cognitive ability tests (Reference SpearmanSpearman, 1904a; Reference Yeo and NealYeo & Neal, 2004).
Based on the definition put forward by Reference Fox, Erner and WaltersFox, Erner and Walters (2016), an individual will for the purposes of this study be considered risk averse if he or she prefers a certain or risky option to a riskier option with equal or higher expected value. Conversely, an individual will be considered risk seeking, if he/she prefers a risky option to a certain or less risky option with higher expected value.
1.2 Theoretical Explanations
Various theoretical explanations have been put forward to explain why cognitive ability and risk aversion might be negatively related. One prominent explanation based on dual process theory (Reference Evans and StanovichEvans & Stanovich, 2013; Kahneman & Frederick, 2002; Reference Loewenstein and O’DonoghueLoewenstein & O’Donoghue, 2004) is that people with high cognitive ability are more reflective and, thus, less likely to make judgement and decision errors (Reference Benjamin, Brown and ShapiroBenjamin et al., 2013). According to dual-process theory, judgment and decision-making is the result of an interaction between two distinct cognitive processes; type 1 and type 2 (Reference Evans and StanovichEvans & Stanovich, 2013). Type 1 are fast, automatic, low-effort and high-capacity processes, usually associated with heuristic and intuitive decision-making (Reference Evans and StanovichEvans & Stanovich, 2013; Reference FrankishFrankish, 2010). Type 2 are conversely, slow, controlled, high-effort and low capacity processes, typically associated with deliberate, reflective and rational decision-making (Reference Evans and StanovichEvans & Stanovich, 2013; Reference FrankishFrankish, 2010). Given that type 2 processes are assumed to tax working memory capacity (Reference Evans and StanovichEvans & Stanovich, 2013; Reference StanovichStanovich, 2010), which is known to be highly correlated with cognitive ability (Reference Conway, Kane and EngleConway, Kane & Engle, 2003; Reference Kyllonen and ChristalKyllonen & Christal, 1990; Reference Süß, Oberauer, Wittmann, Wilhelm and SchulzeSüß, Oberauer, Wittmann, Wilhelm, & Schulze, 2002), it is likely that people with high cognitive ability are more capable of engaging in reflective and rational decision-making. The dual-process explanation holds that people with high cognitive ability are likely to realize that risk aversion over small stakes is irrational (Reference RabinRabin, 2000; Reference Rabin and ThalerRabin & Thaler, 2001), because they have more cognitive capacity to deliberately reflect and think about their choices. In support of this argument, Reference Cokely and KelleyCokely and Kelley (2009) found that highly intelligent individuals were more likely to engage in expected value maximization, report more elaborate and reflective thought patterns, and spend more time deliberating when choosing between prospects. Moreover, many other studies have shown that people with high cognitive ability display fewer behavioral biases across a wide range of decision tasks that arguably require type 2 processes to derive what is considered to be the normative response (e.g., Reference Bergman, Ellingsen, Johannesson and SvenssonBergman, Ellingsen, Johannesson & Svensson, 2010; Reference Hoppe and KustererHoppe & Kusterer, 2011; Reference Oechssler, Roider and SchmitzOechssler, Roider & Schmitz, 2009; Reference Stanovich and WestStanovich & West, 1998; Reference Toplak, West and StanovichToplak, West & Stanovich, 2011).
A similar explanation is that people with high cognitive ability are more likely to bracket their choices broadly; considering the bearing of their experimental decisions in a broader lifetime perspective (Reference Dohmen, Falk, Huffman and SundeDohmen et al., 2010; Reference Koch and NafzigerKoch & Nafziger, 2016; Reference Read, Loewenstein and RabinRead, Loewenstein & Rabin, 1999). Theoretically, this makes sense, as broad bracketing is cognitively taxing compared to narrow bracketing (Reference Read, Loewenstein and RabinRead et al., 1999), increasing the likelihood that people with low cognitive ability engages less in broad bracketing due to a lack of cognitive resources. Hence, given that broad bracketing has been linked with lower levels of risk aversion (Reference Gneezy and PottersGneezy & Potters, 1997; Reference Hilgers and WibralHilgers & Wibral, 2014; Reference Thaler, Tversky, Kahneman and SchwartzThaler, Tversky, Kahneman & Schwartz, 1997), it is not unlikely that broad bracketing is one of the driving forces behind the negative relationship between cognitive ability and risk aversion observed in some previous studies.
A third possible explanation is that risk preferences play a role in the development of cognitive ability, and that individual risk preferences influence people’s choice of environment, which in turn could affect cognitive development (Reference Dohmen, Falk, Huffman and SundeDohmen et al., 2018). As an example, risk preferences might play a role in choices about investment in education, which has been shown to foster the development of cognitive abilities (Reference Falch and Sandgren MassihFalch & Sandgren Massih, 2011; Reference Ritchie, Bates and DearyRitchie, Bates & Deary, 2015; Reference Schneeweis, Skirbekk and Winter-EbmerSchneeweis, Skirbekk & Winter-Ebmer, 2014). On the other hand, it is of course possible that people with high cognitive ability seek out environments which foster the development of risk tolerance. For instance, several studies have shown that people with high cognitive ability are more active in the stock market (Reference Christelis, Jappelli and PadulaChristelis, Jappelli & Padula, 2010; Reference Grinblatt, Keloharju and LinnainmaaGrinblatt, Keloharju & Linnainmaa, 2011; Reference Van Rooij, Lusardi and AlessieVan Rooij, Lusardi & Alessie, 2011), which could lead them to become more risk tolerant over time.
Finally, it could be that the relationship between cognitive ability and risk aversion, is coevolutionary: meaning that certain configurations of cognitive ability and risk aversion have been evolutionary beneficial (Dohmen et al., 2010, 2018). Hence, evolutionary pressures might have created a general tendency for low cognitive ability to be coupled with risk aversion and vice versa.
1.3 The Present Investigation
In light of the mixed findings on the relationship between cognitive ability and risk aversion, the first aim of this study is to systematically investigate the nature of the relationship across the domain of gains, mixed and losses. In line with the existing literature, the second aim is to examine to what extent the choice architecture of the decision task used to elicit risk preferences influence the relationship between cognitive ability and risk aversion. The current study will also ask whether the relationship exists only when the decision task is unincentivized and purely hypothetical, and whether the relationship is influenced by how cognitive ability is measured. Finally, given that age (Reference Defoe, Dubas, Figner and van AkenDefoe, Dubas, Figner & van Aken, 2015; Reference Mata, Josef, Samanez-Larkin and HertwigMata, Josef, Samanez-Larkin & Hertwig, 2011) and gender (Reference Charness and GneezyCharness & Gneezy, 2012; Reference Croson and GneezyCroson & Gneezy, 2009) have been found to be related to risk preferences, the last aim of this study is to investigate the influence of these variables on the relationship between cognitive ability and risk aversion.
2 Method
In line with the guidelines provided by Cooper (2010) the systematic literature review and meta-analysis performed in this study comprised three steps: (1) literature search, (2) data extraction and coding, and (3) data analysis.
2.1 Step 1. Literature Search
In order to identify studies examining the relationship between cognitive ability and risk aversion, the following four electronic databases were searched: Econlit, PsycInfo, Business Source Complete, and Academic Search Complete. All databases were searched using the following keywords in the first search field: “risk avers*” OR “loss avers*” OR “prospect theory” OR “expected utility” OR “risk toleran*” OR “risk preference*” OR “risk neutral” OR “risk attitude*”; and the following keywords in the second search field: “cognitive abilit*” OR “intelligence” OR “IQ” OR “cognitive skills” OR “mental abilit*” OR “cognitive function*” OR “cognitive performance” OR “intelligence quotient” OR “general mental abilit*” OR “cognitive capacit*” OR “mental capacit*” OR “intellectual function*”. The keywords from the two search fields were combined using the Boolean operator “AND”, leading to the final search string presented below: (“risk avers*” OR “loss avers*” OR “prospect theory” OR “expected utility” OR “risk toleran*” OR “risk preference*” OR “risk neutral” OR “risk attitude*”) AND (“cognitive abilit*” OR “intelligence” OR “IQ” OR “cognitive skills” OR “mental abilit*” OR “cognitive function*” OR “cognitive performance” OR “intelligence quotient” OR “general mental abilit*” OR “cognitive capacit*” OR “mental capacit*” OR “intellectual function*”)
The search was limited to studies written in English published from 1900 to 2018 and yielded a total of 692 hits. Next, Scopus was searched using the same combination of keywords in first and second search-field. The Scopus search was also limited to studies written in English, published from 1900 to 2018 and yielded a total of 658 hits. Finally, four independent searches on Google Scholar were conducted using the keywords: (1) “risk aversion” AND “cognitive ability”; (2) “risk aversion” AND “intelligence”; (3) “risk aversion” AND “mental ability”; (4) “risk aversion” AND “cognitive skills”. Each independent Google Scholar search resulted in somewhere between 625 and 19, 900 hits, of which Google Scholar displayed the first thousand. All searches were conducted from 03.12.2018 to 11.12.2018. To supplement the electronic search, a manual search of reference lists of key empirical and theoretical articles was performed. The manual search yielded no additional studies. For all studies identified as relevant, title and abstract were screened for appropriate content and a total of 633 studies were extracted for full text screening. For an overview of the literature search process see Figure 1.
Overview of the literature search.

2.2 Exclusion and Inclusion Criteria
Studies were included for data extraction and coding if they reported either Pearson´s r, Spearman´s rho, means and standard deviations (i.e., descriptive statistics), or beta-coefficients for the relationship between cognitive ability and risk aversion. Studies were excluded if they (a) investigated decision-making under ambiguity, (b) relied on self-report measures of risk aversion, (c) used academic performance, literacy, reading proficiency, financial literacy, or educational attainment as proxies for cognitive ability, or (d) solely relied on participants experiencing any form of mental health problems or cognitive impairment. After carefully reviewing all 633 studies based on the inclusion and exclusion criteria, 287 studies were selected for coding and data extraction. More specifically, 111 studies were excluded because they relied upon self-report measures of risk aversion, while 114 studies were excluded for using either academic performance, literacy, reading proficiency, financial literacy or educational attainment as proxies for cognitive ability. Another 107 studies were excluded because they did not report data on either cognitive ability, risk aversion or both. Three studies were excluded because data were available only for participants with mental health problems or cognitive impairment. Finally, 11 studies were excluded for investigating decision-making under ambiguity.
2.3 Step 2. Data Extraction and Coding
In order to obtain as much data as possible, all corresponding authors were contacted via email and asked to provide the raw data or any relevant information on the relationship between cognitive ability and risk aversion in all three domains. The response rate was approximately 29%. Next, data was extracted from the remaining 205 studies from which the raw data was not obtained. Following, Peterson and Brown (2005), Pearson’s r was imputed from beta coefficients using the following formula whenever necessary: r = β + .05λ, where λ = 1 if β > 0 and λ = 0 if β < 0. In cases where only means and standard deviations were reported, Pearson´s r was computed by using the formulas provided by Borenstein et al. (2009). Whenever data for the same participants was reported across multiple outcomes, effect sizes were combined, in line with guidelines provided by Borenstein and colleagues (2009). In 134 studies out of the 287 studies included for data extraction, the information reported on the relationship between cognitive ability and risk aversion was insufficient. That is, even though these studies appeared to contain data on both cognitive ability and risk aversion neither Pearson´s r, Spearman’s rho, nor the data necessary to impute Pearson´s r were reported. Hence, data was available from 153 articles. Among these, several had overlapping data. To avoid using the same data multiple times, only one study per data set was included in the final analysis. In total, 97 studies were included for meta-analysis in the domain of gains, 41 in the mixed domain, and 12 in the domain of losses.
To allow for moderator analysis, studies were coded based on several different features. First, all studies were coded based on sample characteristics, including mean age of the participants, male to female ratio, and sample type (i.e., student, community or children). Second, studies were coded based on the class of decision task used to measure risk aversion. More specifically, each decision task was categorized based on whether it was incentivized, the probabilities and payoffs were varied or kept constant and if there was a certain option or not. The percentage of possible risk averse choices (i.e., the percentage of choices in which the riskier option had equal or higher expected value than the safer option) was also calculated if possible. Third, in order to investigate the extent to which the study purpose influenced results, all studies were coded based on whether or not one of their primary objectives was to investigate the relationship between cognitive ability and risk aversion. Fourth, studies were coded based on the psychometric measure used to assess cognitive ability (as described shortly), and whether or not participants received payment for participating in the experiment.
2.4 Measures of Cognitive Ability
All studies included measured cognitive ability with one of the following psychometric measures: Cognitive Reflection Task (CRT), Raven´s Progressive Matrices (RPM), numeracy tests (NUM), working memory capacity tests (WMC), or cognitive ability test batteries (CATB).
CRT is a three-item instrument designed to measure cognitive ability and reflective thinking (Reference FrederickFrederick, 2005). The task is frequently used in experimental research within the field of economics (e.g., Reference Albaity, Rahman and ShahidulAlbaity, Rahman, & Shahidul, 2014; Reference Corgnet, Espín, Hernán-González, Kujal and RassentiCorgnet et al., 2016; Reference Deppe, Gonzalez, Neiman, Jacobs, Pahlke, Smith and HibbingDeppe et al., 2015) and has been associated with other measures of cognitive ability such as the Wonderlic Personnel Test (Reference FrederickFrederick, 2005).
RPM is a widely recognized nonverbal measure of fluid intelligence which has been used across a wide range of disciplines (Reference Carpenter, Just and ShellCarpenter, Just & Shell, 1990; Reference RavenRaven, 2000). It consists of 3 x 3 matrices, in which the bottom right figure is missing and must be identified among several alternatives. The test-taker is instructed to look across the rows and/or down the columns to find a pattern and determine the missing entry. Importantly, the difficulty of the matrices is gradually increased, so that it requires greater mental capacity to determine the missing entry for each consecutive matrix (Reference RavenRaven, 2000).
NUM refers to a variety of tests designed to measure numerical ability. NUM usually consists of a range of mathematical problems to be solved without using a calculator (e.g., Cokely, Galesic, Schulz, Ghazal & Garcia-Retamero, 2012; Reference Lipkus, Samsa and RimerLipkus, Samsa & Rimer, 2001; Weller et al., 2013). Numerical ability has consistently been linked with numerous cognitive ability measures (e.g., Cokely et al., 2012; Reference Cokely and KelleyCokely & Kelley, 2009; Reference Del Missier, Mäntylä and De BruinDel Missier, Mäntylä & De Bruin, 2012; Reference Liberali, Reyna, Furlan, Stein and PardoLiberali, Reyna, Furlan, Stein & Pardo, 2012), and can be considered a reasonable measure of cognitive ability.
WMC typically consist of a set of tasks where the participant is asked to recall a number of items while performing an attention-demanding assignment (Reference EngleEngle, 2002). Working memory capacity has consistently been found to be highly correlated with general intelligence (Reference Conway, Kane and EngleConway et al., 2003; Reference Kyllonen and ChristalKyllonen & Christal, 1990), and is believed to be involved in a wide range of complex cognitive operations, such as comprehension, reasoning and problem solving (Reference Conway, Kane, Bunting, Hambrick, Wilhelm and EngleConway et al., 2005; Reference EngleEngle, 2002).
CATB refers to comprehensive measures of intelligence where several instruments are used to assess different aspects of an individual’s cognitive ability. Common examples of such measures are the Wechsler Adult Intelligence Scale (WAIS; Reference WechslerWechsler, 2008), and the Stanford-Binet Intelligence Scale (SBIS; Reference RoidRoid, 2003), which both consist of no less than ten subtests (Reference DiStefano and DombrowskiDiStefano & Dombrowski, 2006; Reference RoidRoid, 2003; Reference WechslerWechsler, 2008). Although CATB´s provide a comprehensive measure of cognitive ability, it is often not feasible to use such measures in experimental research, as they are time consuming and difficult to administer. Instead, most researchers either adopt a small number of subtests from a well-established CATB, or construct a less time consuming CATB by combining a few commonly used cognitive ability measures such as those mentioned above (e.g., RPM, CRT, NUM WMC, etc.). Accordingly, CATB will in this study refer to any measure utilizing more than one instrument to assess cognitive ability.
2.5 Measures of Risk Aversion
Across all three domains risk aversion was measured with one of the following decisions tasks: Bomb Risk Elicitation Task (BRET), Decision Task Battery (DTB), Eckel-Grossman Risk Task (EGRT), Ellsberg Urn Risk Task (EURT), Gift Gambling Task (GGT), Income Gambling Task (IGT), Lottery Task (LT), Multiple Price List (MPL), One-shot Gambling Task (OGT), Sabater-Grande-Georgantzis Lottery Panel (SGG), Wheel of Fortune Task (WFT), Cups Task (CT), Portfolio Choice Task (PCT), Budget Line Allocation Task (BLAT), Cambridge Gambling Task (CGT), Gneezy-Potters Investment Task (GPIT) or Adaptive Lottery Task (ALT). Specifically, risk aversion was measured with 13 different decision tasks in the domain of gains (i.e. ALT, BRET, CT, DTB, EGRT, EURT, GGT, IGT, LT, MPL, OGT, SGG, WTF), 12 in the mixed domain (i.e., ALT, BLAT, CGT, DTB, EGRT, GPIT, IGT, LT, MPL, OGT, PCT, SGG), and 6 in the domain of losses (i.e., ALT, CT, EGRT, GGT, LT, MPL).
BRET is a dynamic real time elicitation task in which the participant is required to decide how many boxes to collect in a matrix containing 100 boxes, one of which hides a bomb (Reference Crosetto and FilippinCrosetto & Filippin, 2013). The payoff of each box collected is exactly the same. Hence, the potential earning increases linearly. In case the box with the bomb is collected, the payoff for the whole round is zero. As all outcomes, as well as the probabilities associated with each outcome, is fully specified, BRET allows for a good estimation of individual risk preferences in the domain of gains, simply by counting the number of boxes collected (Reference Crosetto and FilippinCrosetto & Filippin, 2013; Reference Holzmeister and PfurtschellerHolzmeister & Pfurtscheller, 2016).
EGRT is a simple risk elicitation method in which the participant is asked to choose between one of six gambles (Reference Dave, Eckel, Johnson and RojasDave, Eckel, Johnson & Rojas, 2010; Reference Eckel and GrossmanEckel & Grossman, 2008). Each gamble typically involves a 50% chance of winning a low payoff and a 50% chance of winning a high payoff. One of the gambles is a sure thing, in which the low and high payoff is exactly equal. The gambles are designed so that the expected payoff increases linearly with risk, as represented by the standard deviation (Reference Charness, Gneezy and ImasCharness, Gneezy & Imas, 2013). A risk averse individual should thus choose gambles with lower standard deviations whereas a risk neutral individual should choose the gamble with the highest expected return.
In EURT, participants are presented with an urn containing five blue and five yellow balls. For each round a random ball is drawn from the urn, and participants are asked to guess its color. If the participants guess correctly, they win a specified amount of money. Before the ball is drawn, however, each participant is asked to indicate the price they are willing to sell the bet for. A computer then generates a random offer to buy the bet. If this sum is higher than the minimum selling price set by the participant, the bet is sold and no ball is drawn from the urn. If the offer is lower than the minimum selling price, a ball is drawn and the bet is carried out. Risk aversion is inferred based on the minimum selling price set by the participant. A high selling price indicates risk tolerance while a low selling price suggests risk aversion (Reference Borghans, Heckman, Golsteyn and MeijersBorghans, Heckman, Golsteyn & Meijers, 2009).
The GGT is a simple decision task often used to elicit risk preferences among children (Reference Levin and HartLevin & Hart, 2003). The participant is presented with four identical boxes, two of which are placed to the left of the participant and two of which are placed to the right. Under each box on the left side, a small gift is hidden, whereas two small gifts are hidden under one of the boxes on the right. Risk aversion is measured by asking the participant to indicate from which side he or she would like to draw a box. As the expected value of the two sides are equal, participants are considered risk averse if they prefer to draw a box from the left side.
MPL refers to a class of decision tasks in which participants are asked to choose between two different lotteries (Reference Dohmen, Falk, Huffman and SundeDohmen et al., 2018). MPL generally comes in two formats: The first format involves two lotteries in which the potential outcome of each lottery are kept constant, while the probabilities of the outcomes vary from row to row (e.g., Reference Holt and LauryHolt & Laury, 2002); the second format involves a safe and a risky lottery, in which the probabilities of outcomes are kept constant, while the potential outcomes of either the safe or risky lottery are gradually increased (e.g. Andersson et al., 2016). Risk preferences are inferred either based on the number of risky choices made, or on the participant’s unique switching point (i.e., the point where the participant switched from the risky to the safe lottery).
OGT refers to a simple type of decision tasks in which the participant is presented with only one choice between a safe/risky option and a riskier option with equal or higher expected value. In this task, risk aversion is inferred based on whether the participant chose the riskiest option or not.
In IGT participants are asked to consider several hypothetical income gambles. More specifically, the participants are asked to choose between a certain income for some specified amount of time or a gamble in which this income is either increased or decreased by some amount with probability p and 1–p (e.g., Reference Barsky, Juster, Kimball and ShapiroBarsky, Juster, Kimball & Shapiro, 1997; Reference Beauchamp, Cesarini and JohannessonBeauchamp et al., 2017). Based on the number of rejected gambles, individual risk preferences can be determined.
LT refers to any decision task in which the participants are asked to choose between a number of gambles sequentially. Each set of gambles can be constructed in a number of different ways so that the probabilities and payoffs associated with each gamble changes or are kept constant. Moreover, each gamble may differ with regard to whether the participants has to choose between two different gambles, or a certain option and a gamble. As with most decision tasks, risk aversion is inferred based on the number of risky and safe option chosen by the participant.
SGG is a standard risk elicitation task in which participants are asked to choose one gamble from four different lottery panels (Reference Sabater-Grande and GeorgantzisSabater-Grande & Georgantzis, 2002). Each panel consists of ten gambles with decreasing probabilities and increasing expected value. Consequently, if the participant chooses the first gamble in each lottery panel, he or she can be considered highly risk averse. If the participant, on the other hand, chooses the last gamble in each lottery panel he or she can be considered risk tolerant.
WFT is a visual gambling task in which the participants are asked to make a series of choices between pairs of fortune wheels (Reference Blankenstein, Crone, van den Bos and van DuijvenvoordeBlankenstein, Crone, van den Bos & van Duijvenvoorde, 2016). The first fortune wheel is always presented as a certain option that pays some specified amount of money. The second fortune wheel, on other hand, is presented as a risky option in which the magnitude of the monetary outcome and the probability of obtaining this outcome varies. Accordingly, risk aversion is inferred based on the number of times each participant prefers the first over the second fortune wheel.
CT is another visual gambling task in which participants are asked to choose between 54 gambles presented as two arrays of cups containing monetary payoffs (Reference Levin, Weller, Pederson and HarshmanLevin, Weller, Pederson & Harshman, 2007). In each trial, participants are asked to decide from which of two arrays of two, three or five cups containing monetary payoffs they would like to draw a cup. One of the two arrays is a certain option in which all of the cups contain the same payoff whereas the second array is a risky option in which only one of the cups contains a monetary payoff. In some of the gambles, the risky option has the same expected value as the certain option while in others the expected value is either higher or lower for the risky option. Risk aversion is estimated based on the number of times the participant decides to draw a cup from the certain array.
PCT is a decision task in which the participants are asked to rank their most and least preferred investment options from a menu of three investment portfolios: safe, risky and intermediate (e.g., Reference Bateman, Stevens and LaiBateman, Stevens & Lai, 2015). The safe option guarantees an annual return of x% while the risky option provides a mean annual return of x% + y% with a standard deviation of z%. The intermediate option is dynamically rebalanced so that 50% is invested in the safe and the risky option. The mean annual return of the intermediate option is, thus, the average of the safe and risky option with a standard deviation of z%/2. A highly risk averse investor would, in this setup, always prefer the safe option to the intermediate and risky option, as well as the intermediate option to the risky option. Consequently, risk aversion is estimated based on how each participant ranks the attractiveness of the three portfolios described above.
In BLAT participants are asked to allocate points between accounts x and y, which are represented visually on a two-dimensional budget line (Reference Choi, Fisman, Gale and KarivChoi, Fisman, Gale & Kariv, 2007; Reference Choi, Kariv, Müller and SilvermanChoi, Kariv, Müller & Silverman, 2014). After allocating points, either x or y is randomly chosen, and the participant receives the points he or she allocated to the chosen account, while all points in the other account is lost. On each budget line, there are three points: A, B and C. Point A is where the budget line hits the y-axis and represents allocating all points to the y account. Conversely, B is where the budget line hits the x-axis and represents allocating all points to the x account. Finally, point C, which lies on the 45-degree line, ensures a certain payoff and corresponds to an equal allocation between x and y. Importantly, the slope of the budget line AB is always chosen so that the payoff of choosing an allocation between A and C has a higher expected return than point C, whereas choosing an allocation between B and C has a lower expected return than C. Hence, an individual who is infinitely risk averse will always choose an allocation equal to C, whereas an individual who is less risk averse or risk seeking will choose an allocation between A and C or B and C, respectively. This makes it possible to estimate individual risk preferences based on the amount of points allocated between A and C, and B and C on the budget line.
GPIT is a classic investment task in which the participant have to decide how much to invest ($x), out of an initial endowment ($y), in a risky asset (e.g., Reference Charness, Gneezy and ImasCharness, Gneezy & Imas, 2013; Reference Gneezy and PottersGneezy & Potters, 1997). The amount invested yields a dividend of $kx (k > 1) with probability p and is lost with probability 1–p. The money not invested ($y–x) is kept by the participant. The payoff of each choice is therefore $y–x+kx, with probability p, and $y–x with probability 1–p. In all cases k and p is chosen so that the expected value of investing is either higher or equal to the expected value of not investing. Risk aversion is estimated based on the amount invested, with lower amounts indicating higher levels of risk aversion.
In CGT a yellow token is hidden under one of ten blue or red boxes (e.g., Clark et al., 2008). The amount of red and blue boxes varies from trial to trial, so that the probability that the token is hidden under a blue or red box, changes. On each trial, participants have to decide how much to wager out of their current endowment, that the yellow token is hidden under either a red or a blue box. If the participant chooses the right color, the amount wagered is added to his or her current endowment. Conversely, if the participant chooses the wrong color the amount is lost. Just like in the GPIT, risk aversion is inferred based on the amount wagered on each trial.
ALT is similar to the standard LT, in which participants are asked to choose between a number of gambles sequentially. However, as opposed to the standard LT, the gambles in ALT is iteratively adapted based on the participant’s choices, allowing for a more efficient and precise estimation of individual risk preferences (e.g., Chapman, Snowberg, et al., 2018; Reference Frey, Pedroni, Mata, Rieskamp and HertwigFrey, Pedroni, Mata, Rieskamp & Hertwig, 2017).
Finally, DTB refers to measures of risk aversion relying on more than one single elicitation task. That is any measure in which two or more of the decision tasks described above were used to construct a composite score of risk aversion within the domain of gains, mixed or losses.
2.6 Step 3. Data Analysis
First, all effect sizes were converted into a common metric (i.e., correlation coefficients), as previously described. Correlations were defined as negative when people with higher cognitive ability were to be less risk averse. In line with the guidelines provided by Borenstein et al. (2009), all correlation coefficients were converted into Fisher’s z. Next, a random-effects model meta-analysis using the restricted maximum likelihood estimator (REML; Viechtbauer, 2005, 2010) was performed in order to investigate the relationship between cognitive ability and risk aversion for the domains of gains, mixed and losses. Moreover, two additional meta-analyses were conducted in each of these three domains, one using only males and one using only females. A random-effects model was chosen, as opposed to a fixed-effect model, because the assumptions behind the random-effects model tend to be more realistic (Reference Borenstein, Hedges, Higgins and RothsteinBorenstein et al., 2009; Reference CooperCooper, 2010). Results from the meta-analyses is presented as a correlation, ρ, equivalent to Pearson’s r. Correlations ranging from .10 to .29, .30 to .49 and .50 to 1.00 are interpreted as weak, moderate and strong, respectively (Reference CohenCohen, 1988).
In order to test for heterogeneity, Q and I2 statistics were calculated. The Q statistic was computed by summing the squared deviations of each study’s effect from the combined effect size, weighting each study by its inverse variance (Reference Huedo-Medina, Sánchez-Meca, Marín-Martínez and BotellaHuedo-Medina, Sánchez-Meca, Marín-Martínez & Botella, 2006). The Q statistic tests for heterogeneity by testing the null hypothesis that all studies share a common effect size (Reference Borenstein, Hedges, Higgins and RothsteinBorenstein et al., 2009). Under the null hypothesis, the Q statistic follows a chi-square distribution with k–1 degrees of freedom, k being the number of studies included in the meta-analysis (Reference Huedo-Medina, Sánchez-Meca, Marín-Martínez and BotellaHuedo-Medina et al., 2006). A significant Q indicates that true heterogeneity exists (Reference Borenstein, Hedges, Higgins and RothsteinBorenstein et al., 2009). The I2 statistic investigates the amount of true heterogeneity by dividing the result of the Q statistic and its degrees of freedom (k–1) by the Q value, and multiplying it by 100 (Reference Huedo-Medina, Sánchez-Meca, Marín-Martínez and BotellaHuedo-Medina et al., 2006). Consequently, the I2 statistic can be interpreted as the percentage of total variance in a set of observed effect sizes due to true heterogeneity. Reference Higgins, Thompson, Deeks and AltmanHiggins, Thompson, Deeks and Altman (2003) suggest that I2 approximating 25%, 50%, and 75% can be considered as low, moderate, and high, respectively.
To investigate the impact of moderator variables, several meta-regressions were performed. Meta-regressions are analogous to standard regression analysis, and can, with appropriate coding, be used to examine the influence of both categorical and continuous moderator variables (Reference Hedges and PigottHedges & Pigott, 2004; Reference Viechtbauer and CheungViechtbauer, 2010). All moderator analyses were performed independently, as testing multiple moderators simultaneously may lead to a mis-estimation of moderator effects, especially when the number of studies included is small (Reference Steel and Kammeyer-MuellerSteel & Kammeyer-Mueller, 2002).
Publication bias, the tendency to leave out non-significant results and publish only positive results, was examined in two steps. First, it was visually assessed using a funnel plot of all studies included in the random-effects model meta-analysis. If no publication bias exists, the two sides of the funnel plot should be symmetrical (Reference Borenstein, Hedges, Higgins and RothsteinBorenstein et al., 2009; Reference Rothstein, Sutton and BorensteinRothstein, Sutton & Borenstein, 2006). That is, if no publication bias exists, the observed effect sizes should not be asymmetrically distributed around the combined effect size. Second, a rank correlation test (Reference Begg and MazumdarBegg & Mazumdar, 1994) and a regression test (Reference Egger, Smith, Schneider and MinderEgger, Smith, Schneider & Minder, 1997) was performed to test for funnel plot asymmetry.
Finally, case deletion diagnostics were performed in order to identify any influential studies and/or possible outliers (Reference Viechtbauer and CheungViechtbauer, 2010; Reference Viechtbauer and CheungViechtbauer & Cheung, 2010). According to Viechtbauer (2010), studies might be considered either as influential or as outliers if one or more of the following statements are true: (a) the absolute DFFITS value is larger than 3√p/(k–p) where p is the number of model coefficients and k the number of studies; (b) the lower tail area of a chi-square distribution with p degrees of freedom cutoff by the Cook’s distance is larger than .50; (c) the hat value is larger than 3(p/k) or (d) the DFBETAS value is larger than 1. The DFFITS value is an estimate of how many standard deviations the predicted effect for the i th study changes after excluding the i th study from the model fitting. Cook´s distance is essentially the Mahalanobis distance between the full set of predicted values with or without the i th study included in the model fitting. The hat value is simply the i th diagonal element of the hat matrix, also known as the so-called leverage of the i th study. Finally, the DFBETAS value indicates how many standard deviations the estimated correlations coefficient changes after removing the i th study from the model fitting.
All statistical analyses were performed in R (R Core Team, 2017) with the following packages installed: metafor (Reference Viechtbauer and CheungViechtbauer, 2010) and dplyr (Reference Wickham, François, Henry and MüllerWickham, François, Henry & Müller, 2018).
3 Results
3.1 Descriptive Results for the Domain of Gains
As previously described, a total of 97 studies published between 2003 and 2018 were included for meta-analysis in the domain of gains (N = 90,723). The mean age of participants was available for 66 studies and ranged from 6.0 to 81.2 years with a mean of 29.5. Participants were either university, college or high school students in 56 of the 97 studies included. Out of the remaining 41 studies, 35 were based on various community samples, while 5 relied on samples of children. For the last study the specifics of the sample used was not available. In 35 studies there were more males than females, while the opposite was true in 42 studies. The male to female ratio was exactly 1.00 in one study while the proportion of males and females was unavailable for 19 studies. Risk aversion was measured using MPL in 45 studies, LT in 26, OGT in 7, DTB in 5, EGRT in 4 and BRET in 3. In the remaining 7 studies risk aversion was assessed with one of the following decision tasks: ALT, CT, EURT, GGT, IGT, SGG, and WFT. The decision task was fully incentivized in 23 studies, randomly incentivized in 47, and purely hypothetical in 14. Moreover, participants were paid for participation in 81 out of 97 studies. Information about whether the participants were paid and the extent to which the decision task was incentivized were unavailable in 16 and 13 studies, respectively. The average payment for the whole experiment ranged from $5 to $125 with a mean of $30. The average payment was, however, only available for 34 studies. Cognitive ability was measured using CATB in 36 studies, CRT in 30, RPM in 18, NUM in 12 and WMC in 1. Finally, in 24 of the 97 studies included, one of the primary purposes of the study was to investigate the relationship between cognitive ability and risk aversion. For an overview of the studies included for meta-analysis in the domain of gains see Table 1.
3.2 Random-Effects Model Meta-Analysis for the Domain of Gains
Results from the random-effects model meta-analysis suggest that there exist a weak but significant negative relationship between cognitive ability and risk aversion in the domain of gains (k = 97, ρ = −.07, Z = −6.11, p < .001, 95% CI [−.10, −.05]). Looking at the results for males (k = 51, ρ = −.09, Z = − 4.81, p < .001, 95% CI [−.12, −.05]) and females only (k = 48, ρ = −.05, Z = −4.39, p < .001, 95% CI [−.08, −.03]) a similar pattern emerges. The forest plots depicted in Figure 2 provides an overview of the studies included, their individual correlation coefficients with 95% confidence intervals, and the overall results from the random-effects model meta-analyses.
Forest plots for the domain of gains — full sample, males and females only.

3.3 Test for Heterogeneity in the Domain of Gains
The results from the Q statistics were highly significant for the full sample (Q = 612.83, df = 96, p <.001) as well as for males only (Q = 210.79, df = 50, p < .001), indicating the presence of true heterogeneity. The Q statistic for females only, however, was not significant (Q = 60.38, df = 47, p >.05), suggesting that only a small amount of true heterogeneity exist between the studies included when looking exclusively at the results for females. These results were further confirmed by the I2 statistics which indicated that the amount of total variance observed due to true heterogeneity was high for the full sample (I2 = 88.69%, 95% CI [83.49, 92.09]) and males only (I2 = 78.48%, 95% CI [60.85, 89.44]), but low for females (I2 = 33.56%, 95% CI [.00, 72.33]).
3.4 Moderator Analysis for the Domain of Gains
The results from the meta-regressions showed that none of the moderator variables had any influence on the relationship between cognitive ability and risk aversion in the domain of gains for the full sample and males only (see Table 2–3). Looking at the results for females only, the meta-regressions suggest that both the decision task used, and the payoff structure of the riskier choice explained a substantial amount of the observed heterogeneity (Table 4). Specifically, the relationship between cognitive ability and risk aversion is stronger when the payoff of the riskier choice is kept constant compared to when it changes. Even though the overall result of the meta-regressions suggests that the decision task used to measure risk aversion explains a substantial amount of the observed heterogeneity for females only, no single tasks appeared to significantly influence the relationship between cognitive ability and risk aversion.
3.5 Descriptive Results for the Mixed Domain
A total of 41 studies published from 1993 to 2018 were included for meta-analysis in the mixed domain (N = 50,936). The mean age of participants was available for 27 studies and ranged from 8.9 to 75.4 years with a mean of 31.9. Participants were either university, college or high school students in 17 of 41 studies included. Out of the remaining 24 studies 18 were based on various community samples, while 6 relied on samples of children. In 12 studies there were more males than females, while the opposite was true in 18 studies. The male to female ratio was exactly 1.00 in one study while the proportion of males and females was not available for 10 studies. Risk aversion was measured using GPIT in 11 studies, LT in 9, and MPL in 8. ALT, BLAT, OGT and IGT were all used to measure risk aversion in 2 studies, while EGRT, CGT, DTB, PCT and SGG were used in the remaining 5 studies. The decision task was fully incentivized in 11 studies, randomly incentivized in 14, and purely hypothetical in 11. Moreover, participants were paid for participating in the experiment in 31 out 41 studies. Information about whether participants were paid for their participation and the extent to which the decision task was incentivized was unavailable in 10 and 5 studies, respectively. The average payment for the whole experiment ranged from $2 to $58 with a mean of $21. However, information about the average payment was only available for 10 studies. Cognitive ability was measured using CATB in 19 studies, CRT in 9, RPM in 8, and NUM in 5. Finally, in 5 of the 41 studies included, one of the primary purposes of the study was to investigate the relationship between cognitive ability and risk aversion. For an overview of studies included for meta-analysis in the mixed domain see Table 5.
3.6 Random-Effects Model Meta-Analysis for the Mixed Domain
Results from the random-effects model meta-analysis indicate no relationship between cognitive ability and risk aversion in the mixed domain (k = 41, ρ = .01, Z = 0.82, p > .05, 95% CI [−.02, .04]). The same goes for the result for males only (k = 24, ρ = −.01, Z = −0.32, p > .05, 95% CI [−.05, .04]). However, the result for females only suggest a weak but significant positive relationship between cognitive ability and risk aversion in the mixed domain (k = 24, ρ = .03, Z = 2.15, p < .05, 95% CI [.00, .06]). The forest plots depicted in Figure 3 provide an overview of the included studies, their individual correlation coefficients with 95% confidence intervals, and the overall results from the random-effects model meta-analyses described above.
Forest plot for the mixed domain — full sample, males and females only.

3.7 Test for Heterogeneity in the Mixed Domain
Results from the Q statistics were highly significant for the full sample (Q = 247.07, df = 40, p < .001), males (Q = 86.42, df = 23, p < .001), and females only (Q = 45.57, df = 23, p < .01), indicating a substantial amount of true heterogeneity among the 41 studies included in the mixed domain. These results were further confirmed by the I2 statistics which indicated that the amount of total variance observed due to true heterogeneity was high for the full sample (I2 = 88.49%, 95% CI [79.25, 92.88]) and males (I2 = 80.74%, 95% CI [58.75, 92.55]), while moderate for females (I2 = 54.65%, 95% CI [7.97, 82.23).
3.8 Moderator Analysis for the Mixed Domain
The overall results from the meta-regression showed that only the cognitive ability measure and the decision task used had an influence on the relationship between cognitive ability and risk aversion in the mixed domain (Table 6). More specifically, the relationship between cognitive ability and risk aversion is positive when cognitive ability was measured with CATB, while increasingly negative when assessed by RPM, CRT and NUM. Similarly, the meta-regressions suggest that the relationship between cognitive ability and risk aversion is positive when risk aversion was measured using ALT, while less positive and even negative when one of the following decision tasks were utilized: CGT, MPL, IGT, OGT, LT, GPIT, BLAT, PCT or EGRT.
For males only, the decision task used, probabilities and whether or not there was a certain option were found to be significant predictors (Table 7). Specifically, the relationship between cognitive ability and risk aversion is positive when the probabilities of the decision task was changing as well as when there was no certain option, while negative when the opposite was true. Moreover, the relationship was found to be increasingly positive when risk aversion was measured using CGT and DTB.
For females only, cognitive ability measure, the decision task used, probabilities, and whether or not there was a certain option were significant predictors for the relationship of interest (Table 8.). More specifically, the relationship between cognitive ability and risk aversion is positive when cognitive ability was measured using CATB while increasingly negative when assessed by RPM and CRT. Similarly, the relationship is positive when risk aversion was measured using ALT, while moving toward negative when using GPIT and BLAT. Finally, the relationship between cognitive ability and risk aversion is stronger when there was no certain option and the probabilities were changing.
3.9 Descriptive Results for the Domain of Losses
A total of 12 studies published from 2003 to 2018 were included for meta-analysis in the domain of losses (N = 4,544). The mean age of participants was available for 11 studies and ranged from 6.0 to 68.7 years with a mean of 32.1. Participants were either university, college or high school students in 4 of 12 studies. Out of the remaining 8 studies, 7 were based on various community samples, while one relied on samples of children. In 6 studies there were more males than females, while the opposite was true in 5 studies. For one study, the proportion of males and females was not available. Risk aversion was measured using LT in 6 studies and MPL in 2. In the remaining 4 studies risk aversion was assessed with one of the following decision tasks: ALT, CT, EGRT and GGT. The decision task was fully incentivized in 2 studies and randomly incentivized in 7. Moreover, participants were paid for participation in 10 out of 12 studies. Information about whether the participants were paid for their participation and the extent to which the decision task was incentivized were unavailable in 2 and 3 studies, respectively. The average payment for the whole experiment ranged from $9 to $25 with a mean of $15. The average payment was however only available for 3 studies. Cognitive ability was measured using CATB in 9 studies, CRT in 2 and RPM in 1. Finally, in 4 of the 12 studies included, one of the primary purposes of the study was to investigate the relationship between cognitive ability and risk aversion. For an overview of the studies included for meta-analysis in the domain of losses see Table 9.
3.10 Random-Effects Model Meta-Analysis for the Domain of Losses
Results from the random-effects model meta-analysis indicate no link between cognitive ability and risk aversion in the domain of losses (k = 12, ρ = −.05, Z = −1.10, p > .05, 95% CI [−.13, .04]). The story is the same for males only (k = 8, ρ = −.05, Z = −0.68, p > .05, 95% CI [−.18, .09]) and females only (k = 8, ρ = −.01, Z = −0.19, p > .05, 95% CI [−.11, .09]). The forest plots in Figure 4 provides an overview of the studies included, their individual correlation coefficients with 95% confidence intervals, and the overall results from the random-effects model meta-analyses described above.
Forest plots in the domain of losses — full sample, males and females only

3.11 Test for Heterogeneity in the Domain of Losses
The result from the Q statistics were significant for the full sample (Q = 50.63, df = 11, p < .001), males (Q = 29.18, df = 7, p < .001), and females only (Q = 19.10, df = 7, p < .01), indicating the existence of true heterogeneity. These results were further corroborated by the I2 statistics which indicated that the amount of total variance observed due to true heterogeneity was high for the full sample (I2 = 82.13%, 95% CI [56.30, 94.07]) and males (I2 = 81.15%, 95% CI [51.46, 96.43]) as well as moderate for females (I2 =63.26%, 95% CI [8.58, 90.88]).
3.12 Moderator Analysis for the Domain of Losses
The meta-regressions indicate that cognitive ability measure, probabilities, and the payoff structure of the riskier choice had a significant influence on the relationship between cognitive ability and risk aversion in the domain of losses (Table 10). More specifically, the relationship is positive when cognitive ability was measured using CRT, while increasingly negative when measured using either CATB or RPM. Furthermore, the relationship between cognitive ability and risk aversion is positive when the probability was kept constant at 50% and the payoff of the riskier option did not change, while negative when this was not the case.
For males only, both the payoff structure of the safer choice and the decision task used to measure risk aversion were significant predictors of the relationship of interest (Table 11). The relationship between cognitive ability and risk aversion is positive when risk aversion was measured using MPL, while increasingly negative when assessed with either EGRT or CT. Moreover, the relationship moved in the negative direction when the payoff of the safer choice was kept constant.
For females only, the percentage of risk averse choices, cognitive ability measure, probabilities, sample type, and the payoff structure of the riskier choice influenced the relationship between cognitive ability and risk aversion for males only (Table 12). The result for percentage of risk averse choices suggest that the relationship of interest moves in a negative direction as the percentage of risk averse choices increases. Moreover, the relationship between cognitive ability and risk aversion is negative when cognitive ability was measured with CATB, while going in the opposite direction when assessed by CRT. Conversely, the relationship is positive when the probability was kept constant at 50%, the sample consisted of students, and the payoff of the riskier choices was kept constant, while negative when this was not the case.
3.13 Comparing Males and Females Across the Domain of Gains, Mixed and Losses
In order to compare the results for males and females across the domain of gains, mixed and losses, three separate meta-regressions were performed. The results indicate no significant differences between males and females in the domain of gains (QM (df = 1) = 2.43, p > .05), mixed (QM (df = 1) = 2.02, p >.05) or losses (QM (df = 1) = 0.19, p >.05). These results corroborate findings from Table 2, 6 and 10 that the male to female ratio has no influence on the relationship between cognitive ability and risk aversion in either of the three domains.
3.14 Publication Bias
Nine funnel plots were created by plotting each effect size against the standard error of the observed effect sizes for the full sample, males and females only across all three domains (Figure 5–7). Visual examination of each funnel plot suggests that the observed effect sizes are not asymmetrically distributed around the combined effect size, implying that no publication bias exist. Furthermore, neither the rank correlation test nor the regression test for funnel plot asymmetry provides any substantial evidence of publication bias for the full sample (Gains: τ = −.01, p > .05, Z = 0.91, p > .05; Mixed: τ = .08, p > .05, Z = −0.97, p > .05; Losses: τ = −.12, p > .05; Z = −2.10, p < .05), males (Gains: τ = −.06, p > .05; Z = 0.64, p > .05; Mixed: τ = .08, p > .05; Z = −1.35, p > .05; Losses: τ =-.36, p > .05; Z = −1.56, p > .05), and females only (Gains: τ = .07, p > .05, Z = −0.11, p > .05; Mixed: τ = .14, p > .05; Z = −0.56, p > .05; Losses:τ =-.14, p > .05; Z = −1.29, p > .05) across the domain of gains, mixed and losses.
3.15 Case Deletion Diagnostics
As shown in Figures 8–10, two studies were found to be influential when looking at the results for the full sample across the three decision domains. Similarly, when looking at the results for males only, two studies were identified as influential across the domain of gains, mixed and losses, while four studies could be regarded as influential for females only. The results did however not change substantially after removing all studies identified as influential from the full sample (Gains: k = 96, ρ = −.07, Z = −6.31, p < .001, 95% CI [−.09, −.05]; Mixed: k = 40, ρ = .02, Z = 1.35, p > .05, 95% CI [−.01, .05]), males (Gains: k = 50, ρ = −.08, Z = −4.94, p < .001, 95% CI [−.11, −.05]; Losses: k = 7, ρ = .00, Z = −0.00, p > .05, 95% CI [−.11, .11]) and females only (Gains: k = 45, ρ = −.06, Z = −4.39, p < .001, 95% CI [−.09, −.03]; Mixed: k = 23, ρ = .02, Z = 2.28, p < .05, 95% CI [.00, .04]).
4 Discussion
In this study a systematic review and meta-analysis was conducted in order to empirically investigate the nature of the relationship between cognitive ability and risk aversion. A total of 97 studies (N=90, 723) was included for meta-analysis in the domain of gains, 41 (N=50, 936) in the mixed domain and 12 (N=4, 544) in the domain of losses. The overall results from the random-effects model meta-analyses suggest that a weak, but significant relation between cognitive ability and risk aversion exist in the domain of gains. Thus, the current meta-analysis provides evidence that highly intelligent individuals tend to be less risk averse in the domain of gains. However, the strength of the relationship between cognitive ability and risk aversion was estimated to be rather weak (ρ = −.07), and not as strong as suggested by some previous studies. No evidence was found for a relationship between cognitive ability and risk aversion in the mixed domain or the domain of losses. Taken together, these results suggest that the relationship between cognitive ability and risk aversion is domain specific and present only for the domain of gains. Given the weak nature of this relationship, we should be cautious in drawing conclusions about its practical significance.
Interestingly, the relationship between cognitive ability and risk aversion appear to be quite stable across genders. That is, even though the relationship between cognitive ability and risk aversion appears to differ somewhat between males and females for the domains of gains (ρ male = −.09; ρ female = −.05), mixed (ρ male = −.01; ρ female = .03) and losses (ρ male = −.05; ρ female = −.01), these differences were not found to be significant. This is important, as it suggests that the observation that females tend to be more risk averse than males (e.g., Reference Charness and GneezyCharness & Gneezy, 2012; Reference Croson and GneezyCroson & Gneezy, 2009), is probably not driven by gender differences in cognitive ability. Contrary, to the results from the full sample and males only, a significant positive relationship between cognitive ability and risk aversion was observed in the mixed domain for females only. This suggest that highly intelligent females tend to be more risk averse in the mixed domain, compared to females with lower cognitive ability. However, as with the negative correlation observed in the domain of gains, the relationship is very weak (ρ = .03), and, thus, potentially not of practical significance. Notably, the amount of true heterogeneity observed, were consistently higher for males as compared to females across all three domains (Gains [![]() = 78.48%,
= 78.48%, ![]() =33.56%]; Mixed [
=33.56%]; Mixed [![]() = 80.74%,
= 80.74%, ![]() = 54.65%], Losses [
= 54.65%], Losses [![]() =81.15%,
=81.15%, ![]() = 63.26%]. This is an interesting result, as it suggests that the relationship between cognitive ability and risk aversion is considerably more stable and varies less across studies for females. A possible explanation is that males show more variability in cognitive ability than females (e.g., Reference Arden and PlominArden & Plomin, 2006; Reference DearyDeary, 2003; Reference FeingoldFeingold, 1992; Reference LakinLakin, 2013; Reference Lohman and LakinLohman & Lakin, 2009; Reference Strand, Deary and SmithStrand, Deary & Smith, 2006). This is in line with the greater male variability hypothesis, which states that males generally tend to differ more than females on a number of individual characteristics such as personality (Reference Borkenau, McCrae and TerraccianoBorkenau, McCrae, & Terracciano, 2013), creativity (Reference He and WongHe & Wong, 2011), and cognitive ability (Reference Arden and PlominArden & Plomin, 2006; Reference DearyDeary, 2003; Reference FeingoldFeingold, 1992; Reference LakinLakin, 2013; Reference Lohman and LakinLohman & Lakin, 2009; Reference Strand, Deary and SmithStrand et al., 2006). Consequently, the relationship between cognitive ability and risk aversion might be less stable across studies for males, because the sample of male participants in each study is more likely to vary in terms of cognitive ability. This is, likely due to the fact that the variation between samples depends partially on the amount of variability in the population from which they are drawn (Reference Swinscow and CampbellSwinscow & Campbell, 2002).
= 63.26%]. This is an interesting result, as it suggests that the relationship between cognitive ability and risk aversion is considerably more stable and varies less across studies for females. A possible explanation is that males show more variability in cognitive ability than females (e.g., Reference Arden and PlominArden & Plomin, 2006; Reference DearyDeary, 2003; Reference FeingoldFeingold, 1992; Reference LakinLakin, 2013; Reference Lohman and LakinLohman & Lakin, 2009; Reference Strand, Deary and SmithStrand, Deary & Smith, 2006). This is in line with the greater male variability hypothesis, which states that males generally tend to differ more than females on a number of individual characteristics such as personality (Reference Borkenau, McCrae and TerraccianoBorkenau, McCrae, & Terracciano, 2013), creativity (Reference He and WongHe & Wong, 2011), and cognitive ability (Reference Arden and PlominArden & Plomin, 2006; Reference DearyDeary, 2003; Reference FeingoldFeingold, 1992; Reference LakinLakin, 2013; Reference Lohman and LakinLohman & Lakin, 2009; Reference Strand, Deary and SmithStrand et al., 2006). Consequently, the relationship between cognitive ability and risk aversion might be less stable across studies for males, because the sample of male participants in each study is more likely to vary in terms of cognitive ability. This is, likely due to the fact that the variation between samples depends partially on the amount of variability in the population from which they are drawn (Reference Swinscow and CampbellSwinscow & Campbell, 2002).
The fact that the relationship between cognitive ability and risk aversion is non-existent or rather weak across all three domains suggest that risk preferences may reflect an independent construct which does not substantially overlap with intelligence. This interpretation is line with the conclusion drawn by Frey and colleagues (2017), who used several risk elicitation measures to extract a latent risk preference factor (R) which was not found to be associated with cognitive ability. This is very intriguing as cognitive ability has been found to be strongly related to how proficient people are at understanding and evaluating risk (Reference Cokely, Galesic, Schulz, Ghazal and Garcia-RetameroCokely et al., 2012). Consequently, in some cases there appear to be a gap between people’s ability to understand and evaluate risk, and their willingness to take risk. This gap could potentially have important real-world implications as it might lead some people who have a limited understanding of risk to take on too much of it, while others who do have the capabilities to properly evaluate risk might take on too little.
Compared to other meta-analyses linking cognitive ability to individual preferences, the effect sizes reported here are small. For instance, Reference Shamosh and GrayShamosh and Gray (2008) found the mean correlation between cognitive ability and delayed discounting across 24 studies to be −.23, suggesting that highly intelligent individuals are more patient and have higher levels of self-control. Similarly, in a more recent meta-analysis Reference Sharma, Bottom and ElfenbeinSharma, Bottom and Elfenbein (2013), found a positive mean correlation of .24 between cognitive ability and cooperative tendencies across five studies with a total of 1, 123 participants. Hence, even though cognitive ability was not found to be strongly related to risk aversion in the present meta-analysis, it should still be regarded as an important variable that needs to be taken into consideration when investigating the antecedents of human decision making.
Overall, none of the moderator variables consistently influenced the relationship between cognitive ability and risk aversion across the domain of gains, mixed and losses. Although no clear pattern from the meta-regressions emerged, the following five moderators were found to be influential in more than one instance: the decision task used to measure risk aversion, the psychometric instrument used to assess cognitive ability, whether the payoff of the riskier choice and probabilities varied or were kept constant, and if there was a certain option or not. Specifically, the decision task used to measure risk aversion consistently moderate the relationship in the mixed domain, while also moderating the relationship in the domain of gains for females and the domain of losses for males. This result suggest that the relationship between cognitive ability and risk aversion is especially sensitive to how risk aversion is assessed in the mixed domain, while only somewhat sensitive to this in the domain of gains and losses.
Similarly, the psychometric measure used to assess cognitive ability was found to influence the relationship between cognitive ability and risk aversion for the full sample and females only in the mixed domain, and the domain of losses. As with the results for the decision task used to measure risk aversion, these results indicate that it somehow matters more how cognitive ability is assessed in the mixed domain and the domain of losses as compared to the domain of gains.
Whether the probabilities were varied or kept constant was not found to moderate the relationship between cognitive ability and risk aversion in the domain of gains, but to be somewhat influential in the mixed domain and the domain of losses. More precisely, it was found to influence the relationship between cognitive ability and risk aversion in the mixed domain for males and females only, as well as in the domain of losses for the full sample and females only. Likewise, whether or not there was a certain option was found to moderate the relationship in the mixed domain for males and females only. In both cases, the relationship between cognitive ability and risk aversion is positive when there was no certain option and less positive when the opposite was true. Finally, whether the payoff of the riskier option was kept constant or varied was found to moderate the relationship in the domain of gains for females, as well as in the domain of losses for the full sample and females only.
Collectively, these results indicate that the relationship between cognitive ability and risk aversion is more sensitive to the setup of the decision task, as well as how cognitive ability is measured in the mixed domain and the domain of losses.
In contrast to the results from Taylor (2013, 2016) and Reference Sousa and RangelSousa and Rangel (2014), no evidence of a hypothetical bias was observed. Hence, neither the existence nor the strength of the relationship between cognitive ability and risk aversion were found to be contingent on whether the decision task was incentivized or not. Furthermore, contrary to the results presented by Andersson et al. (2016), the number of possible risk averse choices was not found to moderate the relationship, except in the domain of losses for females only. These results suggest that the negative relationship observed between cognitive ability and risk aversion in the domain of gains is most likely not just an artefact of people with low cognitive ability making more random choice errors.
Across all three domains there was no substantial evidence of publication bias when looking at the funnel plots as well as the results from the rank correlation tests (Reference Begg and MazumdarBegg & Mazumdar, 1994) and the regression tests (Reference Egger, Smith, Schneider and MinderEgger et al., 1997). Furthermore, the moderator analyses indicate that results were not influenced by whether or not one of the primary purposes of the study was to investigate the relationship between cognitive ability and risk aversion. All in all, these results strengthen the conclusions drawn from current meta-analysis, as they suggest that the estimated effect sizes are not considerably skewed in any direction due to publication bias.
4.1 Limitations
This study is the first to systematically review and synthesize data on the relationship between cognitive ability and risk aversion. Furthermore, it is the first study that systematically explores the circumstances under which the relationship between cognitive ability and risk aversion exist, as well as whether specific factors moderate it. Despite these strengths, some limitations should be acknowledged.
First, several scholars have pointed out that many of the decision tasks most commonly used to elicit risk preferences are subject to a considerable amount of measurement error (Reference Crosetto and FilippinCrosetto & Filippin, 2016; Reference Frey, Pedroni, Mata, Rieskamp and HertwigFrey et al., 2017; Reference Pedroni, Frey, Bruhin, Dutilh, Hertwig and RieskampPedroni et al., 2017). Given that the measurement error associated with any two measures naturally impose an upper limit for the correlation that can be expected between them (Reference MuchinskyMuchinsky, 1996; Reference SpearmanSpearman, 1904b), it is likely that the current meta-analysis underestimates the true strength of the relationship between cognitive ability and risk aversion. In light of this fact, it would have been more appropriate to conduct the meta-analysis using disattenuated correlations (Reference OsborneOsborne, 2008). Unfortunately, this was not possible, because the data needed to correct for attenuation (i.e., reliability estimates for both the decision task and cognitive ability measure) was rarely available or impossible to obtain. On the other hand, it is important to note that correcting for attenuation when the reliability estimate drops below .70 can lead to overestimation of the strength of the relationship of interest (Reference OsborneOsborne, 2008). Accordingly, given that the measurement error, associated with many of the decision tasks commonly used to elicit risk preferences, is far from zero, correcting for attenuation would have been problematic in the context of the current meta-analysis.
Second, the systematic literature search as well as all the coding and data-extraction procedures was only performed by one individual. This is a limitation as it naturally increases the risk of human errors (Reference Mathes, Klaßen and PieperMathes, Klaßen & Pieper, 2017).
Third, recent evidence suggest that the imputation of beta values, proposed by Reference Peterson and BrownPeterson and Brown (2005), could be somewhat problematic, as it has been found to produced overly small estimates of meta-analytic mean correlations (Reference Roth, Le, Oh, Van Iddekinge and BobkoRoth, Le, Oh, Van Iddekinge & Bobko, 2018). Although this clearly presents a limitation, the meta-regressions suggests that the results were not significantly influenced by whether or not Pearson’s r was imputed using the Reference Peterson and BrownPeterson and Brown (2005) formula. Hence, even though the imputation proposed by Reference Peterson and BrownPeterson and Brown (2005) generally tend to produce overly small estimates of meta-analytic mean correlations (Reference Roth, Le, Oh, Van Iddekinge and BobkoRoth et al., 2018), this does not appear to be a severe problem in the current meta-analysis.
Finally, only a few studies were identified and included for meta-analysis in the domain of losses, making the meta-analytic results for this domain less convincing compared to the results for the mixed domain and the domain of gains (Reference Borenstein, Hedges, Higgins and RothsteinBorenstein et al., 2009). Moreover, given that the number of studies included in domain of losses was so small (k = 12) the conclusions drawn from the meta-regressions should be taken with extreme caution (Reference Steel and Kammeyer-MuellerSteel & Kammeyer-Mueller, 2002; Reference Thompson and HigginsThompson & Higgins, 2002).
4.2 Future Directions
Although the current meta-analysis sheds light on a number of important aspects concerning the relationship between cognitive ability and risk aversion, there is still much work to be done. Future studies should seek to gain a more comprehensive understanding of the circumstances under which a negative relationship between cognitive ability and risk aversion in the domain of gains exists. Looking at the results from the meta-regressions, it is clear that the moderator variables investigated do not sufficiently explain the high amount of heterogeneity observed in the domain of gains. Furthermore, additional studies are needed before any definite conclusions about the relationship between cognitive ability and risk aversion in the domain of losses can or should be drawn.
Another potentially fruitful line of research is to consider the possibility that the relationship between cognitive ability and risk aversion is nonlinear. In a recent study, Reference Mandal and RoeMandal and Roe (2014) used NLSY79 and HRS to investigate this possibility and found a quadratic pattern where respondents with the highest and lowest cognitive ability were most risk tolerant. This is intriguing, as it suggests that the inconsistent findings on the relationship between cognitive ability and risk aversion could be explained by the relationship being nonlinear. Following Reference Mandal and RoeMandal and Roe (2014) future studies should, therefore, set out to ask whether the relationship is indeed better described as quadratic and nonlinear.
Finally, as many of the decision tasks most commonly used to elicit risk preferences are subjected to a considerable amount of measurement error (Reference Crosetto and FilippinCrosetto & Filippin, 2016; Reference Frey, Pedroni, Mata, Rieskamp and HertwigFrey et al., 2017; Reference Pedroni, Frey, Bruhin, Dutilh, Hertwig and RieskampPedroni et al., 2017), future studies should strive to develop new and better ways of measuring individual risk preferences. In this regard, a promising line of research is the recent development of adaptive elicitations tasks which have been found to reduce measurement error and outperform standard elicitation procedures on a number of important parameters (Reference Chapman, Snowberg, Wang and CamererChapman, Snowberg, et al., 2018; Reference Toubia, Johnson, Evgeniou and DelquiéToubia, Johnson, Evgeniou & Delquié, 2013). Another viable solution would be to use different risk elicitation tasks to extract a common risk factor (R), thereby increasing accuracy and reducing measurement error (Reference Frey, Pedroni, Mata, Rieskamp and HertwigFrey et al., 2017). Extending this possibility, risk could be measured in a variety of domains, both to study effects in each domain and to extract a cross-domain general factor (e.g., Reference Harris, Jenkins and GlaserHarris, Jenkins & Glaser, 2006).
4.3 Conclusion
In conclusion, the current meta-analysis provides strong evidence for a significant but weak negative relationship between cognitive ability and risk aversion in the domain of gains. However, no significant relationship was found in the mixed domain or the domain of losses, suggesting that the relationship is domain specific. Importantly, no significant difference was observed between males and females across the domain of gains, mixed and losses. Moreover, none of the moderator variables investigated in this study consistently influenced the relationship between cognitive ability and risk aversion across all three domains. Future research should aim to gain a deeper understanding of the relationship between cognitive ability and risk aversion using more reliable measures to elicit risk preferences.
Appendix
Funnel plots for the domain of gains — full sample, males and females only.

Funnel plots for the mixed domain — full sample, males and females only.

Funnel plots for the domain of losses — full sample, males and females only.

Case deletion diagnostics for the domain of gains. (All studies identified as influential are marked with gray)

Case deletion diagnostics for the mixed domain. (All studies identified as influential are marked with gray)

Case deletion diagnostics for the domain of losses. (All studies identified as influential are marked with gray)
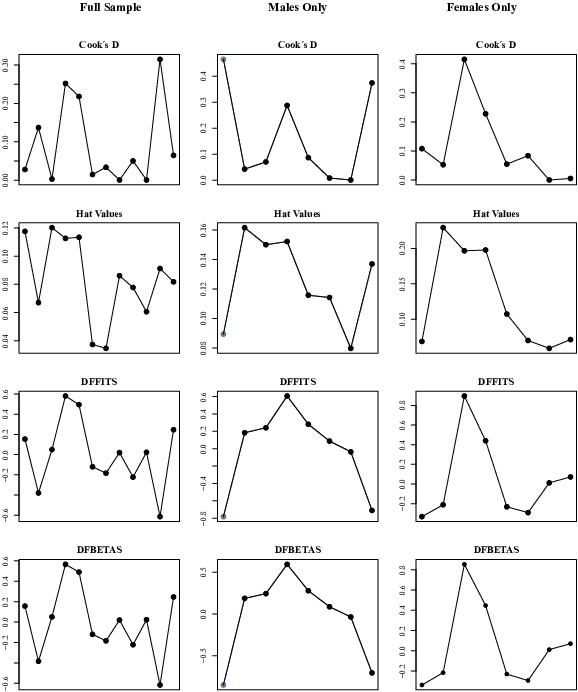

Note. Not available (NA), cognitive ability measure (CAM), student sample (S), community sample (CS), children sample (CHS), cognitive ability test battery (CATB), ravens progressive matrices (RPM), cognitive reflection task (CRT), numeracy test (NUM), working memory capacity test (WMC), adaptive lottery task (ALT), bomb elicitation risk task (BRET), cups task (CT), decision task battery (DTB), Eckel-Grossman risk task (EGRT), Ellsberg urn risk task (EURT), gift gamble task (GGT), income gamble task (IGT), lottery task (LT), multiple price list (MPL), one-shot gambling task (OGT), Sabater-Grande-Georgantzis lottery panel (SGG), wheel of fortune task (WTF).
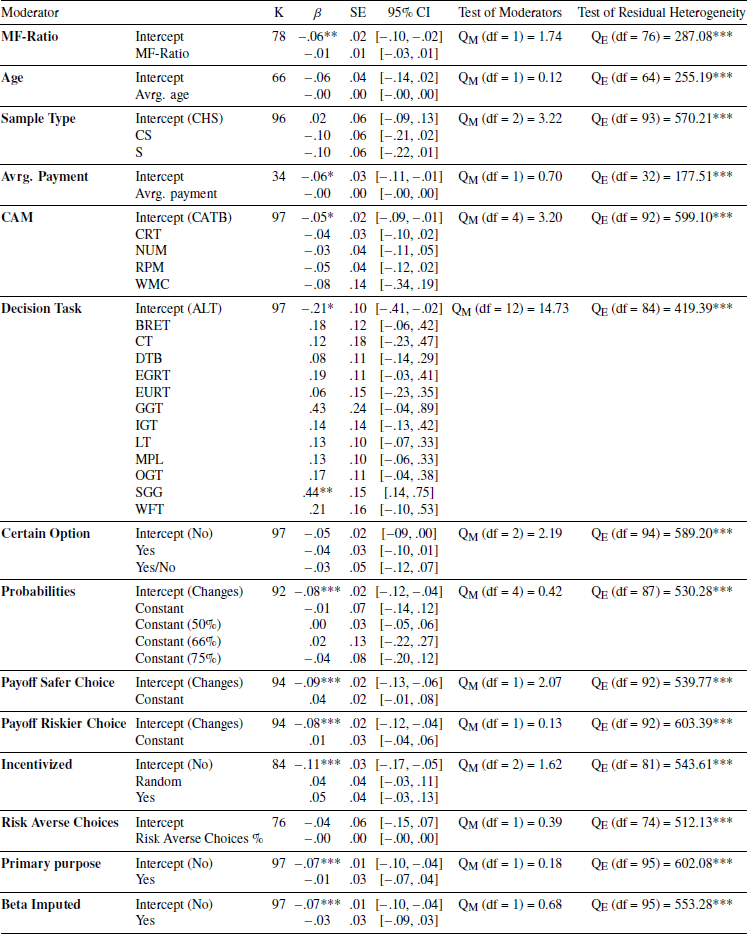
Note. p < .05 = *, p < .01 = **, p < .001 = ***.

Note. p < .05 = *, p < .01 = **, p < .001 = ***.
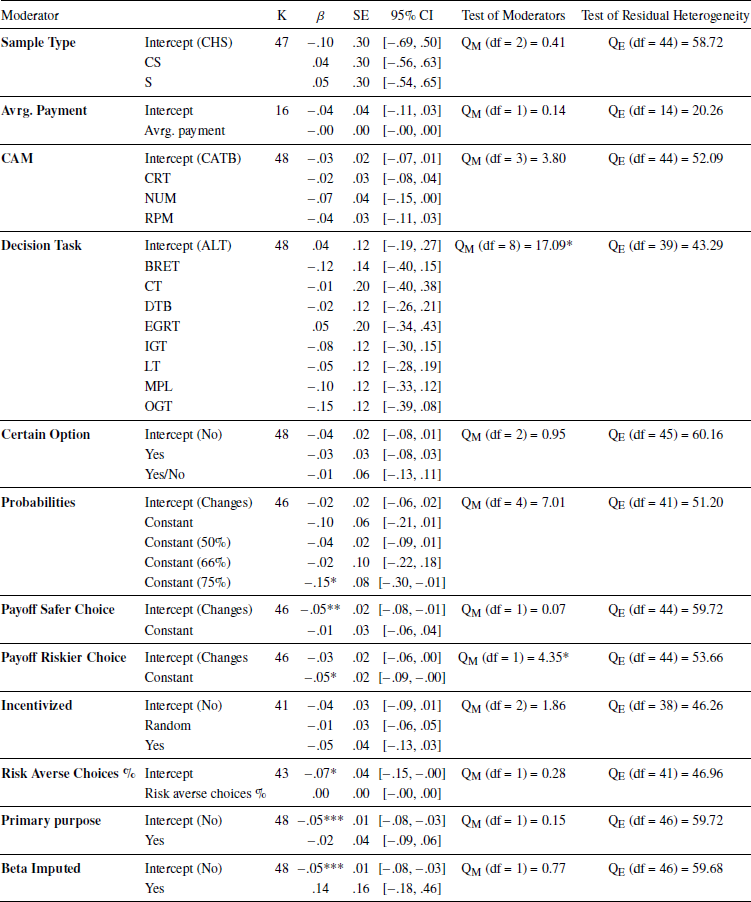
Note. p < .05 = *, p < .01 = **, p < .001 = ***.

Note. Not available (NA), cognitive ability measure (CAM), student sample (S), community sample (CS), children sample (CHS), cognitive ability test battery (CATB), ravens progressive matrices (RPM), cognitive reflection task (CRT), numeracy test (NUM), adaptive lottery task (ALT), budget line allocation task (BLAT), Cambridge gamble task (CGT), decision task battery (DTB), Eckel-Grossman risk task (EGRT), Gneezy Potters investment task (GPIT), income gamble task (IGT), lottery task (LT), multiple price list (MPL), one-shot gambling task (OGT), portfolio choice task (PCT), Sabater-Grande-Georgantzis lottery panel (SGG).
Note. Not available (NA), cognitive ability measure (CAM), student sample (S), community sample (CS), children sample (CHS), cognitive ability test battery (CATB), ravens progressive matrices (RPM), cognitive reflection task (CRT), numeracy test (NUM), adaptive lottery task (ALT), budget line allocation task (BLAT), Cambridge gamble task (CGT), decision task battery (DTB), Eckel-Grossman risk task (EGRT), Gneezy Potters investment task (GPIT), income gamble task (IGT), lottery task (LT), multiple price list (MPL), one-shot gambling task (OGT), portfolio choice task (PCT), Sabater-Grande-Georgantzis lottery panel (SGG).

Note. p < .05 = *, p < .01 = **, p < .001 = ***

Note. p < .05 = *, p < .01 = **, p < .001 = ***

Note. p < .05 = *, p < .01 = **, p < .001 = ***.

Note. Not available (NA), cognitive ability measure (CAM), student sample (S), community sample (CS), children sample (CHS), cognitive ability test battery (CATB), ravens’ progressive matrices (RPM), cognitive reflection task (CRT), multiple price list (MPL), cups task (CT), adaptive lottery task (ALT), lottery task (LT), gift gambling task (GGT), Eckel-Grossman risk task (EGRT).
Note. Not available (NA).
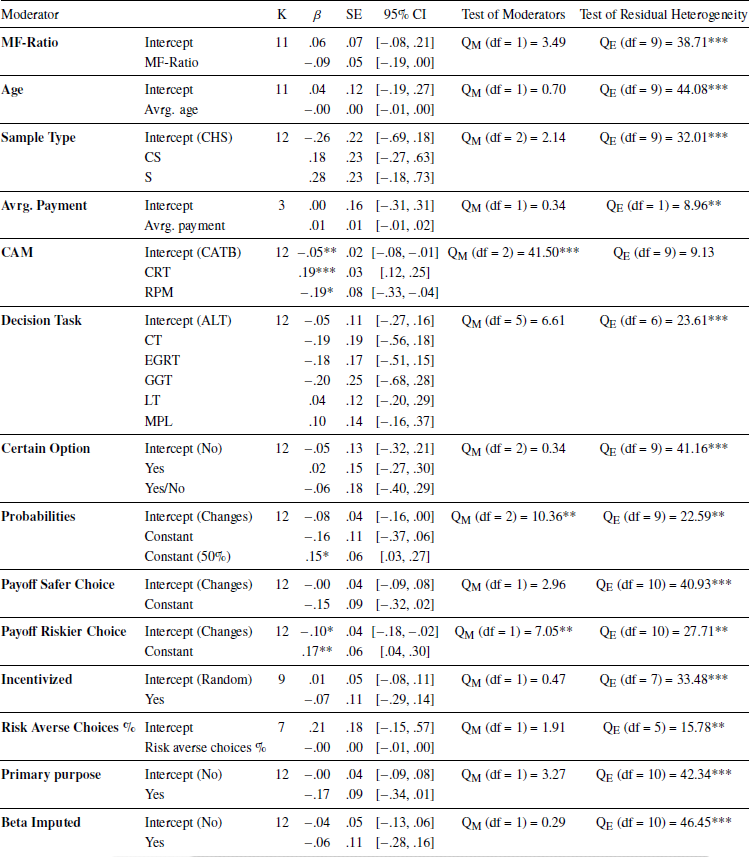
Note. p < .05 = *, p < .01 = **, p < .001 = ***
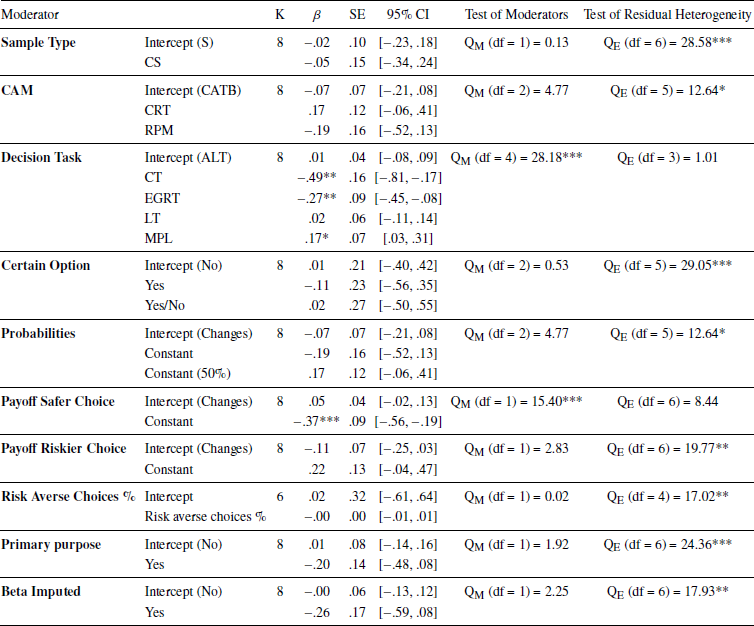
Note. p < .05 = *, p < .01 = **, p < .001 = ***. Data available for the domain of losses was insufficient to investigate the influence of average payment as well as the incentive structure of the decision task used to measure risk aversion for males only.
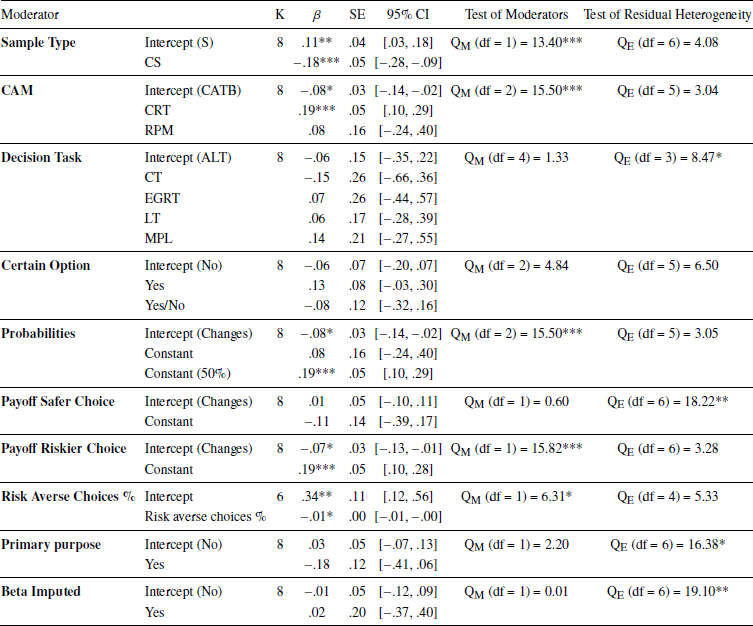
Note. p < .05 = *, p < .01 = **, p < .001 = ***. Data available for the domain of losses was insufficient to investigate the influence of average payment as well as the incentive structure of the decision task used to measure risk aversion for females only.


 Open access