

1 Introduction
Predictions of future events, like climate changes, are rarely made with certainty and can, at best, be described in probabilistic terms. New observations and improved models will lead to updated predictions, where the original estimates are revised, upwards or downwards, as the case may be. For instance, each month the International Research Institute for Climate and Society issues a seasonal climate forecast for the entire globe, including the likelihood of the weather phenomenon El Niño. The February 2015 forecast stated that “Based on the latest models, the chance of an El Niño developing during the current (February-April) season is around 48%, down from 63% last month” (Gawthrop, 2015, February 20). How do people perceive such revised forecasts? If the chance of an El Niño has decreased from 63% in January to 48% in February, what will happen in March?
Revised forecasts such as these could give rise to different expectations for future developments. For the present purpose, we will distinguish between three strategies. One would be simply to discard the first estimate and stick to the last, updated estimate as the best forecast available. Alternatively, the existence of two different estimates might be taken to mean that “the truth” lies somewhere in between. This strategy would lead to future estimates that are more regressive (more “conservative”) than the most recent ones. Thirdly, the change from the first to the second estimate could be viewed as a trend towards increased or decreased certainty that might be extrapolated into an even more extreme future: In March, the chance of an El Niño will be even lower than 48%. In the following, we will refer to these three strategies as predicting “no change” (i.e., from the most recent forecast), a “reversed trend”Footnote 1, and a “continued trend”, respectively.
Studies of trend perceptions in other areas have amply demonstrated that people use autocorrelations within a time series to extrapolate trends, thinking that an increasing trend will continue to increase, and a decreasing trend will continue to decrease, although somewhat less steeply (trend damping) (Reference Harvey and ReimersHarvey & Reimers, 2013; Reference LewandowskyLewandowsky, 2011; Reference SvensonSvenson, 1991). These studies have typically involved a series, rather than just two, observations prior to predictions. Moreover, they have focused on judgment-independent observations and measurements, rather than expert predictions.
The task of predicting a forecaster’s future predictions, which is the theme of the present studies, could be a challenge. On one hand, probabilistic predictions that have already been revised once suggest that the forecaster may change her mind again in the future. On the other hand, we do not know in which direction. If the expert herself had suspected that her future probability estimates, at T 3, would be higher rather than lower, this should have been incorporated in her probability estimate already, at T 2. The receiver of a revised forecast may suspect that the present forecast will not be the final one, but without further privileged information, the most reasonable option is arguably to keep the most recent forecast as the best guess. Whether and how the forecast has changed relative to a past estimate should not affect the prediction of the subsequent forecast.
Observations from football betting (Reference TassoniTassoni, 1996) and the stock market (Reference ShefrinShefrin, 2001), suggest that bettors and investors “overreact” to recent positive performances, apparently looking for positive trends that they believe will continue into the future (Reference Offerman and SonnemansOfferman & Sonnemans, 2004). Such trend perceptions are formed quickly. Reference Carlson and ShuCarlson and Shu (2007) found evidence for a “rule of three”, which indicates that three observations in a row are all it takes to form a perceived “streak”, suggesting that more of the same will follow. In Carlson and Shu’s experiments the observations were either identical to each other (e.g., three successful outcomes in a row), or forming a linear increase (e.g., an investment object going up 1% on three consecutive days). These streaks were observed in domains where outcomes are surrounded by considerable uncertainty (gambles, stock prices, basketball shots), and could partly or wholly be attributed to chance factors. In the present research, we suggest an even simpler “rule of two” for deliberate, non-chance changes in estimates. When the International Research Institute updates their probability of El Niño they do not produce their estimates by rolling dice, but by entering new observations into complex and well-tried models. The deliberateness and apparent reliability of this process lend the estimates an air of objectivity; so two estimates may be enough to demonstrate the existence of a “true” decrease or increase. The trend from T 1 to T 2 is in this case obvious, the question being simply whether it is predicted to continue. Such projections will in the present paper be called a trend effect.
Results compatible with a trend effect were obtained in a study by Juanchich, Teigen and Villejoubert (2010, Table 2). In one of their experiments, participants were told about a suspect whose probability of guilt was estimated by a profiler at two separate occasions, T 1 and T 2. In two conditions, the profiler revised his probabilities upward from .40 to .60, or from .20 to .40, after taking new evidence into account. In two other conditions, the probability was revised downward from .80 to .60, or from .60 to .40. The study was primarily about verbal communication of probabilities, but participants were also asked how strongly they were convinced that the suspect was guilty. This was expected to be a function of the most recent probability estimate, at T 2 (.40 vs. .60), but might also be related to the direction of revision (trend). Both effects were confirmed by a 2 x 2 analysis of variance (not reported in the original publication), which yielded a significant main effect of probability magnitude, F(1,121) = 9.71, p < .002, η 2 p = .07, and also a significant main effect of trend, F(1,121) = 14.37, p = .001, η 2 p = .11 (no significant interaction). This is interesting, as it indicates that the same probability at T 2 will differentially affect participants’ beliefs, dependent upon its value in the past. In this case, reduced probabilities were regarded as clearly less convincing than identical probabilities that were the result of an increasing trend. It is as if the participants were predicting that next week, evidence might be found that will further weaken the likelihood of guilt in the first case, and strengthen the suspicion in the second. In other words, they may think of the revised probabilities as indications for some sort of monotonic trend that will continue into the future.
1.1 The present research
In this article we propose and test the idea that one revision of a probabilistic forecast is perceived as indicative of a trend that is expected to continue in subsequent revised forecasts. Consequently, when faced with an upgraded forecast, people will predict further upgrades to take place later on, while a downgraded forecast will cause predictions of lower forecasts in the future.
In five studies, and across a variety of climate-related domains, we examined the effects of a change between two forecasts at T 1 and T 2 on receivers’ predictions of a future forecast at T 3. The main focus was on revised probabilities, but people’s forecasts about other projected quantities, such as the most likely future sea level rise, were also examined. Studies 1–3 explored people’s predictions of future forecasts concerning sea level rise, temperature change and agricultural productivity by the year 2100, after receiving current forecasts that had been updated from an initial, higher or lower value. The forecasts were produced either by a human judge (a climate scientist) or by a computer. Study 4 examined the perception of revised landslide risks that were expressed categorically, according to a simple color scheme. Participants were in this study asked who would be most worried by a “moderate” (yellow) risk: people who learned that it used to be “serious” (red), or those who knew it used to be minor (green). In Study 5 we compared the perception of revised earthquake risks for areas that were presented together (joint mode) or singly (separate mode). In this study the reduced risk was consistently higher than the stable and the increased risk, pitting trend information against information about risk levels.

T 1: Experts’ forecast in 2000; T 2: Experts’ forecast in 2013; T 3: Predicted forecast in 10 years.
a Most likely sea level rise in year 2100, relative to 2000
b Probability of a temperature increase of about 3 °C by 2100, relative to 2000.
2 Study 1: Predicting the next climate forecast
2.1 Method
A questionnaire was given to 62 students taking part in an introductory course in educational science at the University of Oslo (79% female, age: M= 21.5, SD = 3.4).
All respondents were informed about the conclusions of two reports written by a fictional climate scientist, Heidi Knutsen, concerning sea level rise and temperature change by year 2100. The predictions were allegedly made at two different points in time. For half of the participants, estimates increased from the first report to the second. For the other half, the values decreased. Respondents were randomly assigned to four conditions, in a 2 x 2 design, with presentation order (sea level estimates first/last) and direction of trend (increasing/decreasing) as the two factors. After a brief introduction, the two scenarios were described as follows [decreasing estimates in brackets].
Sea level rise. In 2000, Heidi Knutsen concluded that the global sea level in year 2100 most likely would be 20 [60] cm higher than in 2000. In her most recent report (2013), she concludes that the global sea level in 2100 most likely will be 40 cm higher than in 2000. In her most recent report (2013) she concludes that the global sea level in 2100 most likely will be 40 cm higher than in 2000. Knutsen continues to gather information and improve her models. Imagine that she in ten years publishes a new report on sea level rise. What do you think she will now consider as the most likely sea level in 2100?
In 2100 the sea level will be ___ cm higher than in 2000.
Temperature rise. In 2000, Heidi Knutsen concluded that it is 60% [80%] likely that the global mean temperature in year 2100 will be about 3°C higher than in 2000. In her most recent report (2013), she concludes that this temperature increase is 70% likely. Knutsen continues to gather information and improve her models. Imagine that she in ten years publishes a new report about temperature changes. What do you think she will conclude in her new report?
It is ___% likely that the temperature will increase with about 3°C by year 2100.
2.1.1 Climate change beliefs.
After making their predictions of the expert’s future forecast, all participants answered a questionnaire concerning their own climate beliefs. This measure, originally developed by Austgulen (2012), consisted of ten statements (example item: “Climate change is just natural variation in the temperature of the earth”), to be rated on Likert scales ranging from 1 (completely disagree) to 5 (completely agree).Footnote 2 Five items indicating climate skepticism were reverse scored, and answers in the response category “I don’t know” were recoded as 3 (neutral), to yield an overall score for belief in human-caused climate change. This measure was included to assess whether the present sample was comparable to the Norwegian population at large, and to investigate whether personal attitudes affected participants’ expectations of future forecasts.
2.2 Results and discussion
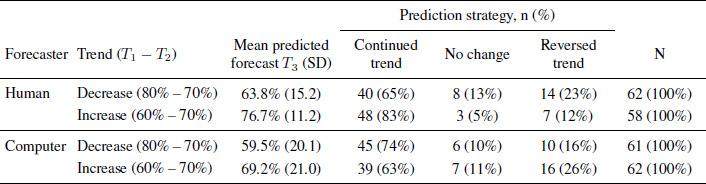
Mean predictions of the expert’s future prognoses are summarized in Table 1. Two-factor (order x trend) ANOVAs for each scenario reveal a highly significant main effect of trend upon future sea level predictions, F(1, 58) = 9.34, p = .003, η 2 p = .139, and a similar effect upon future probability estimates, F(1, 55) = 16.49, p < .001, η 2 p = .231. (There was also an indication of order effects, as the estimates were generally lower, and the difference between trends more conspicuous in the temperature first conditions. However, none of these main effects or interactions reached significance.)
As shown in Table 1, participants who had been told that Knutsen’s past predictions of sea level had increased from 20 to 40 cm thought that her future prognosis would be on the average 50.1 cm, adding 10 cm to her most recent estimate. Those who were told that her prognosis had decreased from 60 to 40 cm were less in agreement about their future projections, but their estimates were on average considerably lower, suggesting a mean sea level rise of 36.9 cm as Knutsen’s future prognosis.
The probability scenario yielded similar findings. Knutsen’s probability of a 3 °C temperature increase was believed to become still higher (from 70% to 75.4%) in the increase condition, and still lower (from 70% to 62.2%) in the decrease condition. Overall, a majority of participants projected the trend observed in Knutsen’s past predictions into the future, indicating higher values than Knutsen’s last estimate when the trend was increasing, and lower values than her last estimate when it had been decreasing, as shown in the right half of Table 1. Only a small minority (16%) thought that her most recent estimates would serve as a “best guess” of her future estimates. Among those who predicted a change, continued trends were much more common than reversed trends ( p < .001 by binomial tests).
The climate belief questionnaire showed that participants were overall more climate change believers than skeptics, with a mean score of 3.81 ( SD = 0.73). This comes close to the results from Austgulen’s (2012) national sample with 1500 participants, with participants in the present study being slightly less skeptical than the national sample about climate change caused by human behavior.
Interestingly, probability estimates correlated positively with climate beliefs both in the increasing ( r= .48) and the decreasing ( r = .36) conditions. Also estimated sea level rise correlated positively with climate beliefs in the increasing condition ( r = .40), but not in the decreasing condition ( r = –.19). All positive correlations are significant at the .05 level. For sea-level rise, the interaction between beliefs and direction was significant ( p = .034), although the main effect of direction (but not beliefs) was still significant ( p = .006) when the interaction term was excluded. Thus, participants’ estimates of what the climate expert is going to say in ten years are determined by the observed trend in the forecasts combined with their individual beliefs about climate change.
3 Study 2: Computers versus human forecasters
Study 1 did not make it entirely clear to participants how the forecasts were obtained. Participants were told that “since different climate models give different expectations of the future climate, and because scientists get new information and develop their models, their prognoses may change”. However, it was not explicitly stated whether prognoses were based on climate models alone or in combination with human judgment. Respondents might assume that the expert’s opinions and intuitions played a part as well. Human judges are known to modify their original judgments rather slowly, due to some bias, such as conservatism (Reference EdwardsEdwards, 1968), confirmation bias, a need to appear consistent, or anchoring and under-adjustment (Reference Tversky and KahnemanTversky & Kahneman, 1974). Thus one might argue that the forecast at T 2 might have been revised too little, and that it would still take time and another report for the expert to bring her forecasts in accordance with the available information. This might justify an expectation of future revisions. This explanation would, however, apply only to forecasts made by a (biased) human forecaster, and not to forecasts made by a mechanical device. Study 2 was designed to control for this possibility, by comparing forecasts produced by a human expert with forecasts produced by a computer.
All forecasts give the probability of a temperature increase of about 3 °C by 2100, relative to 2000.
T 1: Forecast in 2000; T 2: Forecast in 2013; T 3: Predicted forecast in 10 years.
3.1 Method
Participants were 243 American respondents recruited through the online subject pool Mechanical Turk (53% male, age: M = 34.9 years, SD = 11.7, seven respondents were removed due to failed attention check). Most respondents (85.1%) reported to have at least some college education. Respondents were presented with the same temperature scenario as in Study 1, except that half of participants were told that the forecasts were obtained by a computer model. The other half was told that a climate scientist produced the forecasts. Participants were randomly allocated to four conditions, in a 2 x 2 design, with forecaster (computer/climate scientist) and direction of trend (increasing/decreasing) as the two factors. All participants were asked to predict the future probability of a temperature rise of about 3 °C (5.4 °F), as in Study 1. The vignettes given to participants in the two forecaster conditions are presented below [decreasing estimates in brackets].
Computer forecasts. A large meteorological institute has over the past 15 years used an advanced computer program to predict future climate changes. The projections are based on complex climate models, integrating a large variety of information relevant for the climate. Climate prognoses may change over time, because of improved models or changes in the factors affecting the climate. Imagine that the institute has released two reports on future temperatures, based on the computer model. In 2000, output from the computer model indicated that it is 60% [80%] likely that the average global temperature by year 2100 will be about 3 °C (5.4 °F) higher than in 2000. In the most recent report (2013), output from the computer model indicated that it is 70% likely that the average global temperature by 2100 will be about 3 °C (5.4 °F) higher than in 2000. Imagine that the computer model in 10 years is used to project the future temperature change. What do you think the output will indicate this time?
It is ____ % likely that the average global temperature by 2100 will be about 3 °C (5.4 °F) higher than in 2000.
Human forecasts. Dr. Mary Johnson is a climate scientist. Over the past 15 years, Dr. Johnson has been predicting future climate changes. Her projections integrate a large variety of information relevant for the climate. Climate prognoses may change over time, because of improved models or changes in the factors affecting the climate. Imagine that Dr. Johnson has released two reports on future temperatures. In 2000, Dr. Johnson’s report indicated that it is 60% [80%] likely that the average global temperature by year 2100 will be about 3 °C (5.4 °F) higher than in 2000. Dr. Johnson’s most recent report (2013) indicated that it is 70% likely that the average global temperature by 2100 will be about 3 °C (5.4 °F) higher than in 2000. Imagine that Dr. Johnson releases a new report in 10 years about the future temperature change. What do you think her report will indicate this time?
It is _____ % likely that the average global temperature by 2100 will be about 3 °C (5.4 °F) higher than in 2000.
3.1.1 Climate change beliefs
After submitting their predictions participants rated their beliefs in human-caused climate change on an English translation of the climate questionnaire used in Study 1.
3.2 Results and discussion
A majority of participants in all conditions predicted a continued trend, as shown in Table 2, resulting in higher probability estimates at T 3 for increasing than for decreasing trends. A two-factor (forecaster x trend) ANOVA yields a significant main effect of trend, F(1, 239) = 25.64, p < .001, η 2 p = .097. There was also a significant main effect of forecaster, F(1, 239) = 16.49, p < .001, η 2 p = .231, with computer forecasts around 5 percent points lower than human forecasts (no significant interaction).
Participants who were told that a climate scientist produced the forecasts predicted similar future changes as did the Norwegian students in Study 1, replicating the trend effect in an online study with a different (American) sample.
Replacing the human expert with a computer did not make the trend effect disappear. Only 10% retained the T 2 forecast as their best guess. Of those who predicted a change from T 2 to T 3 a large majority suggested more trend projection at T 3, as indicated by a comparison between the columns for continued and reversed trends in the table (binomial tests give p < .001 in all four conditions).
In the mean predicted forecasts, reported in Table 2, the trend effects appear to be somewhat attenuated by large individual differences, with some participants giving very low future probabilities. These low estimates, which mostly occurred in the computer condition, might be due to the preciseness of the prognosis. The forecast described the probability of a temperature rise of about 3 °C. As the sample in Study 2 was American, participants were informed about the Fahrenheit equivalent of 3 °C (5.4 °F) in parenthesis, 5.4 perhaps suggesting a value too specific to be predicted as the most likely temperature change ten years from now, given the uncertainty surrounding climate changes. It would be particularly unlikely in the case of a computer-made forecast, which might be expected to contain exact values (including decimals). The low probabilities given by some participants could accordingly reflect an expectation of a future “most likely value” different from (above or below) 3 °C.
However, considering the large proportion of participants who follow the trends even in the computer conditions (68.3% vs. 73.3% in the human conditions, χ 2(1, 243) = 0.746, p = .388), it is evident that the trend effect is not limited to forecasts produced by a human expert. Thus the trend effect cannot be merely a way to adjust for a biased forecaster.
Participants’ attitudes to climate change were similar to those of participants in Study 1, with identical mean score, M = 3.81 ( SD = 0.87). As in Study 1, there was an association between personal belief in climate change and expected future probabilities. Belief in climate change was positively associated with predicted probabilities in the increasing conditions (computer condition: r= .40, p = .001; human expert condition: r = .33, p = .011), but more mixed in the decreasing conditions (computer: r = .25, p = .050; human: r = .03, p = .799), where participants’ beliefs in climate changes and the trend effect pull in opposite directions.
4 Study 3: Predicting the next grain production forecast
This study was designed as a conceptual replication of Study 1, avoiding potential order effects by featuring only one scenario. Instead of describing the probabilities of a specific future quantity (“the likelihood of a temperature rise of about 3 °C”) the forecasts in Study 3 describe probabilities of a future quantity above a specific value. In this way, high probabilities in both present and future forecasts became more plausible. Moreover, we chose predictions of agricultural productivity, where the effects of climate changes (for better or worse) are debatable. For instance, while warmer temperatures could increase the growing season and thus the cereal productivity in Norway, new diseases and increased risk of heavy rainfall could have a damaging influence (Yara, n.d.). Therefore, forecasts about cereal productivity that are either increasing or decreasing might be more realistic than the trends presented in Studies 1 and 2.
T 1: Experts’ forecast in 2000; T 2: Experts’ forecast in 2013; T 3: Predicted forecast in 10 years.
a Minimum grain production in year 2100, in kg per 1000 m2
b Probability of producing 500 kg or more grain per 1000 m2 in 2100, in %
4.1 Method
Participants were 101 students attending a course in psychology at the University college of Lillehammer, Norway (75% female, age: M = 21.6 years, SD = 5.1, two participants were removed due to extreme outliers or missing responses). Respondents were randomly assigned to one of four conditions in a 2 x 2 design, with productivity estimate (amount/probability) and direction of trend (increasing/decreasing) as the two factors.
All groups were given a brief introduction about cereal production in Norway and the uncertainty surrounding the expected grain crops in year 2100, due to climate change. They were told that Randi Rugstad, an expert on agriculture and climate change, had written several reports on the future of grain crop in Norway, which is commonly measured in terms of areal productivity (kg per acreage of land). They then received her predictions framed either in terms of increasing [decreasing] amounts, or in terms of increasing [decreasing] probabilities of a given target amount.
Amounts. In 2000, Randi Rugstad concluded a report that in year 2100 it will be produced 400 [600] kg of grain or more per decare (1000 m2). In her most recent report (2013), Rugstad concludes that the areal productivity will be higher [lower]. She now estimates it to be 500 kg or more per decare. Rugstad continues to gather information on grain production and climate changes. Imagine that she issues a new report in ten years. How do you think she will conclude?
In 2100 it will be produced ____ kg of grain or more per decare.
Probabilities. In 2000, Randi Rugstad concluded a report that in year 2100 it will be produced 500 kg or more grain per decare (1000 m2), with a probability of 50% [70%]. In her most recent report (2013), she concludes that the probability for this productivity is higher [lower]. She now estimates a probability of 60%. Rugstad continues to gather information on grain production and climate changes. Imagine that she issues a new report in ten years. How do you think she will conclude?
She now estimates a probability of ____% for producing 500 kg grain or more per decare.
4.1.1 Climate change beliefs
Participants were subsequently asked to indicate their agreement with the statement: “I’m sure that human-made climate changes occur”, on a scale from 1 (completely disagree) to 5 (completely agree).
4.2 Results and discussion
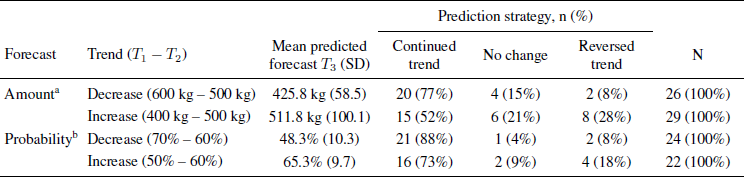
As in the previous studies, most participants saw the changes in the expert’s reports from T 1 to T 2 as indication of trends they thought would continue into the future. When Rugstad’s estimates of grain productivity increased from 400 to 500 kg, 52% thought that her next estimates would be above 500 kg, whereas 77% of those who were told that her estimates were reduced from 600 to 500 kg guessed that her future estimates would be below 500 kg (see Table 3). Participants in the probability conditions similarly thought that an increased certainty from T 1 to T 2 would lead to even higher certainty estimates in the future, and vice versa for reduced certainty estimates. There were more trend followers than reversers in all conditions, the differences being significant by binomial tests for probability decrease ( p < .001), probability increase ( p = .012) and decreasing amounts ( p < .001), but not for increasing amounts ( p = .21). Overall, only 13% kept Rugstad’s most recent estimate.
As a result, mean predicted productivity estimates were higher in the increasing than in the decreasing condition, M increasing= 512 kg vs. M decreasing= 426 kg; t(53) = - 3.95, p < .001. Future probability estimates were also believed to be higher after an increase than after a decrease, M increasing= 65% vs. M decreasing= 48%; t(44) = - 5.74, p < .001. It appears that the participants expected somewhat smaller changes (relative to Rugstad’s most recent report) in the increase than in the decrease conditions, perhaps because they felt it hard to believe that climate changes could have beneficial effects.
Most respondents agreed strongly with the statement about anthropogenic climate change ( M = 4.46, SD = .70). In the decrease condition there was a negative correlation between agreement with this statement and future productivity estimates ( r= –.46, p = .02), implying that participants with a strong belief in climate change were especially prone to believe that a negative trend in prognoses would continue.
5 Study 4: Judging revised categorical risks
The previous studies demonstrated that numerical prognoses that change over time are expected to continue to change. As a result, the most recent prognosis is not regarded as final, and two numerically identical prognoses may be taken to indicate an upward or a downward trend, dependent on how they differ from previous prognoses. Such changes appear to be more conspicuous, or in Hsee and Zhang’s (2010) terminology, more evaluable than the individual numerical estimates. In the risk management literature, risk magnitudes are often categorized according to a simplified scheme as “low”, “medium”, and “high”, accompanied by color codes (green, yellow, and red), (Reference Bostrom, Anselin and FarrisBostrom, Anselin & Farris, 2008; Centers for Disease Control and Prevention, 2006; Fast Project Plans, n. d.). This system is designed to combine the two basic dimensions of risk: probability and impact, such that high (red) risk indicates an adverse event with high probability of occurring, or severe consequences, or both. Similarly, a risk can be considered low (green) if severe consequences are unlikely, or the expected damages are small. This simple perceptual scheme serves to enhance the evaluability of individual risk judgments, which might reduce the need for comparisons and speculations about trends. Study 4 explored whether people will base their predictions mainly on the last, categorical (color-coded) prognosis, or still rely on trend information derived from such prognoses given at two different points in time. Will a yellow risk that has been “upgraded” from green appear more, less, or equally risky as one that has been “downgraded” from red?
5.1 Method
Participants were undergraduate students from the University of Tromsø ( n = 46) and the University of Oslo ( n = 32), 76% female, attending lectures on judgment and decision-making. Both groups received identical questionnaires except that the names of the mountains and their locations were counterbalanced, to control for individual associations to names and places. Data collections took place in the fall of 2014, shortly after a spell of extreme weather conditions provoking threats of landslide in several mountainous areas in Norway. Respondents were told that geologists communicate risks according to a color system in which green means low (acceptable) risk, yellow means moderate risk, while red means high (unacceptable) risk. They were then asked to consider a situation where three target areas are monitored for landslide risks. Risk assessments are made twice, the first time on October 15 ( T 1), and then again two weeks later ( T 2). Three (fictional) mountains received the following color codes:
Lomhesten: T 1: Yellow. T 2: Yellow
Svartoksen: T 1: Green. T 2: Yellow
Buttdalshornet: T 1: Red. T 2: Yellow
Imagine that you interview people living below these mountains. Who do you think will be the most worried?
Participants were asked to rank the three populations from 1 (most worried) to 3 (least worried). They were then told that a landslide actually happened, and asked to fill out the following sentence: “I would be most surprised if the landslide happened in ____ , and least surprised if it happened in ____”.
Observe that the risk at T 2 is the same (yellow) for all three mountains, whereas the risks at T 1 vary. Risk assessments that are based on the current risk ( T 2) alone would lead to an equal degree of worry, and equally (un)surprising landslides in all three locations. If judges take T 1 into account, they can use one of two strategies: With an averaging strategy, Buttdalshornet would be considered as most risky (and least surprising) because the risk has previously been red in this area. An extrapolation strategy would lead to a reverse rank order, with Buttdalshornet as least risky because the risk has decreased, and Svartoksen as most risky because the risk has increased.
5.2 Results and discussion
Supporting the trend (extrapolation) hypothesis, a majority of participants (61%) thought that people living in Svartoksen, where the risk had increased from green to yellow, would be the most worried. Another 28% thought that the inhabitants of Buttdalshornet, where the risk had been red before it was downgraded to yellow, were the most worried, in line with an averaging strategy. The ranking procedure did not allow participants to judge the risks as equal, yet four participants commented that there should be no difference. Most participants (62%) ranked Lomhesten, where the risk had been unchanged from T 1 to T 2, in the middle.
To test the relative strength of the trend hypothesis, the ranks of Svartoksen and Buttdalshornet were directly compared, showing that yellow after green would create more worry than yellow after red, according to 67.6 vs. 32.4% of the participants. The difference is highly significant by a binomial test ( p = .003). Yellow after green was also believed to create more concern than unchanged (yellow) risks (68.9 vs. 31.1%, p = .002).
When participants were asked to report their own surprise in the case of an actual landslide, their choices were more equal, as half of them (48.6%) declared they would be more surprised after an increasing trend, and half (51.4%) after a decrease. A landslide in Lomhesten, the mountain associated with unchanging risk, would give rise to more surprise than in (decreasing) Buttdalshornet (71.4% vs. 28.6%, p < .001) and to some extent also in (increasing) Svartoksen (60.0% vs. 40.0%, n.s.).
The ranking procedure used in the present study did not allow participants to judge all moderate (yellow) risks as equal, and in a way, forced them to take predictions at T 1 into account. Thus it cannot be regarded as a completely fair test of the categorical approach, where hazards that are given the same color code should be treated as equally risky. However, if the current degree of risk is all that counts, rank orders should be randomly chosen. But in fact one rank order (increasing, stable, decreasing) out of six possible orders was a clear favorite, chosen by 40%. If predictions at T1are taken into consideration, one could as well have argued for the reverse order. A yellow risk that has been downgraded from red has, if anything, a more sinister “track record” compared to a risk that was previously assessed to be minor (green), and might accordingly suggest a stronger landslide potential, especially if fluctuations in assessments and the measurement of landslide indicators are taken into account. Yet, the present participants believed that inhabitants of the regions at risk would be more worried by increases of a risk that used to be small, and claimed that a landslide after upgraded and downgraded risks would be equally surprising.

T 1: Seismic risk 2 weeks ago; T 2: Seismic risk today; T 3: Predicted seismic risk in 2 weeks.
a Expected worry level of inhabitants, on 1-7 scales.
6 Study 5: Judging risks in separate versus joint mode
Participants in the previous studies received forecasts that were identical at T 2 across conditions (Studies 1–3) or within the same condition (Study 4). Study 5 was designed to compare prognoses that differed both at T 1 and T 2 in such a way that “increasing” prognoses described lower levels of risk than “decreasing” prognoses, even at T 2 (with unchanged prognoses in between). Participants could accordingly base their worries and future predictions either on risk level or on trend information, or both. We assume, in line with Hsee (1996; Reference De and P.Hsee, Loewenstein, Blount, & Bazerman, 1999), that risk level will be more evaluable when different levels can be compared in a within-Ss design (joint mode). While the results from Studies 1–3 indicate that receivers make a prognosis evaluable by comparing it to preceding prognoses, we explore in this study how receivers perceive a revised prognosis when information about other revised prognoses is available: Will they still rely on past prognoses (in line with the trend effect), or will they switch to a comparison with other, concurrent prognoses? Participants in Study 5 were accordingly asked to judge risks of different levels, associated with different trends, which were presented either jointly or separately.
6.1 Method
Participants were 210 American respondents recruited through the online subject pool Mechanical Turk (55% male, age: M = 34.3 years, SD = 12.3, three respondents were removed due to failed attention check or extreme outliers). They were randomly allocated to four different conditions, one joint mode condition (A), describing earthquake risks in three different cities, and three separate mode conditions (B, C, and D), describing the earthquake risk in each of these cities.
All respondents were told that an earthquake institute operates with a seismic risk scale that goes from 0–100%, where 0 means no risk of earthquake and 100% extremely high risk. Respondents in the joint mode condition (Condition A) received information about the risk of a moderate earthquake in the city of Westerlea, which two weeks ago was estimated to 20% on the seismic risk scale. Today, two weeks later, the risk is 35%. In another city, Pryedge, the risk was 40% both two weeks ago and today. In a third city, Brookland, the risk was 60% two weeks ago, and is 45% today. In the three separate mode conditions, respondents received information only about Westerlea (Condition B), Pryedge (Condition C), or Brookland (Condition D) (all these city names were fictional). Observe that these risk estimates do not only differ in direction (increasing, stable, decreasing), but also in level at T 2. Thus the risk level of the increasing risk was consistently lower than the other risks, whereas the decreasing risk remained higher than the others.
Respondents were asked to imagine that they lived in one of these areas, and rated to which extent they would be concerned about earthquakes as an inhabitant of Westerlea [Pryedge] [Brookland], on a seven-point scale from 1 (not at all concerned) to 7 (extremely concerned). They were also asked to guess the next risk estimate issued by the earthquake institute (in two weeks) on the 0-100% seismic risk scale.
6.2 Results and discussion
Mean estimates, displayed in Table 4, show that participants who received the forecasts for all three cities together (joint mode), believed that people in Westerlea, who received low level (but increasing) risk estimates, would be less worried than people in Pryedge and Brookland, whose risk levels were generally higher. One-way (repeated measures) ANOVA for mean worry estimates in the joint mode condition yields a significant overall effect of location, F(2, 50) = 3.32, p = .044. Pairwise tests show that people in Westerlea (low, increase) were expected to be less worried than people in Pryedge (unchanging), t(51) = 2.44, p = .018, as well as in Brookland (high, decrease), t(51) = 2.47, p = .017 (the difference between Pryedge and Brookland is not significant). No effect of level could be observed in the separate mode conditions, where people in Westerlea were believed to be, if anything, more concerned than the others (no significant differences).
A majority of participants in all conditions believed that the difference between T 1 and T 2 might be understood as a trend that would continue into the future. The differences between the number of continuers compared to reversers were significant with binomial tests in all conditions ( p≤ .012). In Condition A, only one single participant believed that the next risk estimate in Westerlea and Brookland would match the prediction issued at T 2; about 2/3 believed it would be still higher in Westerlea and still lower in Brookland. In Condition B, 70% thought the next prognosis in Westerlea would be even higher, and in Condition D as many as 75% thought the next prognosis would be lower, continuing the decreasing trend from T 1 to T 2. As a result, the future prognoses for all cities became very similar in terms of absolute risk level, with a mean of around 40%, even in the joint presentation mode (the modal increases/decreases were in all conditions 15 percentage points, indicating a linear projection of trends). Thus, even if predicted worry was somewhat affected by risk level (in the joint condition), predictions of future forecasts relied mainly on trend information.
7 General discussion
We examined in five studies non-experts’ interpretations of revised prognoses about climate change and natural disasters. A majority of participants in all conditions expected that forecasts that had been revised once would be followed by further revisions in the same direction. Across all conditions, very few (2–22%) used the most rational strategy, to discount the first forecast and retain the most recent one as their best guess. These results provide strong support for a trend effect in perception of revised forecasts. Rather than taking the last forecast as the most likely future forecast, receivers use trend information to predict future prognoses.
This result is consistent with findings from other fields showing that non-experts expect the continuation of past trends in non-random sequences such as stock markets (Reference De and P.De Bondt, 1993), temperature change, share prices (Reference LewandowskyLewandowsky, 2011) and company sales, profit and loss (Reference Harvey and ReimersHarvey & Reimers, 2013). However, the present findings go beyond these studies. While previous studies have focused on people’s predictions of future target events based on past events, we have studied people’s predictions of future forecasts based on past forecasts.
When is it warranted to believe that an increase or decrease is set to continue, and when is it not? Like other inductive inferences, extrapolations seem reasonable when based on a large number of observations (time series). In previous studies, participants have been given time series with several data points, such as 20, 50, or 130 values, as a basis for extrapolations (Reference Harvey and BolgerHarvey & Bolger, 1996; Reference Harvey and ReimersHarvey & Reimers, 2013; Reference LewandowskyLewandowsky, 2011). In contrast, participants in the present studies derived trend information from just two values.
Second, extrapolations seem reasonable in areas where known mechanisms are responsible for further growth or decline. This is the case for many natural phenomena (e.g., contagious diseases, increases or decreases in animal and plant populations), climate changes, and even economic trends. In contrast, extrapolating a “trend” in forecasts that are revised once is arguably less rational. One must assume that the forecasters have incorporated all available knowledge about this subject into their most recent forecast. By expecting a future forecast that is more extreme than ever before (as far as participants know), participants implicitly express that they know more about the future than does the expert. This is a violation of the Golden rule of forecasting (Reference Armstrong, Green and GraefeArmstrong, Green & Graefe, 2015), which states that forecasters should be conservative by making proper use of cumulative knowledge and not go beyond that knowledge. If the expert expected the forecast to become even more extreme in the future, she would presumably have taken this into account in her most recent forecast. Thus, the original forecast (at T 1) should not really matter, as long as the current forecast (at T 2) is the one that is updated with the best knowledge there is at present. So why do a majority of participants expect it to undergo further, predictable changes?
In unfamiliar situations, humans sometimes misapply strategies that are adaptive in other, more familiar situations (Reference Oskarsson, Van Boven, McClelland and HastieOskarsson, Van Boven, McClelland & Hastie, 2009). It is possible that people perceive the revised forecast in the same way as they would perceive a real world change, failing to distinguish between a change in X and a change in the prediction of X. So when the climate researcher increases her prediction of sea level rise by 2100 from 20 to 40 cm, people respond as if it were the actual sea level that had changed. If such a change had taken place, due to systematic causes that remain operative over time (e.g., melting of polar ice), it would make sense to predict the rise to continue.
Participants were told very little about the basis for the forecasts and why they were revised. Background information was deliberately vague, to be compatible with revisions in either direction. Participants therefore had to mainly rely on the forecast values to make their predictions. Because human beings are pattern seekers, equipped with a perceptual and cognitive apparatus for detecting regularities even in randomness (Reference EllimanElliman, 2006), identifying and continuing a pattern or trend formed by the two numbers could be a strategy employed in the absence of information about the underlying mechanisms.
The task format might have led participants to emphasize the trend more strongly than they would have done in a real world setting. Wänke (2007) argues that many of the cognitive biases in JDM research are partly due to the communicative setting. Research participants automatically assume that all the information they are given is there on purpose, and should be used. In our studies, respondents might believe the first forecast is relevant and should be taken into account simply because it is mentioned. Disregarding the first forecast would imply that the questionnaire provides non-relevant information, and thus violates the cooperation principle in communication (Reference GriceGrice, 1975). But this does not in itself indicate how the first forecast should be taken into account. One possibility would be to average both forecasts, which very few did. Divergent forecasts could also be taken as a sign of uncertainty, or even as evidence of a cyclical pattern. Apparently most people consider a linear trend to be the best pattern suggested by two forecasts issued at different points in time.Footnote 3
7.1 Predictions of next forecast are moderated by personal beliefs
Although participants projected both upward and downward trends, they especially endorsed trends consistent with general beliefs about the consequences of climate change. That is, more participants followed upward trends for sea level and temperature rise, and downward trends for grain productivity. This was especially the case for respondents who reported strong beliefs in anthropogenic climate changes. This indicates that expectations of future forecasts are based on trend information in combination with personal beliefs, a finding consistent with the view that people make an initial assessment based on their beliefs, and adjust a probability qualifying the belief in a second phase (Reference Lawrence, Goodwin and O’ConnorLawrence, Goodwin, O’Connor, & Önkal, 2006). The result is also in line with research showing that judgments of risk related to climate change are affected by values and beliefs held by the individual (Reference Austgulen and StøAustgulen & Stø, 2013; Reference Heath and GiffordHeath & Gifford, 2006; Reference Kahan, Braman, Gastil, Slovic and MertzKahan, Braman, Gastil, Slovic & Mertz, 2007; Reference McCright and DunlapMcCright & Dunlap, 2011; Reference Slimak and DietzSlimak & Dietz, 2006), and that interpretation of uncertain climate statements varies according to attitudes to climate change (Reference Budescu, Por and BroomellBudescu, Por, & Broomell, 2012).
7.2 Implications for communication of uncertainty
The present findings have potential implications for communication of risk and uncertainty. If forecasts from different points of time are available, receivers may not interpret the last one as final. Instead, they might interpret the most recent forecast in light of previous prognoses and incorporate a belief in further revisions into their evaluations. When citizens are told that a flood risk is moderate, they may feel reassured if they are told that the risk was high last week, but threatened if told that the risk was low. As we have seen, this is not just a matter of contrast (moderate risks in comparison to high and low ones), but also the result of a forecasted trend.
It is sometimes claimed that, when people are exposed to scientific uncertainty, or to experts who make divergent forecasts about future events, their trust in these forecasts and, still worse, their belief in science, will suffer (see Reference Friedman, Dunwoody and RogersFriedman, Dunwoody & Rogers, 2009, for discussions). People who believe scientists disagree about climate change are less certain that climate change is occurring, and support climate policy less (Reference Ding, Maibach, Zhao, Roser-Renouf and LeiserowitzDing, Maibach, Zhao, Roser-Renouf & Leiserowitz, 2011). The present studies suggest that discrepant predictions formulated by the same expert (or group of experts) at different points in time, will not be conceived as inconsistent, but rather as indicative of what they will say and what will happen next. The present studies do not allow strong conclusions about how this may affect people’s feelings and beliefs. For instance, we found little effect of trend on worry level (Study 5), and no clear effect on personal surprise (Study 4). However, the results suggest that an expert can make her point more forcefully by being willing to admit that earlier predictions were over- or understated; if nothing else, it makes her present forecasts “evaluable” in the sense that we learn in which direction she is moving.
8 Conclusion
People faced with a revised forecast expect it to continue changing in the same direction in the future. Thus, two forecasts made at two different points of time are enough to suggest a trend. A forecast that has become more likely is expected to become even more likely in the future, whereas one that has become less likely is expected to become even more doubtful in the future. Thus lay people’s prediction of forecasts appear to violate the “golden rule” of forecasting (Reference Armstrong, Green and GraefeArmstrong et al., 2015) by being anything but conservative, going beyond the most extreme current forecast. Forecasters and risk communicators should be aware that estimates about the future might be evaluated not only according to their present level, but also in comparison to past forecasts. Remember the forecasts of El Niño, mentioned in the introduction? Two weeks after the downgraded forecast, the Institute announced: “El Niño is (technically) here” (Gawthrop, 2015, March 10). Surprised, anyone?


 Open access