

1 Introduction
Physiological states are fundamental to decision making and influence how we perceive and decide about risky options (Reference Loewenstein, Weber, Hsee and WelchLoewenstein, Weber, Hsee & Welch, 2001; Reference Slovic, Finucane, Peters and MacGregorSlovic, Finucane, Peters & MacGregor, 2004). In recent years, researchers have begun studying the role of homeostasis in risk tasking. This line of research has explored homeostasis directly by manipulating blood glucose levels (Reference de Ridder, Kroese, Adriaanse and Eversde Ridder, Kroese, Adriaanse & Evers, 2014), at the experiential level by measuring hunger and satiety (Reference Williams, Pizarro, Ariely and WeinbergWilliams, Pizarro, Ariely & Weinberg, 2016), and at the hormonal level by measuring leptin, ghrelin, or insulin (Reference Symmonds, Emmanuel, Drew, Batterham and DolanSymmonds, Emmanuel, Drew, Batterham & Dolan, 2010). The earliest study concluded that presenting decision makers with appetitive food cues increase their risk taking (Reference Ditto, Pizarro, Epstein, Jacobson and MacDonaldDitto, Pizarro, Epstein, Jacobson & MacDonald, 2006). This effect could be due to the fact that appetitive food cues trigger a cephalic phase reaction that, among other things tend to lower blood glucose levels (Reference Bruce and StorlienBruce & Storlien, 2010; Reference Ott, Friedrich, Prilop, Lehnert, Jauch-Chara, Born and HallschmidOtt et al., 2011). However, the most recent study, which replicated the work of Ditto and colleagues, concluded that there is no, or even a diminishing, effect of appetitive food cues on risk taking (Reference Festjens, Bruyneel and DewitteFestjens, Bruyneel & Dewitte, 2018). Considering that our blood glucose levels fluctuate as a function of time of day and food intake, it is of no small importance whether these changes impact our risk taking. Is it, for example, undesirable to operate heavy machinery before lunch, or perform surgery or trade stocks without a prior snack?
We know from several reviews, that many areas of cognition, emotion and behavior are influenced by fluctuations in blood glucose levels (Reference Dye and BlundellDye & Blundell, 2002; Reference Dye, Lluch and BlundellDye, Lluch & Blundell, 2000; Reference Gibson and GreenGibson & Green, 2002; Reference Hoyland, Lawton and DyeHoyland, Lawton & Dye, 2008; Reference LiebermanLieberman, 2003; Reference MessierMessier, 2004; Reference RibyRiby, 2004; Reference Smith, Riby, Eekelen and FosterSmith, Riby, Eekelen & Foster, 2011). From a biological perspective, a steady supply of calories is necessary to maintain blood glucose levels and uphold survival. Depending on our homeostatic demands, some behaviors might be more appropriate than others, and it seems that our brains are involved in shaping these behaviors in a more intricate way than merely by making us feel hungry. For instance, low blood glucose levels increase our willingness to pay for a hamburger (Reference Briz, Drichoutis, Nayga and HouseBriz, Drichoutis, Nayga Jr & House, 2013), but decrease our willingness to donate to charity (Reference Briers, Pandelaere and WarlopBriers, Pandelaere & Warlop, 2006). In general, low blood glucose seems to change our priorities towards food objects and away from non-food objects (Reference Brendl, Markman and MessnerBrendl, Markman & Messner, 2003). In line with this, Reference Orquin and KurzbanOrquin and Kurzban (2016) showed that blood glucose levels influence behavior in a way consistent with domain specific models derived from evolutionary biology. They also showed that while many studies rely on domain general versions of dual systems theory to explain or predict results, this theory cannot account for the complete pattern of blood glucose effects, particularly how the effect of blood glucose differs across food vs non food domains.
Motivated by this literature, we review two theories in the subsequent sections; an optimal foraging model and a dual systems model that both can account for blood glucose effects on decision making under risk. The optimal foraging model, known as the budget rule (Reference StephensStephens, 1981), predicts risk preferences as a function of energy budgets, i.e., the energy balance between consumed and expended calories which is measurable as fluctuations in blood glucose levels. The mathematically specified version of dual systems theory (Reference MukherjeeMukherjee, 2010) predicts risk preferences as a function of the relative activation in the deliberate and the affective systems, which is influenced by physiological states such as fluctuating blood glucose levels.
1.1 The budget rule
Caraco and colleagues proposed that an animal with a negative energy budget, i.e., that consume fewer calories than it expends, should be risk seeking to avoid starvation and hence maximize its chances of survival (Reference Caraco, Martindale and WhittamCaraco, Martindale & Whittam, 1980). Later, Stephens formalized the idea in what is now referred to as the budget rule: when the rate of energy intake exceeds the rate of energy expenditure during foraging, animals will be risk averse when choosing between food sources with equal mean energy payoffs (Reference StephensStephens, 1981). When energy expenditure exceeds energy gains, animals will be risk seeking when choosing between food sources with equal mean energy payoffs. The switch from risk averse to risk seeking is optimal because the probability of starvation goes towards a fifty-fifty chance of starvation as the variance of the food source goes towards infinity. The budget rule is compelling in its simplicity and several studies on animal behavior have demonstrated effects of energy budgets on switching from risk averse to risk seeking behavior (Reference Kacelnik and El MoudenKacelnik & El Mouden, 2013). The budget rule has also been the focus of much criticism (Reference Lim, Wittek and ParkinsonLim, Wittek & Parkinson, 2015). An important point being that the budget rule may be too simple; first it collapses a sequence of foraging decisions into a single one, and second, it assumes that a single threshold for survival guides the foraging decision. Other challenges relate to how animals are supposed to perceive the state of the internal and external environments to make these optimal decisions (Reference Kacelnik and El MoudenKacelnik & El Mouden, 2013).
When applying the budget rule to a specific case such as a human decision maker, further problems arise; the model assumes that the animal will starve to death overnight if insufficient calories are acquired during the daily foraging (Reference StephensStephens, 1981). However, few species are in danger of starvation on a day-to-day basis and it may therefore be difficult to apply the budget rule to larger species. These ancillary assumptions make it difficult to test the budget rule in many species and may explain the mixed evidence in favor of the budget rule (Reference Kacelnik and BatesonKacelnik & Bateson, 1997; Reference Kacelnik and El MoudenKacelnik & El Mouden, 2013).
Deriving predictions from the budget rule for human behavior is subject to all of the complications outlined above. With these caveats in mind, we assume that the energy budget in humans is reflected in blood glucose levels, with low or diminishing levels signaling a negative budget and high or rising levels signaling a positive energy budget. The assumption follows from the correlation between the consumption of calories and blood glucose levels. During and immediately after consuming a meal there are more calories available than can be expended which raises blood glucose levels. When calories are not consumed for a longer period, for instance three days, blood glucose levels gradually decrease (Reference Merimee and TysonMerimee & Tyson, 1974). From this, we assume that relative changes in blood glucose signals relative changes in energy budgets, and the budget rule therefore predicts that human decision makers will react to relative decreases in blood glucose levels by becoming more risk seeking. Since the budget rule is strictly about foraging behaviors, the prediction only applies to decisions about food.
1.2 Dual systems theory
Dual systems theory, is a compound of several theories and models that vary in their exact assumptions and degree of mathematical formalization. However, they all share the assumption that the mind consists of two major components: an affective, fast, and impulsive system I and a deliberate, slow, and calculating system II (Reference Evans and StanovichEvans & Stanovich, 2013; Reference KahnemanKahneman, 2011). Recently, dual process theory has been formalized with respect to decision making under risk by Mukherjee (Reference MukherjeeMukherjee, 2010) and later by Loewenstein and colleagues (Reference Loewenstein, O’Donoghue and BhatiaLoewenstein, O’Donoghue & Bhatia, 2015). Both models assume that the subjective value of a risky prospect is determined jointly by the affective and deliberate systems and that activation of emotional states or physiological needs shifts the balance between the two systems in favor of the affective system. In other words, low levels of blood glucose which signals a physiological need increase the affective system activation and hence impulsivity. The models differ in the implementation of these assumptions; here we focus on Mukherjee’s model since it aims to be a more general implementation of dual process theory. The model proposes that the value of a risky prospect, V ( G ), is the sum of the affective and the deliberate system value functions:
where V a ( G ) is the value of gamble G given by the affective system and V d ( G ) is the value of the gamble given by the deliberate system. The gamma term γ determines the relative contribution of the affective and deliberate systems. If gamma is zero then the value of the gamble is entirely defined by the deliberate system. Gambles are defined by a set of probabilities p and outcomes x . The affective system applies a step function to probabilities so that any probability above zero takes the value one and applies a power transformation to outcomes, x m, where m<1 resulting in a concave utility function, and therefore diminishing marginal utility. Since probabilities are assumed to be greater than zero, the affective system in practice ignores probabilities. The deliberate system computes the expected value of risky prospects, kpx , where k is a scaling parameter. The equation above can therefore be rewritten as:
We assume that low or diminishing blood glucose levels increase the relative activation of the affective system, i.e., leading to a higher γ value, resulting in an overall more concave utility function and hence risk aversion. Since the model is domain general, we derive the prediction that lower levels of blood glucose increase risk aversion for both food and non-food rewards. Note, however, that the model does not always predict increasing risk aversion with greater reliance on system 1 since this depends on the curvature of the value function.
2 Study approach
In the following, we examine the role of blood glucose in decision making under risk through two experimental studies and a meta-analysis. In both experiments, we manipulate blood glucose levels by administering a glucose-placebo solution to our participants. This operationalization has been used in previous studies, its advantage being that it is effective in controlling blood glucose levels while also being blinded and placebo controlled thus separating the effect of blood glucose from visceral sensations or subjective feelings and beliefs about hunger and satiety. In these studies blood glucose levels ranged between 4.74–5.5 mmol/L in the baseline measure to 5.80–6.96 mmol/L in the post ingestion measure (Reference Wang and DvorakWang & Dvorak, 2010; Reference Wang and HuangfuWang & Huangfu, 2017). The effect on blood glucose levels is similar to what was obtained by Rantapuska and colleagues (2017) who administered a 521 kcal meal vs no meal to fasting participants, 5.01 mmol/L at baseline measure and 6.78 mmol/L at post ingestion measure. More extreme blood glucose levels can be obtained with the glucose clamp technique as reported by Kubera and colleagues (2016), who achieved levels ranging from 2.73 to 6.18 mmol/L in the hypo- and euglycemic conditions respectively.
Previous studies have used either between- or within-subjects manipulations of blood glucose. While within-subjects manipulations increase statistical precision, there is also a risk that participants become aware of the study purpose and even of the glucose condition by the second administration of the glucose-placebo solution. To minimize awareness of the study purpose and glucose condition, we therefore manipulated blood glucose levels between-subjects. In Study 1, we measure risk preferences using a Becker-Degroot-Marshak (BDM) auction approach (Reference Becker, Degroot and MarschakBecker, Degroot & Marschak, 1964) for risky and safe food and non-food products. In Study 2, we measure risk preferences for food and non-food rewards using high and low variance gambles. We conclude by performing a meta-analysis of our own and previous studies.
3 Study 1
In Study 1, we manipulate participants’ blood glucose levels using a glucose-placebo solution. As a measure of risk preferences, we obtain participants’ willingness to pay for risky and non-risky food and non-food products. To manipulate the riskiness of the products, we inform participants that some products are produced using bio- or nanotechnology, which increases the risk of allergic reactions. The procedure is intended to increase the external validity by mimicking the risk benefit trade-offs people make in their daily lives (Reference Kahan, Braman, Slovic, Gastil and CohenKahan, Braman, Slovic, Gastil & Cohen, 2009; Reference SiegristSiegrist, 2000). If low blood glucose levels increase (decrease) risk seeking behavior, we should expect participants in the placebo condition to have a higher (lower) willingness to pay for the risky products compared to participants in the glucose condition.
3.1 Method
Participants. One hundred and seven participants were recruited through a consumer panel provider, M age = 46.30, SD age = 14.80, 54.3% women. The sample size was determined by maximization of laboratory time and budget constraints. Participants received DKK 150 for completing the study and were informed about possible risks and harms prior to the experiment. Participants provided a written informed consent. Participants who suffered from diabetes, metabolic disorders, or food allergies were excluded prior to the study. Participants were asked to refrain from eating or drinking anything containing calories four hours prior to the study.
Experimental design. The study was a 2 × 2 × 2 mixed within-between subjects design manipulating blood glucose levels (high vs low) between subjects, risk (risk vs no risk) within subjects, and product category (food vs non food) within subjects. Each product category contained 12 individual products which were randomly presented to each participant as either a risk or no risk product yielding a total of 24 observations per participant.
Materials and measures. Blood glucose levels were manipulated using 33 cl of Sprite or Sprite Zero, the former contains 33.3 g of sugar while the latter contains no sugar or calories. This manipulation has been used successfully in prior studies and the two types of soda are nearly indistinguishable in terms of flavor and mouth feeling.
Participants provided their willingness to pay for 24 products following the rules of the BDM approach, see Figure 1 for a stimulus example. Participants were given DKK 20 and asked to state their willingness to pay (WTP) for each of the 24 products. The participants were informed that one of the trials would be drawn at random to count and that a random number would be generated ranging between 0 and 20 DKK. The random number was drawn from a uniform distribution. If the participant’s stated WTP was equal to or above the randomly drawn price then the participant payed the random price and kept the remaining money. If the participant’s stated WTP was below the random price the participant did not purchase the product and kept the 20 DKK. The instructions read: “In the following part of the study you will be presented with 12 different products. Your task is to state the highest amount of money that you would be willing to pay for each of these products. Besides the payment you receive for participating in this study, we have given you 20 DKK that you may use to buy one of these products. At the end of the study, a computer chooses one of the 12 products at random and creates a random price between 0 and 20 DKK. If your buying price is equal to or above the random price, then you have to buy that product. In this case you only pay the randomly drawn price and keep the rest of the money. If your price is below the random price then you cannot buy the product but you get to keep the 20 DKK. If you have any questions at this point, please contact the experimenter.”
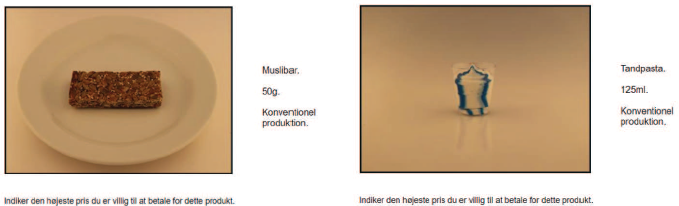
Figure 1: Examples of product images and descriptions used in Study 1 for food (left) and non food (right).
The 12 food and 12 non-food products were presented separately with images of each product. The images depicted food and non-food products without their packaging to avoid brand-related preferences. The food products were biscuits, muesli bars, and chocolate, and the non-food products were toothpaste, mouthwash, and soap.
To manipulate the riskiness of the products, participants were informed that some products were produced using biotechnology and that these products were engineered to enhance satiety albeit with a small risk of causing allergic reactions. Similarly for the non-food products, participants were informed that some products were produced using nanotechnology to enhance performance albeit with a small risk of causing allergic reactions. Risky and non-risky products were marked with a corresponding text naming them as either conventional products or product produced using bio or nanotechnology (see SI).
Procedure. On entering the laboratory, participants read and signed the consent form. Participants were then seated in front of a laboratory computer and were randomly assigned to either the glucose or placebo condition and received either 33 cl of Sprite or Sprite Zero in a neutral plastic cup. Participants were blind to the experimental condition. Participants were instructed to drink the entire content of the cup and communicate to the experimenter when the cup was empty. When the experimenter had checked that the cup was empty, the participant was given access to the study. The participants completed a short questionnaire on demographics, hunger, satiety and other control questions. Following the questionnaire, participants were randomly assigned to begin with the food or the non-food condition. The participants had two envelopes each containing DKK 20 in front of them on the table and they were instructed to open one envelope. Each condition consisted of 12 products for which the participant provided buying prices within the limit of 20 DKK. After the experiment, participants received the products they had bought. In case the participant bid under the randomly drawn price, they kept the 20 DKK.
4 Results
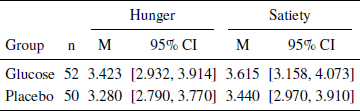
Analysis of hunger, satiety and exclusions. We measured hunger and satiety for the two experimental groups after receiving the glucose-placebo solution. Our paradigm did not influence hunger or satiety in the glucose group compared to the placebo group (see Table 1) suggesting that any effects of the manipulation were due to changes in blood glucose levels only. Three participants were excluded for failing to consume the entire content of the glucose-placebo solution (placebo condition), one for having a metabolic-related disease (glucose condition), and one for bidding zero in the entire BDM approach (placebo condition).
Table 1: Effects of glucose-placebo solution on hunger and satiety measures. Hunger and satiety were rated on a Likert scale rangering from one to seven.
Main analysis. We analyzed the effects of the blood glucose manipulation, risk, and food, non-food on willingness to pay with a linear mixed model using the lme4 package in R (Reference Bates, Mächler, Bolker and WalkerBates, Mächler, Bolker & Walker, 2015). The most predictive model was identified using a hold one person out cross validation based on RMSE (see SI). The cross validation approach reduces the risk of overfitting and is an alternative to null hypothesis significance testing which is subject to several limitations (Reference CummingCumming, 2014).
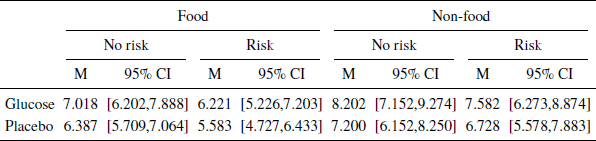
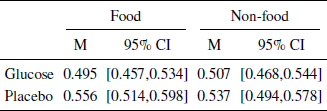
For each model, we first estimated its parameters on a training dataset set including data from all but one participant. We then applied the estimated parameters to the test dataset by predicting the responses of the left out participant. We then computed the RMSE for that person and the procedure was repeated for each person in the data set. The average RMSE for the training and test datasets is shown in the SI. We selected the model with the lowest average RMSE in the test dataset. The most predictive model had a fixed effect for blood glucose and random intercepts grouped by participant and product. However, it should be mentioned that there was only a marginal difference between the best performing models, where one of these models was the univariate model. The most predictive model retains a parameter for the glucose condition although the effect does not reach significance, βintercept= 7.256 , SE = 0.457 , p < .01 , βglucose = 0.781 , SE = 0.541 , p = .152 , d = 0.20 . Although not significant, the effect can easily be seen when splitting the mean WTP by glucose conditions (Table 2).
Table 2: Mean WTP split by glucose, food vs non-food and riskconditions. Confidence intervals aremade using non-parametric bootstrapping.
5 Discussion
In Study 1, we examined the effect of blood glucose levels on risk preferences using a BDM auction approach for risky and non-risky food and non-food products. The most predictive model had a fixed effect of blood glucose manipulation. The two next most predictive models in the cross validation both contained risk (see Table SI Table1), and that the effect of risk was in the expected direction, d = −0.15 , meaning that participants had a lower willingness to pay for risky products. Neither the cross validation nor the significance levels in the fully specified model (see SI Table 2) showed any indications of an interaction between glucose condition and risk. Our findings suggest that changes in blood glucose levels do not affect participant’s risk benefit trade-offs to use or consume riskier products as identified from their willingness to pay.
6 Study 2
In Study 2, we manipulated risk using gambles (Reference Levy, Thavikulwat and GlimcherLevy, Thavikulwat & Glimcher, 2013; Reference Symmonds, Emmanuel, Drew, Batterham and DolanSymmonds et al., 2010). We used the same glucose-placebo manipulation as in Study 1, but included a measure of blood glucose levels using a handheld glucometer. Furthermore, we included more trials and more participants to increase the power of the design. As a manipulation of food and non-food, we incentivized the gambles with M& Ms and a voucher for an online electronics store. All gambles had an expected value of zero but differed in variance. If low levels of blood glucose increases (decreases) risk seeking, we should expect participants in the placebo condition to have a higher (lower) preference for high variance gambles compared to participants in the glucose condition. As a secondary measure of risk preferences, we included the domain risk scale by Wilke and colleagues (Reference Wilke, Sherman, Curdt, Mondal, Fitzgerald and KrugerWilke et al., 2014). The scale measures risk attitudes in different domains such as food selection, mate retention, between-group competition, etc.
6.1 Method
Participants. One hundred and sixty-two participants were recruited through the local university participant pool, M age = 25.45, SD age = 5.45,, 59.33% women. The sample size was determined by maximizing within budget constraints. Participants received DKK 150 for completing the study and were informed about possible risks and harms prior to the experiment. Participants provided a written informed consent. Participants who suffered from diabetes, metabolic disorders, or food allergies were excluded prior to the study. Participants were asked to refrain from eating or drinking anything containing calories four hours prior to the study.
Experimental design. The study was a 2 × 2 × 2 mixed within-between subjects design manipulating blood glucose levels (high vs low) between subjects, risk (high risk vs low risk) within subjects, and category (food vs non food) within subjects. Each food and non food category contained 41 gambles and each gamble presented a high risk and a low risk option yielding a total of 82 observations per participant.
Materials and measures. Blood glucose levels were manipulated using 33 cl of Sprite or Sprite Zero. Blood glucose levels were measured before and after the administration of the glucose drink using a Bayer Contour glucometer.
Participants completed 41 risky gambles for each reward type; the gambles consisted of two options with two outcomes each. Examples of the two gamble types are shown in Figure 2 and a complete overview of the gambles is shown in SI Table 6. The food reward was M& Ms and the non-food reward was a voucher for an online electronics store. Participants were informed that gambles were displayed in DKK, that each gamble contributed to their earnings, that the gambles pertaining to the food reward would be remunerated in the equivalent amount of M& M’s, and that non-food gambles would be remunerated with a voucher to an online electronics store.
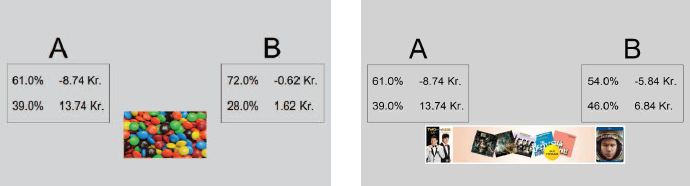
Figure 2: Examples of the food (left) and non food gambles (right).
As an additional measure, participants also completed a psychometric test measuring risk attitudes across different domains (Reference Wilke, Sherman, Curdt, Mondal, Fitzgerald and KrugerWilke et al., 2014). The items were translated and back translated into Danish. Some items were considered culturally specific to the US and were replaced with items more meaningful to the current context. For a list of items see SI Table 6. The results from this secondary measure are reported on: https://osf.io/mtb5z/
Procedure. On entering the laboratory, participants read and signed the consent form. Participants were then seated in front of a laboratory computer and their blood glucose levels were measured using a handheld glucometer. After the glucose measurement, participants were randomly assigned to the glucose or placebo condition and were given either 33 cl of Sprite or Sprite Zero in a neutral plastic cup. Participants were blind to the experimental condition. Participants were instructed to drink the entire content of the cup and communicate to the experimenter when the cup was empty. When the experimenter had checked that the cup was empty, the participants were given access to the study.
The participants completed a short questionnaire on demographics, hunger, satiety and other control questions. To ensure that participants understood the risk manipulation, they completed 20 practice trials with feedback after each gamble, and 20 practice trails with feedback at the end of the 20 gambles. The demographics and practice trials lasted between five and ten minutes. After the practice trials, participants were instructed to communicate to the experimenter who then measured the their blood glucose levels a second time. When the second glucose measurement was completed, participants were given access to continue the study. In the second part of the study, participants were randomly assigned to begin with either the food or the non-food condition. Each condition consisted of 41 gambles without feedback. Having completed the 41 food and 41 non-food gambles, the participants were instructed to answer a short questionnaire measuring risk attitudes. After completing the questionnaire, participants were instructed to contact the experimenter, who remunerated the participant according to the earnings in the critical gambles.
Earnings in the food-related gambles were paid in M&M’s, and earnings in the non-food gambles were paid out as a voucher for an online electronics store. The DKK 150 reward was divided unevenly with DKK 100 for the electronics store and DKK 50 for M& Ms. Because the expected value was zero, participants earned on average DKK 100 vouchers and received DKK 50 worth of M&Ms. To avoid influencing risk preferences, participants were not informed about the division of the reward. If participants achieved losses in one domain, no reward was paid out.
7 Results
Blood glucose, hunger, satiety, and exclusions. We measured blood glucose, hunger, and satiety for the two experimental groups. As in Study 1, our paradigm did not influence hunger or satiety in the glucose group compared to the placebo group, but effectively increased the blood glucose level for the glucose group (Table 3). Twelve participants from the placebo condition were excluded for having a blood glucose level above 5.5 mmol/l (SI Table 3). The analysis was also made with these included in the glucose condition (SI Table 4).
Table 3: Effects of glucose-placebo solution on hunger, satiety, and blood glucose measures.
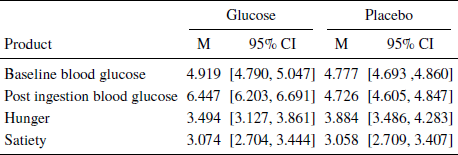
Table 4: Mean risky choice split into conditions. Confidence intervals aremade using non-parametric bootstrapping.
Main analysis. We analyzed the effects of the blood glucose manipulation and food vs non-food domain on the probability of choosing the high risk gamble using a generalized linear mixed model. The most predictive model was identified in a manner similar to Study 1 using a hold one person out cross validation based on Brier Scores which is more appropriate for binomial responses (see SI). The most predictive model had a logit link function, a fixed effect for blood glucose, and random intercepts grouped by participant and gambles, i.e., each gamble is unique in terms of the variance of the options, the levels of rewards and probabilities. These gamble parameters contribute to the participant response, which is captured in the random intercept for each of the 41 gambles. The model suggests an effect of glucose on risk aversion here reported as odds ratios, βintercept = 1.24, SE = 0.099 , p = .032 , βglucose = 0.81 , SE = 0.126 , p = .093 . Table 4 shows the mean number of risky options chosen by the participants split by the different conditions. Figure 3 illustrates the percentage of participants choosing the risky gamble split by conditions and variance. The placebo condition increases the likelihood of choosing the riskier gamble for both the food and non food rewards, but seems to have a larger effect on the former. We performed a robustness check with different models, including models with continuous measures of blood glucose levels and models where excluded participants were assigned to the treatment group. The robustness check corroborates the reported findings and can be found on https://osf.io/mtb5z/.
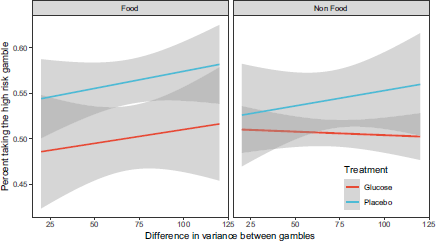
Figure 3: Percent of participants choosing the high risk gamble split by glucose vs. placebo and food vs. non food conditions. The x-axis indicates the difference in variance between the gambles and the grey areas indicate the95% confidence interval.
7.1 Discussion
In Study 2 we operationalized risk using gambles. Blood glucose levels were manipulated as in Study 1, but we additionally measured blood glucose levels before and after the glucose-placebo solution using a handheld glucometer. The analyses suggest that lower blood glucose increased risk seeking so participants were on average risk neutral with high levels of blood glucose (50.2% risky choices) and risk seeking with low levels of blood glucose (54.11% risky choices). The largest difference between glucose and placebo conditions was in the food domain.
8 Meta-analysis
To further advance our understanding of blood glucose effects on decision making under risk, we synthesize our findings and those of previous studies using a meta-analysis. Because the identified studies vary in their operationalization of blood glucose, we apply a psychometric meta-analysis. The procedure takes into account the construct validity of the specific blood glucose operationalization since low validity attenuate effect sizes. The procedure corrects the attenuated effect sizes and adjusts the influence of each study according to its validity (Reference Hunter and SchmidtHunter & Schmidt, 2004).
8.1 Method
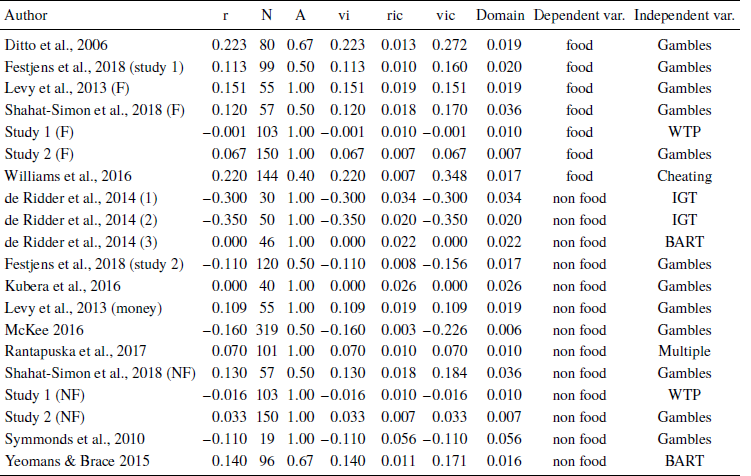
Literature search. Eleven articles were included in the meta-analysis. The articles were identified using Web of Science with the following keywords: “blood glucose” OR hunger OR “food deprivation” OR “blood sugar” OR “metabolic∗” OR “energy budget” OR “food insuff∗ ” OR “food insecur∗ ” AND “risk attitude” OR “risk pref∗ ” OR “risk seek∗ ” OR “risk aver∗ ” OR “risk behavi∗ ” OR “risk percep∗ ” OR “decision making under risk” OR “risky choice” OR “risky decision”. Google Scholar was used to identify grey literature as it indexes conference proceedings, university websites, personal websites and other sources of unpublished materials. Previous meta-analyses on blood glucose effects and decision making were searched for relevant articles (Reference DangDang, 2016; Reference Hagger, Wood, Stiff and ChatzisarantisHagger, Wood, Stiff & Chatzisarantis, 2010; Reference Orquin and KurzbanOrquin & Kurzban, 2016; Reference Vadillo, Gold and OsmanVadillo, Gold & Osman, 2016). Finally, all articles included were searched using forward and backward citation analysis. The meta-analysis included experimental and quasi-experimental studies on humans in which the independent variable manipulated or measured blood glucose, or in other ways operationalized blood glucose levels, such as through measurement of hunger, food intake, food deprivation, or cephalic phase responses. Only studies in which the dependent variable was related to decision making under risk were included. Studies in which participants were selected based on a clinical diagnosis, psychographic, or specific sociodemographic traits (e.g., eating disorders, diabetic symptoms, etc.) were excluded because these subgroups are likely to respond differently to fluctuations in blood glucose. The search process yielded 64 full text records that were screened for eligibility. Study eligibility was established using the following inclusion criteria: 1) The independent variable operationalized blood glucose through glucose administration, glucose measurement, cephalic phase reaction, food deprivation, or via a hunger score. Studies on hormonal effects or glucose tolerance were excluded from our analyses ( k = 2 ). 2) The dependent variable was related to decision making under risk, i.e., the study operationalized the variance of the outcomes of choice options. The excluded studies mostly concerned time discounting, willingness to pay, willingness to work, or decision style ( k = 37 ). 3) Studies analyzing data at aggregated levels of behavior, i.e., econometric studies, were excluded ( k = 11 ). 4) Participants were selected without regard for clinical diagnosis, psychographic, or specific sociodemographic traits. Studies on clinical subgroups were excluded from analysis ( k = 2 ). 5) The study provided sufficient information for a quantitative synthesis. Studies with insufficient information were excluded from analysis ( k = 2 ).
Extraction of effect sizes and coding of studies. Effect sizes were extracted from descriptive statistics (e.g., M, SD, SE), test statistics (e.g.,F, t, χ2, p), coefficients and effect sizes (e.g., d, η2 OR) to produce a Pearson correlation coefficient for each study. Each study was coded on the operationalization of the independent variable and its domain (food vs. non-food). We identified four different operationalizations of blood glucose levels: i) studies in which blood glucose was manipulated by administrating either a glucose-placebo solution or a meal to participants (glucose administration); ii) studies in which blood glucose levels were measured with handheld glucometers (glucose measurement); iii) studies measuring self-reported hunger and satiety scores (hunger score); and iv) studies manipulating a cephalic phase reaction by exposing participants to, for instance, food stimuli and food smells (cephalic phase). Studies were coded as belonging to the food domain if participants made decisions concerning food stimuli or were rewarded with food stimuli. All other studies were coded as belonging to the non-food domain. We identified six different operationalizations of risk preferences. Most studies used risky lotteries, the Iowa Gambling Task (IGT), or the Balloon Analogue Risk Task (BART). One study reported the effect of blood glucose on the propensity to cheat in an experiment, i.e., participants could choose to report having earned a higher reward than they actually did and run the risk of being caught cheating or truthfully report a lower reward (Cheating). One study reported the effect of blood glucose on risk taking on multiple measures such as leaving personal belongings alone and transferring money to trustees in economic experiments (Multiple). For this study, we computed an average effect size across the different measures. Finally, our own Study 1 operationalized risk preferences using willingness to pay for risky products (WTP).
Effect size synthesis. We analyzed the effect sizes using a psychometric meta-analysis. The method takes the varying construct validity of the different operationalizations of blood glucose levels into account. Imperfect construct validity attenuates the observed effect size r relative to the true effect size ρ proportional to the square root of the reliability ![]() . This attenuation introduces a bias in the final estimate of the population effect size unless corrected for taking a psychometric approach (Reference Hunter and SchmidtHunter & Schmidt, 2004). The psychometric meta-analysis computes the true average effect size ρ based on the unattenuated correlation coefficients r iu, the sample size n i, and the artifact multiplier a i :
. This attenuation introduces a bias in the final estimate of the population effect size unless corrected for taking a psychometric approach (Reference Hunter and SchmidtHunter & Schmidt, 2004). The psychometric meta-analysis computes the true average effect size ρ based on the unattenuated correlation coefficients r iu, the sample size n i, and the artifact multiplier a i :
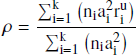
The artifact multiplier is the square root of the reliability r_xx . We used the same artifact multipliers as reported in (Reference Orquin and KurzbanOrquin & Kurzban, 2016): glucose administration, a = 1.0 , glucose measurement, a = .96 , cephalic phase, a = .67 , food deprivation, a = .503 , hunger score, a = .4 . Artefact corrections are performed on the Fisher z transformed correlation coefficients.
9 Results
We analyze the effect sizes with a psychometric meta-analysis using the metafor package in R (Reference ViechtbauerViechtbauer, 2010) using a break down strategy to test the effect of the food vs the non-food moderator. Table 4 shows corrected and uncorrected effect sizes for each study. The main analysis of the complete data set revealed no general effect of blood glucose on risk taking, β = −0.017, SE = 0.041, Z = 0.417, CI_95 = [ −0.063, 0.097 ], I 2 = 49.78% . Analyzing the food and non-food studies separately reduced study heterogeneity and revealed an effect of blood glucose on risk seeking in the food domain, β = 0.135, SE = 0.044, Z = 3.043, CI _ 95 = [ 0.048, 0.222 ], I 2 = 0% . There was only a minor improvement in heterogeneity, but no effect in the non-food domain, β = −0.049, SE = 0.048, Z = −1.027, CI 95 = [ −0.142, 0.044 ], I 2 = 42.17% .
Figure 4 shows a forest plot of the unattenuated effect sizes. We conduct an Egger’s regression to test for potential publication bias in our results. We perform the test on the entire data set, z = 0.569, p = .569 , and on the food moderator group, z = 1.468, p = .142 , and the non-food moderator group, z = 0.068, p = .946. All tests suggest the absence of publication bias which is further corroborated by inspecting the funnel plots in Figure 4. Table 5 shows the included effects.
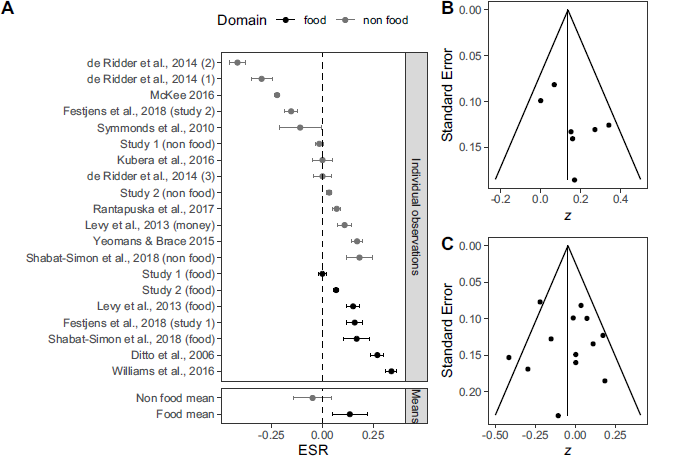
Figure 4: Panel A: Forest plot of the observed and synthesized effect sizes in the meta-analysis. Error bars indicate 95% confidence intervals. Effect sizes from our own studies are named Study 1 and Study 2. Panel B: Funnel plot for food data. Panel C: Funnel plot for non food data.
Table 5: Included effect sizes and their operationalizations of risk and blood glucose.
9.1 Discussion
The meta-analysis shows that low levels of blood glucose have a small effect on risk taking for food rewards, but there is no effect on risk taking for non-food rewards. Effect sizes in the non food domain are subject to some heterogeneity, I 2 = 42.17% , which could be due to unobserved moderators. Except for the effect size in Study 1 food condition, which falls short by a small margin, the effect sizes from our own studies lie within the confidence intervals of the meta-analytic estimates.
10 General discussion
Do changes in blood glucose levels influence decision making under risk? Previous research has provided mixed evidence, but theoretically the answer is that is does. We review two theories that differ in their predictions about how risk preferences change as a function of blood glucose levels. The dual systems model (Reference MukherjeeMukherjee, 2010) predicts that low levels of blood glucose change the balance between two mental systems in favor of a more intuitive and risk averse system, and hence that low blood glucose increases risk aversion (we note that there are exceptions to this prediction, Reference MukherjeeMukherjee, 2010, p. 248–249). The budget rule (Reference StephensStephens, 1981) predicts that a negative energy budget, which we operationalize as low or decreasing blood glucose levels, changes decision makers from risk averse to risk seeking regarding food rewards.
We investigate the role of blood glucose on decision making under risk by performing two experimental studies and a meta-analysis. In Study 1, we manipulated participants’ blood glucose levels and measured their willingness to pay with a BDM auction approach for risky and safe consumer products. We did not find any effect of blood glucose on participants’ willingness to pay for the risky vs safe products. In Study 2, we operationalize risk using gambles. In this study, participants with low levels of blood glucose were more willing to choose high variance gambles. This effect was more pronounced in the food compared to the non-food domain. In the meta-analysis which includes our own and previous studies, we found that the data was best explained by including the food vs non-food domain as a moderator and that low blood glucose increase risk seeking in the food domain, but not in the non-food domain.
Overall, the results of the meta-analysis, which bears the greatest weight, align well with the predictions of the budget rule which predicts that negative energy budgets, here operationalized through low blood glucose levels, increase risk seeking for food rewards. The budget rule makes no predictions concerning non food rewards, nor do we observe any effect in the non food domain in the meta-analysis. The finding dovetails with other studies showing that human decision makers sometimes apply foraging principles. Prior studies have, for instance, shown that hunter-gatherers follow foraging principles (Reference Raichlen, Wood, Gordon, Mabulla, Marlowe and PontzerRaichlen et al., 2014) and similar findings have been demonstrated with visual search in laboratory studies (Reference WolfeWolfe, 2013), search in memory (Reference Hills, Jones and ToddHills, Jones & Todd, 2012) and when people search for information on websites (Reference Pirolli and CardPirolli & Card, 1999). Other studies have shown that decision makers respond to monetary budgets in manner consistent with our findings (Reference Pietras and HackenbergPietras & Hackenberg, 2001; Reference Pietras, Searcy, Huitema and BrandtPietras, Searcy, Huitema & Brandt, 2008). We add to this literature by demonstrating that the effect of blood glucose levels on human decision making may best be explained by the energy budget rule or a similar need-based model of risk taking (Reference Barclay, Mishra and SparksBarclay, Mishra & Sparks, 2018).
Our findings corroborate a previous meta-analysis (Reference Orquin and KurzbanOrquin & Kurzban, 2016) in demonstrating that dual systems theory cannot account for the effects of blood glucose on decision making. Although dual systems theory is developed specifically to explain the influence of emotional and physiological states on decision making, it seems unable to account for the domain specific effect observed in this meta-analysis. The Mukherjee model furthermore predicts an effect in the opposite direction of what we observe, i.e., it predicts that low blood glucose levels increase risk aversion, but we observe that it decreases risk aversion in the food domain.
Finally, it is relevant to mention that further research is needed on the role of blood glucose and risk taking for non-food rewards. While there is no effect on average in the non-food domain, the studies were subject to some heterogeneity beyond what can be explained by sampling error. This could indicate a missing moderator at work influencing when low blood glucose increases or decreases risk seeking for non-food. Concerning risk taking for food rewards, there should be little cause for public concern. While decision makers become more variance seeking it does not seem to change their risk benefit trade-offs. In plainer words, hunger makes us more likely to gamble on getting a bigger meal, but presumably we do not become willing to eat unsafe foods.


 Open access