


1 Introduction
The growth of the ontology alignment field over the past years has led to the development of a number of ontology alignment systems. In most cases, these systems apply fully automated approaches where an alignment is generated for a given pair of input ontologies without any human intervention. However, after several editions of the Ontology Alignment Evaluation Initiative (OAEI), it is becoming clear to the community that there are limits to the accuracy of automated systems, as adopting more advanced alignment techniques has brought diminishing returns (Granitzer et al. (Reference Granitzer, Sabol, Onn, Luckose and Tochtermann2010), Paulheim et al. Reference Paulheim, Hertling and Ritze(2013)). This is likely due to the complexity and intricacy of the ontology alignment process, with each task having its particularities, dictated by both the domain and the design of the ontologies. Thus, automatic generation of mappings should be viewed only as a first step towards a final alignment, with validation by one or more users being essential to ensure alignment quality (Euzenat et al. Reference Euzenat, Meilicke, Shvaiko, Stuckenschmidt and Trojahn(2011)).
Having users validate an alignment enables the detection and removal of erroneous mappings, and potentially the addition of alternative mappings, or altogether new ones, not detected by the alignment system. Additionally, if user validation is done during the alignment process, it enables the adjustment of system settings, the selection of the most suitable alignment algorithms, and the incorporation of user knowledge (Paulheim et al. Reference Paulheim, Hertling and Ritze(2013)). Even if users make mistakes, experiments have shown that user validation is still beneficial up to an error rate of 20% (Jiménez-Ruiz et al. (Reference Jiménez-Ruiz, Cuenca Grau, Zhou and Horrocks2012), Dragisic et al. Reference Dragisic, Ivanova, Li and Lambrix(2017)), although the exact error threshold depends on the alignment system and how it makes use of the user input.
In recent years, user involvement has received increasing attention in the Semantic Web area as shown by a growing number of contributions to the literature, a dedicated workshop at the International Semantic Web Conference (Visualization and Interaction for Ontologies and Linked Data, VOILA) and a recent special issue on this topic (Ivanova et al. Reference Ivanova, Lambrix, Lohmann and Pesquita(2019)). In ontology alignment, the relevance of user involvement is evidenced by the fact that nearly half of the challenges facing the community identified in (Shvaiko & Euzenat (Reference Shvaiko and Euzenat2013)) are directly related to it. These include explanation of matching results to users, fostering user involvement in the matching process, and social and collaborative matching. Moreover, the lack of evaluation of the quality and effectiveness of user interventions was identified as one of the general issues after 6 years of experience in the OAEI (Euzenat et al. Reference Euzenat, Meilicke, Shvaiko, Stuckenschmidt and Trojahn(2011)), leading to the introduction of the Interactive Matching track in the OAEI 2013 campaign (Paulheim et al. Reference Paulheim, Hertling and Ritze(2013)) where user validation was simulated using an Oracle. This track was extended in 2015 also to take into account the erroneous user feedback to the systems as well as additional use cases.
There have been earlier studies addressing user involvement in ontology alignment and evaluating the requirements and techniques involved therein (Lambrix & Edberg (Reference Lambrix and Edberg2003); Falconer & Storey (Reference Falconer and Storey2007); Granitzer et al. (Reference Granitzer, Sabol, Onn, Luckose and Tochtermann2010); Falconer & Noy (Reference Falconer and Noy2011)). More recently, requirements for fostering user support for large-scale ontology alignment were identified and current systems were evaluated (Ivanova et al. Reference Ivanova, Lambrix and Åberg(2015)). However, these studies focused mostly on the user interface (UI) of ontology alignment systems. While that is a critical aspect for user involvement, there are other important aspects that have been largely unaddressed, such as how systems cope with erroneous user input or how they maximize the value of limited input.
In this paper, we present a broader study of user validation in ontology alignment. We start giving some basic notions of ontology alignment validation (Section 2). In Section 3, we identify the key issues regarding user validation of ontology alignments by reviewing the existing systems and literature related to ontology alignment, as well as drawing from our experience in the field. These issues pertain to three categories: the user profile (UP), the alignment systems’ services, and their UIs. In Section 4, we first assess how current systems deal with the identified issues in a qualitative evaluation (Subsection 4.1) and then use the experiments from the Interactive Matching track of the OAEI 2015–2018 campaigns to show how some of these issues impact alignment quality (Subsection 4.2).
2 Background
Ontology alignment (or matching) is the process of generating mappings, or correspondences, between the entities of two ontologies. A mapping is typically represented as a 4-tuple 〈e; e'; r; c〉, where e and e’ are the mapped entities of the ontologies, r is the semantic relation between them (usually ≡, ⊑ or ⊒), and c is a confidence score that expresses the degree of certainty in the mapping (usually in [0;1]). A set of mappings between the two ontologies is called an alignment.
The automated ontology alignment process can typically be divided into two stages: the matching stage and the filtering stage.
In the matching stage, systems employ one or more algorithms to find matching entities between the ontologies. These are usually similarity algorithms that rely on features such as labels and other annotations or the structure of the ontologies. Matching systems can reduce the computational workload of this stage by partitioning the ontologies into mappable parts (or blocks) and only generate mappings from those parts (Hu & Qu (Reference Hu and Qu2008); Hu et al. (Reference Hu, Qu and Cheng2008); Hamdi et al. (Reference Hamdi, Safar, Niraula and Reynaud2009); Nagy et al. (Reference Nagy, Vargas-Vera and Stolarski2009); Kirsten et al. (Reference Kirsten, Groß, Hartung and Rahm2011); Jiménez-Ruiz et al. (Reference Jiménez-Ruiz, Cuenca Grau, Zhou and Horrocks2012); Kachroudi et al. (Reference Kachroudi, Diallo and Ben Yahia2017); Lambrix & Kaliyaperumal (Reference Lambrix and Kaliyaperumal2017); Laadhar et al. (Reference Laadhar, Ghozzi, Megdiche, Ravat, Teste and Gargouri2018); Jiménez-Ruiz et al. Reference Jiménez-Ruiz, Agibetov, Samwald and Cross(2018)).
In the filtering stage, systems analyze the pool of candidate mappings resulting from the preceding stage and select from it a final alignment. In this stage, systems apply rules to filter out mappings so that the final alignment respects certain criteria. The simplest and most common filtering strategy consists of employing one or more similarity thresholds and excluding mappings with confidence score below these. Also common is cardinality filtering, or mapping selection, where conflicting mappings that share an entity are excluded so that only one mapping per entity remains and the final alignment is 1–1. This is usually done with an optimization algorithm, adapted from either of the related assignment and stable marriage problems (Melnik et al. Reference Melnik, Garcia-Molina and Rahm(2002)) or with a simpler greedy heuristic (e.g., Faria et al. Reference Faria, Pesquita, Santos, Palmonari, Cruz and Couto(2013)). Other filtering approaches include quality checks (Beisswanger & Hahn (Reference Beisswanger and Hahn2012)) and logic-based filtering (Jiménez-Ruiz et al. (Reference Jiménez-Ruiz, Cuenca Grau, Horrocks and Berlanga2011); Solimando et al. Reference Solimando, Jiménez-Ruiz and Guerrini(2017)). The latter aims at ensuring that logical principles such as consistency (all entities in the union of the mapped ontologies via the alignment should be satisfiable), conservativity (no new semantic relations between the entities of either ontology should be derived from the alignment), and locality (mapped entities should have semantically related entities that are also mapped) are respected by the alignment. The most common form of logic-based filtering, called alignment repair, focuses on the consistency principle.
While most ontology alignment problems have a large fraction of mappings that are trivial to detect automatically (e.g., entities have near-equal labels), they also have mappings that are challenging and that often lead to a trade-off between precision and recall—in order to capture true mappings that are challenging, alignment systems tend to capture also false mappings. This means it is necessary to manually validate ontology alignments produced automatically, especially in use cases where the goal is to integrate ontologies or make them semantically interoperable.
The ontology alignment validation process consists of asking one or more users to classify the mappings in an ontology alignment as correct or incorrect, as well as potentially replace incorrect mappings with correct alternatives, or even add new mappings. In this context, we call candidate mapping to a mapping produced automatically by a matching system prior to user validation, and validated mapping to a mapping that was classified by the user as either correct or incorrect.
We can distinguish between a pure validation setting, where the user has control of the process and validates the full final alignment produced automatically by a matching system, and an interactive setting, where the matching system asks the user to validate a selection of mappings during its matching and/or filtering stages.
The status of a mapping should not be considered absolute, because ontology alignment is not a purely objective process. Indeed, ontologies themselves are not purely objective—they reflect a given point of view of the domain they cover. Thus, entities in two related ontologies can seldom be considered fully equivalent in the mathematical sense. Rather, they are approximately equivalent under a given joint interpretation of the two ontologies, for a given alignment application.
The only practical alternative to assess mapping status is to employ a panel of experts and get a general consensus about that mapping, which is the approach commonly used to build reference alignments and evaluate ontology matching systems. But while this approach is adequate to assess the accuracy of a matching system, its adequacy to assess the accuracy of a human user is debatable, because it does not distinguish between ‘genuine’ errors, due to lack of expertise from the user, and ‘false’ errors, made knowingly, due to differences in opinion from the consensus.
In a real-world scenario, where a user is validating mappings for their own purpose, only ‘genuine’ errors matter, and the main concern should be on whether a matching system’s UI is sufficiently intuitive and informative to empower the user and compensate for their lack of expertise, thus precluding some of these errors. This is the perspective with which we discuss and assess alignment validation in Sections 3 and 4.1.
In an interactive scenario, where ontology matching systems are making their own decisions on the status of some mappings based on the user feedback on other mappings, one must also be concerned with how user errors propagate and affect the matching system. To assess this in practice, as we do in our experimental evaluation in Section 4.2, we must resort to the traditional reference alignment-based evaluation. However, here, the focus is on how the user affects the system, rather than on how the system empowers the user.
3 Overview of ontology alignment validation
Ontology alignment validation is a cognitively demanding task that involves a high memory load and complex decision-making. Furthermore, it is an exhaustive task, as ontology alignments often reach up to the thousands or tens of thousands of mappings. Thus, it depends heavily on the expertise of the user (UP), but also on the support that matching systems can provide, both in the form of services to decrease the workload of the user (system services) and in the form of visual support to aid in their decision and facilitate the validation process (UI). Within each of these three categories of aspects that affect the process of alignment validation, we can detail several sub-categories that are summarized in Table 1 and discussed in detail in the ensuing sub-sectionsFootnote 2.
Classification of aspects that affect ontology alignment validation.
3.1 User profile
Alignment validation requires users to be acquainted with the domain of the ontologies, their formal representations, and their underlying point of view, before being able to understand and decide on the mappings provided by an alignment system or creating mappings by themselves (Falconer et al. (Reference Falconer, Noy and Storey2006)).
One key aspect of the UP is domain expertise (UP.1), that is, depth of knowledge about the domain(s) of the ontologies to align. This determines the user’s ability to assess the conceptual correctness of a mapping and therefore is likely to be the main source of validation errors (Falconer & Storey (Reference Falconer and Storey2007)). Its impact is proportional to the complexity and particularity of the domain in question, with ontologies about everyday things naturally requiring less domain expertise than ontologies from specialized domains with complex terminology such as the life sciences.
Another key aspect of the UP is technical expertise (UP.2), that is, depth of knowledge about knowledge engineering and modelling, and particularly about ontologies and their formalism. This determines the user’s ability to assess the formal correctness of a mapping (i.e., whether a mapping is logically sound given the constraints of the two ontologies). While domain knowledge is critical for alignment validation, domain experts are often not familiar with knowledge engineering concepts and formal representations (Conroy et al. (Reference Conroy, Brennan, O’Sullivan and Lewis2009)) and may have difficulty in interpreting a mapping in the context of the ontologies and perceiving subtle differences in modelling that make it incorrect.
While alignment system users will usually fall under the categories of domain expert or knowledge engineer (with high technical expertise), it should be noted that domain and technical expertise are not disjoint. Indeed, the development of tools such as Protégé has allowed domain experts to delve into knowledge engineering (Gennari et al. Reference Gennari, Musen, Fergerson, Grosso, Crubézy, Eriksson, Noy and Tu(2003)). Nevertheless, the differences between these two user types are important for the design of every knowledge-based system and should be addressed both when designing the system and when building support for it. For instance, in order to assist users with limited technical expertise, alignment systems should provide information about the structure of the ontologies and the entailments of a mapping in a manner that is intuitive to understand. Likewise, in order to assist users with limited domain expertise, systems should provide detailed contextual and conceptual information about the mapping. Indeed, a study showed that, given enough contextual help, the quality of the validation of non-domain experts can approximate that of domain experts (Noy et al. Reference Noy, Mortensen, Alexander and Musen(2013))—although this is likely to depend on the domain in question.
The final aspect of the UP is alignment system expertise (UP.3), that is, familiarity with the alignment system, its functionality, and visual representations. Novice users can face comprehension difficulties and make erroneous decisions, not for lack of domain or technical expertise, but because they cannot fully acquire the information made available about a mapping or its entailments. It is up to the developers of the alignment system to make the system as intuitive as possible in both functionality and visual representations so that novice users can focus on the alignment process and are not limited by their lack of expertise with the system (Nielsen (Reference Nielsen1993)). In this context, it is important to consider that different visual representations are suited for conveying different types of information, as we will detail in Subsection 3.3. Systems should also provide support to expert users in the form of shortcuts or customizations, so that they can speed up their work.
Users can be expected to make mistakes in alignment validation (Conroy et al. (Reference Conroy, Brennan, O’Sullivan and Lewis2009); Ivanova et al. Reference Ivanova, Bach, Pietriga and Lambrix(2017)), be that due to lack of domain expertise, technical expertise, or expertise with the alignment system. However, the possibility of user errors is often disregarded in the existing alignment systems. On the one hand, it is true that users are generally expected to make less errors than automated systems, and experiments have shown that up to an error rate of 20%, user input is still beneficial (Jiménez-Ruiz et al. (Reference Jiménez-Ruiz, Cuenca Grau, Zhou and Horrocks2012); Dragisic et al. Reference Dragisic, Ivanova, Li and Lambrix(2017)). On the other hand, there are risks of taking user input for granted, particularly when that input is given during the alignment process, and inferences are drawn from it, leading to the potential propagation of errors. An example of this is given by Jiménez-Ruiz et al. (Reference Jiménez-Ruiz, Cuenca Grau, Zhou and Horrocks2012), where user-validated mappings during an alignment repair step are fixed, meaning that they cannot be removed during subsequent steps, and other potentially correct mappings may have to be removed instead.
User errors can be prevented to some extent by warning the user when contradicting validations are made (Ivanova & Lambrix (Reference Ivanova and Lambrix2013)). Furthermore, in a multi-user setting such as in crowdsourcing, errors may be diluted through a voting strategy, where the mapping confidence is proportional to the consensus on the mapping (Sarasua et al. Reference Sarasua, Simperl and Noy(2012)), or by adopting a more skeptical approach where full agreement between the users is required (Cruz et al. (Reference Cruz, Antonelli and Stroe2009)). Such a setting also enables the classification of users as trusted or untrusted (McCann et al. Reference McCann, Shen and Doan(2008)). Errors can also be reduced in a single-user setting, by asking the user to reassess previously revised mappings, though evidently the gain of such a strategy is expected to be smaller than when multiple users are available, since there is only one point of view. Regardless of the scenario, due to the substantial workload of alignment revision, especially when large ontologies are involved, there may be a trade-off between the coverage of the alignment (i.e., the number of different mappings revised) and the depth of revision (i.e., the number of user revisions per mapping) that is possible.
In particularly difficult cases, such as when the matched entities have polysemous labels and lack other annotations (e.g., synonyms and definitions) or semantic axioms, it may not be possible for users to classify mappings better than the alignment system, regardless of their expertise (Abu Helou & Palmonari (Reference Abu Helou and Palmonari2017)).
In the interest of assessing the profile of current users of ontology matching systems, we conducted a public surveyFootnote 3, where we asked users about their background, their use cases, the need for user validation, and the system(s) they use, having received replies from 24 users. As shown in Figure 1, we found that the most users are either only knowledge engineers (46%) or both knowledge engineers and domain experts (25%), whereas relatively few are only domain experts (8%) and some are neither (21%). We also found that academic users were the most common (42%), but many users work in the industry (25%) or in both industry and academia (29%). Of particular note, over 90% of the surveyed users declared that user validation was necessary in their use cases.
Profile of surveyed ontology matching system users with regard to their expertise (left chart) and background (right chart)
3.2 System services
Users capable of performing alignment validation are a scarce and valuable resource and cannot be expected to be able to validate a whole alignment of thousands of mappings. As such, the request for user intervention of alignment systems should be limited and that intervention should be exploited in such a way as to maximize its value. This is one of the main challenges of interactive ontology alignment (Jiménez-Ruiz et al. (Reference Jiménez-Ruiz, Cuenca Grau, Zhou and Horrocks2012); Otero-Cerdeira et al. Reference Otero-Cerdeira, Rodríguez-Martínez and Gómez-Rodríguez(2015)).
The strategies that alignment systems can adopt to exploit user interventions depend on the stage of involvement of the user in the alignment process: before the alignment process (SS.1.a), during the matching stage (SS.1.b), during the filtering stage (SS.1.c), in iterative fashion (SS.1.d), or after the alignment process (SS.1.e). Non-interactive systems can only involve the user before or after the alignment process.
When validation happens before the alignment process, the user provides an initial partial alignment that is then used by the system to guide the process. The partial alignment can be used in the preprocessing phase to reduce the search space (Lambrix & Liu (Reference Lambrix and Liu2009)), as input for the alignment algorithms (Lambrix & Liu (Reference Lambrix and Liu2009); Duan et al. Reference Duan, Fokoue and Srinivas(2010)), or to select and configure the algorithms to use (Tan & Lambrix (Reference Tan and Lambrix2007); Ritze & Paulheim (Reference Ritze and Paulheim2011); Paulheim et al. (Reference Paulheim, Hertling and Ritze2013); Lambrix & Kaliyaperumal (Reference Lambrix and Kaliyaperumal2017)).
When validation is done during the matching stage, it can also be used to select and configure the algorithms to use, or to decide how to combine them. When it is done during the filtering stage, it can be used to inform the filtering process. For example, systems can filter out candidate mappings that are in conflict with validated mappings (Noy & Musen (Reference Noy and Musen2000); Lambrix & Tan (Reference Lambrix and Tan2006); Jiménez-Ruiz et al. (Reference Jiménez-Ruiz, Cuenca Grau, Zhou and Horrocks2012); Ivanova & Lambrix (Reference Ivanova and Lambrix2013); da Silva et al. Reference da Silva, Revoredo and Baiao(2018a)), infer patterns from the validations and use these to guide the filtering process (Hamdi et al. (Reference Hamdi, Safar, Niraula and Reynaud2009); Guedes et al. Reference Guedes, Baiao and Revoredo(2014)), or simply decide on the similarity threshold to apply.
When validation is iterative, the user is asked for feedback on several iterations of the alignment process, where in each iteration the alignment from the previous iteration is improved (Lambrix & Kaliyaperumal (Reference Lambrix and Kaliyaperumal2017)). When validation is performed after the automatic alignment process, the input of the user cannot be exploited for aligning the ontologies.
The stage of involvement affects the feedback demand of the alignment system. When the user is involved before or during (i.e., matching, filtering, or iterative) the alignment process, the user can provide feedback about only selected mappings (SS.2.a). These are determined by the user in the former case and by the system in the latter, with strategies such as selecting only ‘problematic’ mappings where different alignment algorithms disagree (Cruz et al. Reference Cruz, Stroe and Palmonari(2012)), active learning-based strategies (Jirkovský & Ichise (Reference Jirkovský and Ichise2013); Cruz et al. Reference Cruz, Palmonari, Loprete, Stroe and Taheri(2016)), and using a similarity propagation graph to select the most informative questions to ask the user (Shi et al. Reference Shi, Li, Tang, Xie and Li(2009)). When the user is involved only after the alignment process, they will have to validate all filtered mapping candidates (SS.2.b).
In the case of an automated alignment system that does not perform filtering or an interactive alignment system that requires the user to do the full filtering process, the user will have to validate all mapping candidates. In this case, we can distinguish between two scenarios: unfiltered minimal (SS.2.c) and unfiltered redundant (SS.2.d). In the former scenario, the user is required to validate only the minimal set of mappings required for semantic interoperability between the two ontologies, meaning that no mapping in the set is semantically implied by another mapping in the set. In the latter scenario, the system produces and requires the user to validate a non-minimal alignment containing semantically implied (redundant) mappings. The most common case of redundant mapping is a subclass mapping of the form A ⊑ B when the alignment also contains an equivalence mapping A ≡ C, and the target ontology declares C ⊑ B. Fortunately, it is common practice in ontology matching to generate minimal alignments by default, and very few systems produce or display redundant mappings, as otherwise the workload in user validation would explode.
Interactive systems can extrapolate user feedback through the use of feedback propagation techniques as a strategy for reducing user workload. One form of feedback propagation is re-computation (SS.3.a) of mapping confidence through propagation from validated mappings in their neighbourhood, be that neighbourhood defined from the structure of the ontologies (Noy & Musen (Reference Noy and Musen2000); Lambrix & Tan (Reference Lambrix and Tan2006); Kensche et al. (Reference Kensche, Quix, Li and Li2007); Hu & Qu (Reference Hu and Qu2008); Hu et al. (Reference Hu, Qu and Cheng2008); Jean-Mary et al. (Reference Jean-Mary, Shironoshita and Kabuka2009); Li et al. (Reference Li, Stroe and Cruz2015); Shi et al. (Reference Shi, Li, Tang, Xie and Li2009); Wang & Xu (Reference Wang and Xu2009); Kirsten et al. (Reference Kirsten, Groß, Hartung and Rahm2011); Djeddi & Khadir (Reference Djeddi and Khadir2014); Ngo & Bellahsene (Reference Ngo and Bellahsene2016)), from the pattern of similarity scores of the various alignment algorithms (Lambrix & Liu (Reference Lambrix and Liu2009); Cruz et al. Reference Cruz, Stroe and Palmonari(2012)), or from patterns in the accepted and rejected mappings (Guedes et al. (Reference Guedes, Baiao and Revoredo2014); da Silva et al. Reference da Silva, Revoredo and Baiao(2018a)). This usually requires that the validation occurs during the matching stage or be iterative. Another form of feedback propagation that systems can implement during filtering is conflict detection (SS.3.b) (Lambrix & Tan (Reference Lambrix and Tan2006); Curino et al. (Reference Curino, Orsi and Tanca2007); Wang & Xu (Reference Wang and Xu2008); Jean-Mary et al. (Reference Jean-Mary, Shironoshita and Kabuka2009); Reul & Pan (Reference Reul and Pan2010); Jiménez-Ruiz et al. (Reference Jiménez-Ruiz, Cuenca Grau, Zhou and Horrocks2012); Diallo (Reference Diallo2014); Faria et al. (Reference Faria, Martins, Nanavaty, Oliveira, Sowkarthiga, Taheri, Pesquita, Couto and Cruz2015); Schwichtenberg & Engels (Reference Schwichtenberg and Engels2015); Ngo & Bellahsene (Reference Ngo and Bellahsene2016); Kachroudi et al. Reference Kachroudi, Diallo and Ben Yahia(2017)). This consists of detecting mapping candidates that have conflicts with validated mappings (e.g., cardinality or logical conflicts) and either automatically rejecting them or possibly asking for re-validations to resolve the conflicts. A variation of this strategy is to present the conflicting mappings together to the user, rather than individually, and ask the user to resolve the conflict (Lambrix & Tan (Reference Lambrix and Tan2006); Meilicke et al. (Reference Meilicke, Stuckenschmidt and Tamilin2008); Jiménez-Ruiz et al. Reference Jiménez-Ruiz, Cuenca Grau, Horrocks and Berlanga(2009)).
The demand for user involvement in the matching process can be evaluated by measuring the number of questions (validation requests for candidate mappings) the system asks the user and comparing it to the actual size of the alignment produced by the system. The effectiveness with which systems exploit user involvement can be evaluated by measuring their improvement in performance (in terms of precision and recall) over the fully automated process and relating it to the number of questions asked.
3.3 User interface
A graphical UI is an indispensable part of every interactive system, as the visual system is humans’ most powerful perception channel. Validating a mapping requires considering the structure and constraints of two ontologies while also keeping in mind other mappings and their logical consequences and thus is all but impossible without visual support.
There are two categories of aspects pertaining to UIs that are determining to the process of alignment validation: alignment visualization, that is, the visual support that the alignment system provides to the user and alignment interaction, that is, the functionalities the system implements to allow the user to interact with and validate the alignment.
Given the complexity of ontologies and alignments, a critical aspect of visualizing them is to avoid overwhelming the user. In general, humans apprehend things by using their working memory, which is limited in capacity (it can typically hold 3 ± 1 items) and thus can easily be overwhelmed when too much information is presented (Smith & Kosslyn (Reference Smith and Kosslyn2013)). However, this limitation can be addressed by grouping similar things, a process called ‘chunking’, which can be exploited by visualization designers to facilitate cognition and reduce memory load (Patterson et al. Reference Patterson, Blaha, Grinstein, Liggett, Kaveney, Sheldon, Havig and Moore(2014)). For instance, encoding properties of entities and mappings with different graphical primitives facilitates their identification and enables their chunking.
Another critical aspect of ontology alignment visualization is providing the user with sufficient information to be able to decide on the validity of each mapping, which includes lexical and structural information in the ontologies, and potentially other related mappings. This naturally competes with the need not to overwhelm the user with information, and a balance between the two must be struck. As we discussed in Subsection 3.1, different user types are likely to have different information requirements, and alignment systems must cater to all.
The Visual Information-Seeking Mantra (Shneiderman (Reference Shneiderman1996)) defines seven visual information-seeking tasks (UI.1.a) to be supported by information visualization interfaces in order to enable enhanced data exploration and retrieval: overview, zoom, filter, details-on-demand, relate, history, and extract. The former six of these were further refined for the purpose of ontology visualization (Katifori et al. (Reference Katifori, Halatsis, Lepouras, Vassilakis and Giannopoulou2007); Dudas et al. Reference Dudas, Lohmann, Svatek and Pavlov(2018)), and all are relevant in the context of striking a balance between providing information and avoiding memory overload.
Providing enhanced information while addressing the working memory limits is also the goal of the field of visual analytics (UI.1.b), which combines data mining and interactive visualization techniques to aid analytic reasoning and obtain insights into (large) data sets. The application of visual analytics to ontology alignments facilitates their exploration and can provide quick answers to questions of interest from the users (Lambrix & Tan (Reference Lambrix and Tan2007); Lanzenberger et al. (Reference Lanzenberger, Sampson, Rester, Naudet and Latour2008); Cruz et al. (Reference Cruz, Antonelli and Stroe2009); Cruz et al. (Reference Cruz, Stroe and Palmonari2012); Aurisano et al. (Reference Aurisano, Nanavaty and Cruz2015); Ivanova et al. Reference Ivanova, Bach, Pietriga and Lambrix(2017)).
Another technique at the disposal of alignment systems is that of providing alternative views (UI.1.c) (Falconer & Storey (Reference Falconer and Storey2007); Lanzenberger et al. (Reference Lanzenberger, Sampson, Rester, Naudet and Latour2008); Quix et al. (Reference Quix, Geisler, Kensche and Li2008); Cruz et al. (Reference Cruz, Antonelli and Stroe2009)). Different views may be more suitable for performing different tasks—for instance, graphs are better for information perception, whereas indented lists are better for searching (Fu et al. Reference Fu, Noy and Storey(2017))—and by providing alternate views, systems need not condense all relevant information into a single view and thus avoid overwhelming the user. Also relevant in this context are maintaining the user focus in one area of the ontology (Noy & Musen (Reference Noy and Musen2000)) and preserving the user’s mental map (e.g., by ensuring that the layout of the ontology remains constant).
Two strategies that facilitate chunking are grouping mappings together by different criteria to help identify patterns (UI.1.d) and identifying mapping status (UI.1.e), that is, distinguishing between validated and candidate mappings (Falconer & Storey (Reference Falconer and Storey2007)). Colour-coding is a common and effective technique for implementing both strategies.
With regard to facilitating the decision-making process, showing metadata and context such as definitions of terms (UI.1.f) is essential, and providing ranking/recommendations (UI.1.g) facilitates the process by allowing the user to focus on a specific set of mappings.
Providing mapping provenance and justification is critical to clarify the source of the mapping (UI.1.h) and has been identified as one of the future challenges of ontology alignment, given that many alignment systems merely present confidence values for mappings as a form of justification (Otero-Cerdeira et al. Reference Otero-Cerdeira, Rodríguez-Martínez and Gómez-Rodríguez(2015)). Justifications require particular attention to the UP: domain experts will require detailed contextual information and a clear explanation of how a candidate mapping was inferred, whereas for knowledge engineers summarized provenance information might suffice. Three distinct justification approaches have been identified by Euzenat & Shvaiko (Reference Euzenat and Shvaiko2013): proof presentation, strategic flow, and argumentation. In the proof presentation approach, the explanation for why a candidate mapping was created is given in the form of a proof, which can be a formal proof, a natural language explanation (e.g., Shvaiko et al. (Reference Shvaiko, Giunchiglia, Da Silva and McGuinness2005); Falconer & Storey (Reference Falconer and Storey2007)), or a visualization (Ivanova & Lambrix (Reference Ivanova and Lambrix2013)). In the strategic flow approach, the explanation is in the form of a decision flow that describes the provenance of the acquired candidate mapping (e.g., Dhamankar et al. (Reference Dhamankar, Lee, Doan, Halevy and Domingos2004); Falconer et al. Reference Falconer, Noy and Storey(2006)). Finally, in the argumentation approach, the system gives arguments for or against certain candidate mappings, which can be used to achieving consensus in multi-user environments (e.g., Laera et al. (Reference Laera, Tamma, Euzenat, Bench-Capon and Payne2006); Laera et al. (Reference Laera, Blacoe, Tamma, Payne, Euzenat and Bench-Capon2007); Jiménez-Ruiz et al. (Reference Jiménez-Ruiz, Payne, Solimando and Tamma2016); Euzenat (Reference Euzenat2017)).
Last but not least, alignment systems should provide feedback to the user about the impact of validation decisions (UI.1.i) with regard to the alignment and ontologies, possibly through a trial execution (Falconer & Storey (Reference Falconer and Storey2007)).
With respect to alignment interaction functionalities, the most basic level of interaction is to allow the user to accept/reject mapping candidates (UI.2.a). Additionally, allowing the user to create/refine mappings manually (UI.2.b) is also important, since the system may not have captured a required mapping or may not have correctly identified the mapping relation (Aumüller et al. (Reference Aumüller, Do, Maßmann and Rahm2005); Falconer et al. (Reference Falconer, Noy and Storey2006); Falconer et al. (Reference Falconer, Noy and Storey2007); Cruz et al. (Reference Cruz, Antonelli and Stroe2009); Lambrix & Kaliyaperumal (Reference Lambrix and Kaliyaperumal2017)).
The ability to search (UI.2.c) and filter information is critical to minimize the user’s cognitive load (Aumüller et al. (Reference Aumüller, Do, Maßmann and Rahm2005); Falconer & Storey (Reference Falconer and Storey2007); Lanzenberger et al. (Reference Lanzenberger, Sampson, Rester, Naudet and Latour2008); Cruz et al. (Reference Cruz, Antonelli and Stroe2009)). It is relevant to enable searching/filtering both of the ontologies (e.g., to analyze the structural context of a candidate mapping, or look for a concept to map manually) (Falconer & Storey (Reference Falconer and Storey2007); Lanzenberger et al. Reference Lanzenberger, Sampson, Rester, Naudet and Latour(2008)) and of the candidate mappings themselves (Falconer & Storey (Reference Falconer and Storey2007); Cruz et al. (Reference Cruz, Antonelli and Stroe2009); Lambrix & Kaliyaperumal (Reference Lambrix and Kaliyaperumal2017)).
Given the extension of the validation process, allowing the user to add metadata in the form of user annotations (UI.2.d) (Falconer & Storey (Reference Falconer and Storey2007); Lambrix & Kaliyaperumal (Reference Lambrix and Kaliyaperumal2017)) and accommodating interruptions or sessions (UI.2.e) are key functionalities. However, while many systems enable interruptions through saving and loading the ontologies and alignment, this often does not preserve the provenance information.
Finally, allowing users to create temporary mappings (UI.2.f) in order to test decisions is a relevant functionality for supporting the decision process (Lanzenberger et al. Reference Lanzenberger, Sampson, Rester, Naudet and Latour(2008)).
4 Evaluation
We conducted two different types of evaluation: a functional assessment of state-of-the-art ontology alignment systems (Section 4.1) and an experimental evaluation of the impact of user validation and user errors in an interactive matching scenario (Section 4.2). In Section 4.1, we manually assess how state-of-the-art ontology alignment systems comply with the key aspects we debated in the preceding section with respect to the system services (SS) they implement and the functionalities of their UIs. In Section 4.2, we report and elaborate on a series of experiments from the Interactive Matching track of OAEI 2015–2018, where simulated user input with varying error rates enables the assessment of the effectiveness and robustness of different interactive strategies (i.e., how much they gain from the user feedback, and how resilient to user errors they are). This set-up captures the play between the expertise of the user (UP) and the SS.
4.1 Functional assessment of state-of-the-art systems
To perform our functional assessment of state-of-the-art ontology alignment systems, we first identified systems that meet the basic requirements to be evaluated, that is, both incorporate user validation in the alignment process and have a mature UI. The systems that meet these criteria are the following: AgreementMaker (Cruz et al. (Reference Cruz, Sunna, Makar and Bathala2007); Cruz et al. (Reference Cruz, Antonelli and Stroe2009); Cruz et al. Reference Cruz, Stroe and Palmonari(2012)), AlViz (Lanzenberger et al. Reference Lanzenberger, Sampson, Rester, Naudet and Latour(2008)), AML (Pesquita et al. (Reference Pesquita, Faria, Santos, Neefs and Couto2014); Faria et al. Reference Faria, Martins, Nanavaty, Oliveira, Sowkarthiga, Taheri, Pesquita, Couto and Cruz(2015)), CogZ/Prompt (Falconer et al. (Reference Falconer, Noy and Storey2007); Falconer & Storey (Reference Falconer and Storey2007)/Noy & Musen (Reference Noy and Musen2000), COMA (Aumüller et al. (Reference Aumüller, Do, Maßmann and Rahm2005)), LogMap (Jiménez-Ruiz et al. Reference Jiménez-Ruiz, Cuenca Grau, Zhou and Horrocks(2012)), RepOSE (Ivanova & Lambrix (Reference Ivanova and Lambrix2013)), and SAMBO (Lambrix & Tan (Reference Lambrix and Tan2006); Lambrix & Kaliyaperumal (Reference Lambrix and Kaliyaperumal2017)). The results of our evaluation are summarized in Table 2.
Aspects addressed by state-of-the-art systems.
In the table ✓ marks that all of the listed items are supported by the system while - marks that the issue is not covered by the system. Combinations such as ✓ - and ✓ -- - - mark that one or two of the listed items are not supported. The issues are as defined in Table 1. (*) depends on the underlying system; (**) in a multi-user environment; (***) candidate and validated mappings cannot be distinguished in the user interface.
Regarding the stage of involvement of the user (SS.1), all systems support interaction after the fully automated alignment process is complete, but most also allow for user interaction at some point of the alignment process. Of these, AgreementMaker and COMA are the most interactive systems, allowing for interaction at any stage as well as in iterative fashion. They are followed by CogZ/Prompt, RepOSE, and SAMBO, all of which allow for iterative user interaction. AML and LogMap can both involve the user during filtering. AlViz does not have ontology alignment functionalities, only alignment validation functionalities, and thus can only support validation of alignments generated by other tools.
With respect to feedback demand (SS.2), most systems rely only on some form of similarity threshold to select which mappings to present to the user for validation. AgreementMaker and AML use a more refined strategy for identifying ‘problem’ mappings to present to the user, which relies on the variance of the similarity scores of their various alignment algorithms. Additionally, AML also identifies and presents as ‘problem’ mappings those involved in cardinality or logical conflicts, as well as those that involve ontology entities declared as obsolete. Similarly, LogMap presents as candidate mappings those that cause the violation of alignment principles such as consistency, locality, and conservativity.
Concerning feedback propagation (SS.3), most systems implement at least a conflict detection mechanism, such as checking if the validated mapping contradicts previously validated mappings or results in an incoherent or inconsistent integrated ontology (AML, CogZ/Prompt, LogMap, SAMBO, RepOSE). AlViz does not implement such mechanisms and accepts user feedback without any additional steps. AgreementMaker employs a blocking propagation strategy where the user can control to how many similar mappings the validation is propagated. Re-validation is supported by AML and RepOSE as a part of the conflict resolution phase. AgreementMaker, CogZ/Prompt, COMA, RepOSE, and SAMBO employ some form of re-computation, where the user’s input is used to guide the matching process. For example, AgreementMaker propagates the user’s decision to similar mappings thus increasing/decreasing the similarity value.
As for alignment visualization aspects of the UI (UI.1), few systems support all of the seven visual information-seeking tasks (UI.1.a)—overview is usually supported by systems, whereas filter, history, and relate are rarely supported. Only AgreementMaker implements Visual Analytics (UI.1.b).
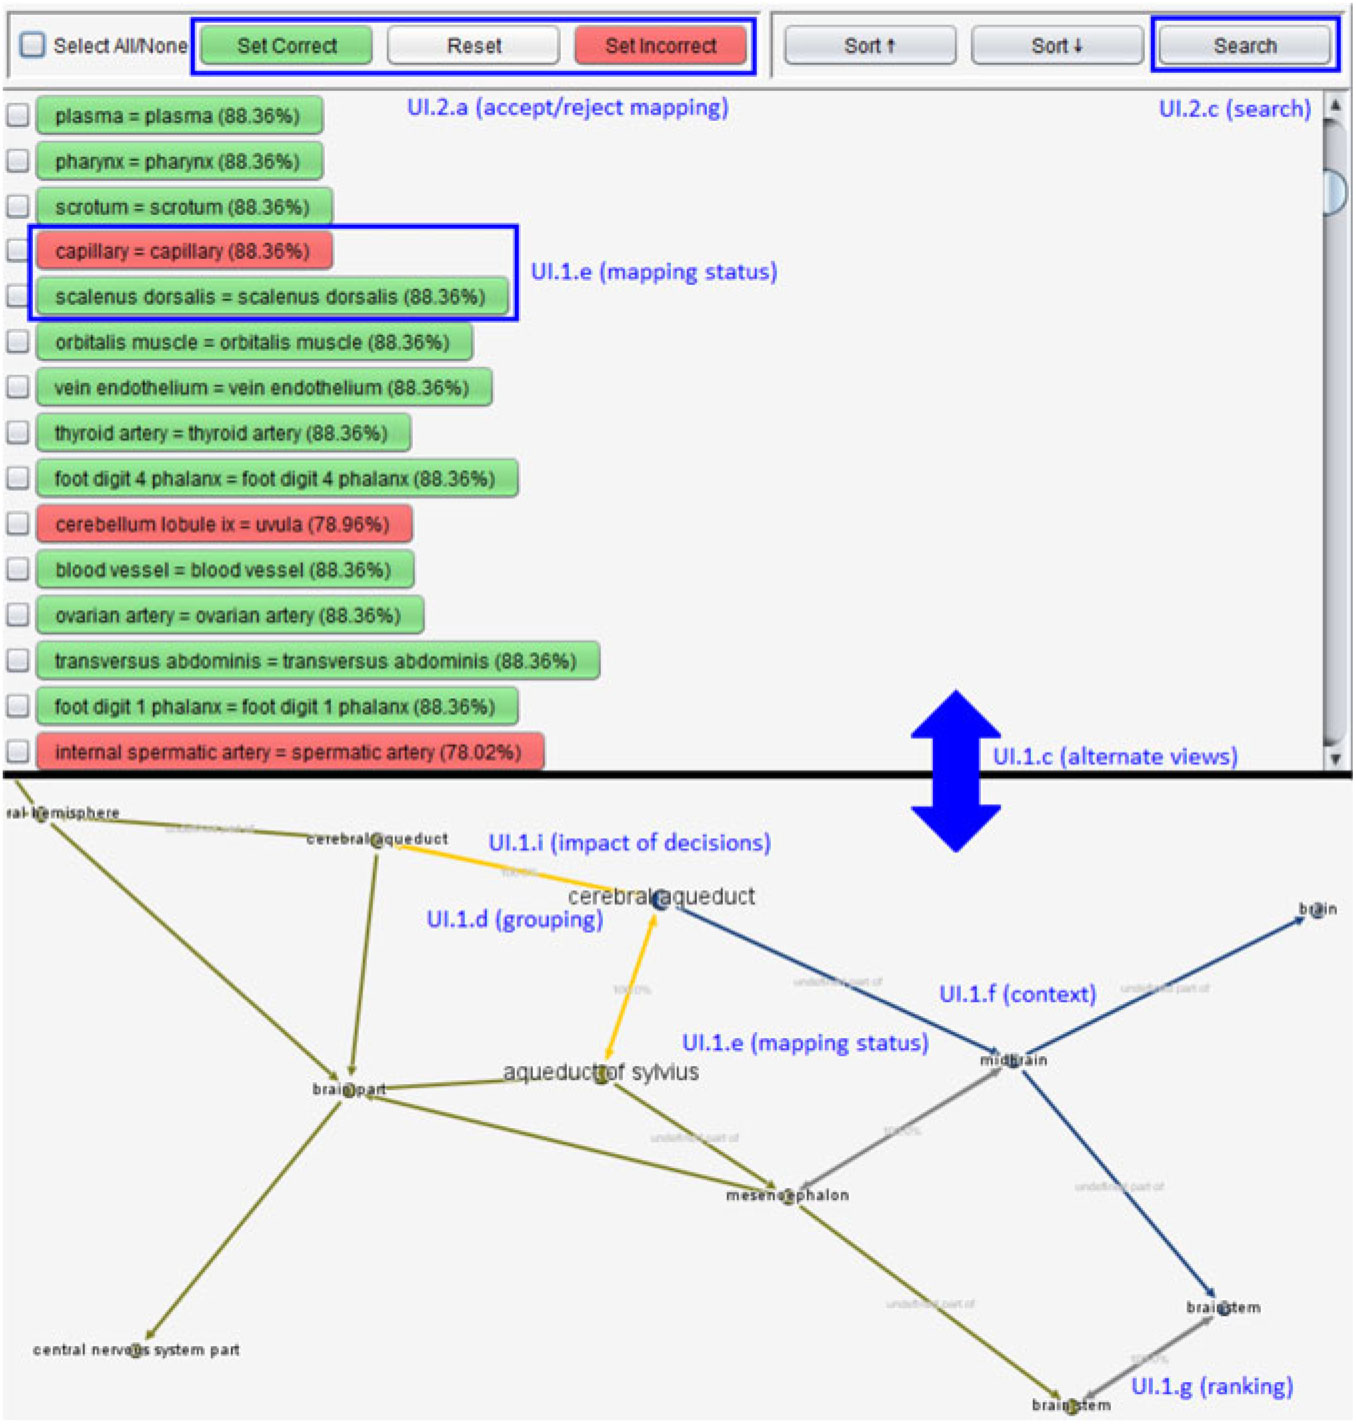
Systems typically represent ontologies as trees or graphs, with the latter typically serving as an additional representation (AlViz, CogZ) or a visual support role (AML) and rarely being a main representation (RepOSE). Mappings are typically represented as links between corresponding nodes, or sometimes as a list/table of pairs (AML, SAMBO, CogZ, COMA, LogMap) that is used to support different interactions. About half the systems support alternative views (UI.1.c) of the alignments and ontologies, often a tree and a graph view that are more suitable for different alignment tasks (Fu et al. Reference Fu, Noy and Storey(2017)), as exemplified in Figure 2. Several systems also implement an individual mapping information view, which supports many of the visualization and interaction functionalities, as exemplified in Figure 3.
Example of alternate views (list view + graph view) annotated with the alignment visualization and interaction functionalities they support (screenshot of AML). The list view displays the full alignment, colour-coded to indicate mapping status (UI.1.e) and provides functionalities to accept/reject mappings (UI.2.a) and search the alignment (UI.2.c). The graph view displays the neighbourhood of a mapping grouping-related mappings (UI.1.d), indicates mapping status through colour (UI.1.e), provides semantic context for the mapping (UI.1.f), and displays ranking information (UI.1.g) in the form of similarity scores. Finally, it provides information on the impact of decisions (UI.1.i) by displaying conflicting mappings (in orange)
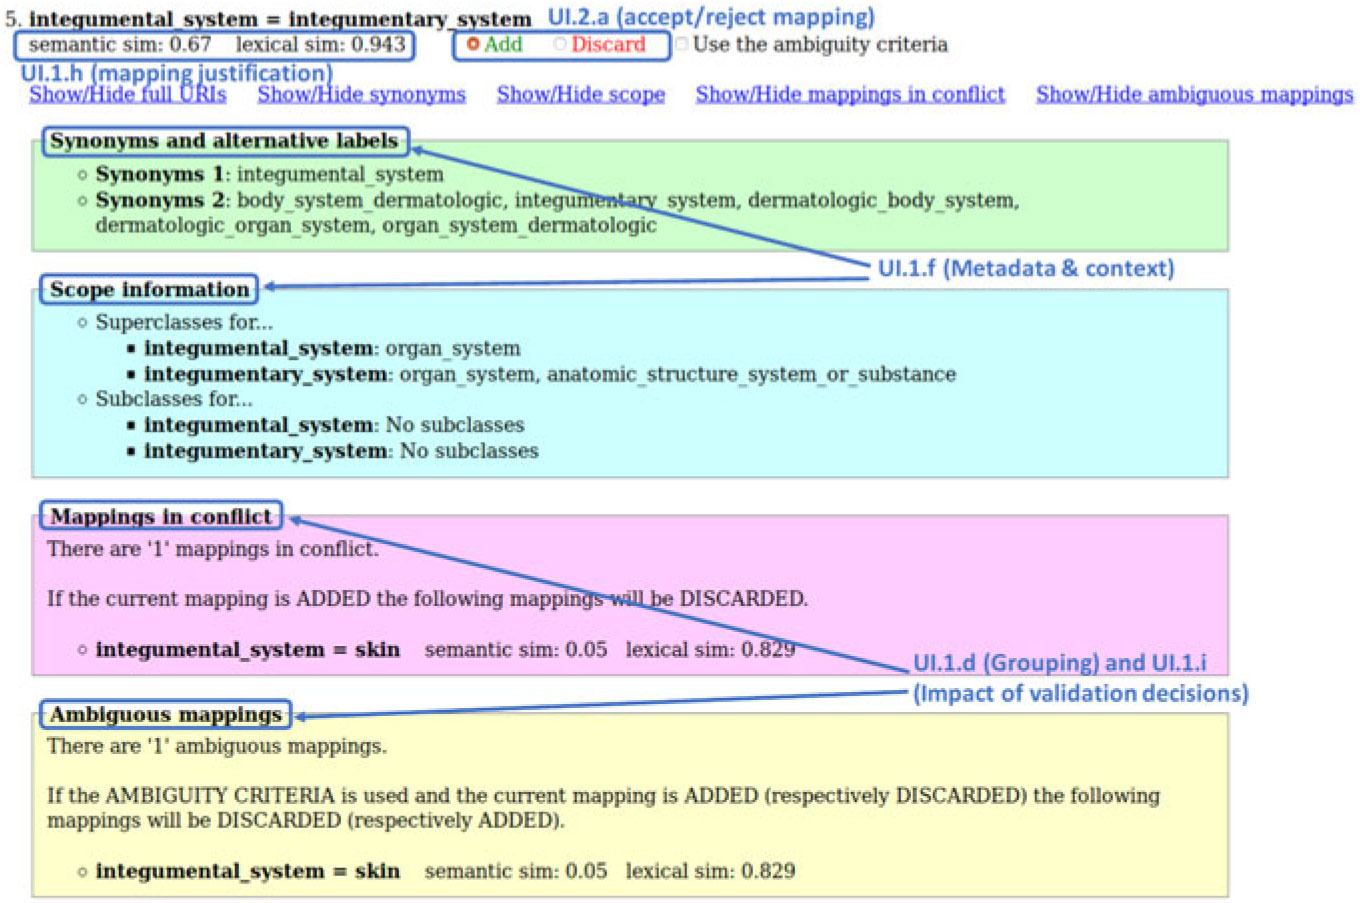
Example of a mapping information view annotated with the alignment visualization and interaction functionalities it supports (screenshot of LogMap). The view is divided into sections that provide justification for the mapping (UI.1.h), lexical metadata, and semantic context about the mapping (UI.1.f), inform the user about conflicting and ambiguous mappings, grouping them (UI.1.d) and showing the impact of validation decisions (UI.1.i). It also supports interaction to accept/reject the mapping (UI.2.a)
Most of the systems employ strategies for grouping (UI.1.d) the mappings together: SAMBO presents all mappings for a particular concept together, CogZ, AML, LogMap, and RepOSE show the local neighbourhood of a mapping up to a certain distance. AgreementMaker and AlViz combine the different views with clustering algorithms and interaction techniques to support the comparison of the similarity values calculated by the different matchers (AgreementMaker) or clustering nodes of the ontologies according to a selected relationship (AlViz).
Most systems provide information about mapping status (UI.1.e) and detailed metadata and context about the mappings (UI.1.f). However, ranking/recommendation (UI.1.g) functionalities are provided only partially by most systems, and the same is true for provenance and justification for the mappings (UI.1.h) or the impact of decisions during validation (UI.1.i). Most systems provide only a similarity value or employ colour coding as a form of explanation for the mapping, which is insufficient for users to make informed decisions (one exception is CogZ that shows a short natural language explanation for the mapping). Thus, our evaluation survey confirms the findings from (Ivanova et al. Reference Ivanova, Lambrix and Åberg(2015)) that explanations for candidate mappings are not well supported by the UIs of alignment systems and continue to be a challenge for the alignment community (Shvaiko & Euzenat (Reference Shvaiko and Euzenat2013)).
With respect to alignment interaction functionalities (UI.2), most systems allow user to accept/reject mappings (UI.2.a) and create/refine mappings (UI.2.b), but this information is not always displayed to the user—rejected mappings, for instance, are rarely shown. AlViz and COMA do not distinguish between the validated and candidate mappings, thus making it difficult for the user to keep track of already visited mappings. Search (UI.2.c) is also often supported by systems, but a previous survey of some of these systems found serious limitations in that functionality (Ivanova et al. Reference Ivanova, Lambrix and Åberg(2015)).
Only two systems (CogZ and SAMBO) allow user annotations of mappings (UI.2.d) during the validation process. By contrast, sessions (UI.2.e) are directly (COMA, LogMap, and SAMBO) or indirectly (by saving and loading files) supported by all systems. Finally, only three systems (AlViz, AML, and CogZ) allow the user to create temporary mappings (UI.2.f).
4.1.1 AgreementMaker
AgreementMaker (Cruz et al. (Reference Cruz, Sunna, Makar and Bathala2007); Cruz et al. (Reference Cruz, Antonelli and Stroe2009); Cruz et al. Reference Cruz, Stroe and Palmonari(2012)) computes an initial alignment that is then iteratively altered according to the user feedback (SS.1.d) (SS.1.e). For every mapping, the system creates a signature vector containing its similarity values calculated by different matchers. The signature vector is then used during the processes of candidate mappings selection and feedback propagation (SS.1.c) (SS.2.a) (SS.3.a). For every mapping, a disagreement metric is calculated—the disagreement is high when the similarity values computed by the different matchers are in a wide interval. The system presents the top-k mappings with the highest disagreement values for user validation. The mappings are clustered based on their vectors, and the user feedback is propagated to those with similar vectors to the vector of the mapping validated by the user applying a linear function for both accepted and rejected mappings; already validated mappings are not updated any longer and the same mapping is not shown again to the user, for example, it is not validated twice. The user can adjust the size of the feedback propagation cluster via a threshold. The approach described in Cruz et al. (Reference Cruz, Palmonari, Loprete, Stroe and Taheri2016) also discusses blocking propagation in the context of multi-user alignment. In this case, the feedback propagation can be controlled via the consensus of users for a given candidate mapping (SS.3.b). Conflict detection is not discussed.
The ontologies are visualized as trees, and their mappings are depicted as colour-coded lines representing the matcher that calculated the similarity value (the value itself is shown as a number without an explanation (UI.1.h– –)). As described in Cruz et al. (Reference Cruz, Sunna, Makar and Bathala2007), comments and additional information are shown when a concept is selected (UI.1.f) (UI.1.a). A visual analytics panel (UI.1.b) (UI.1.a) helps in comparing the similarity values calculated by the different matchers, their combination, and ‘disagreement’; it also shows the mappings in the same cluster (UI.1.c) (UI.1.d). The user can adjust the size of the cluster and visualize its members thus visualizing the impact of the validations (UI.1.i–). In the visual analytics panel, the mappings are represented with matrices (one per matcher) and are colour-coded to represent accepted, rejected, candidate, and manually created mappings (UI.1.e). The tool supports all (UI.1.a) of the seven information visualization-seeking mantra tasks with a different level of coverage: overview is supported by observing the lines representing the mappings; filtering by different criteria (UI.1.a) can reduce the number of mappings shown to the user (by threshold, by matcher, by number of mappings per concept); undo and redo (UI.1.a) are supported as described in Cruz et al. (Reference Cruz, Sunna, Makar and Bathala2007), but it is not clear if they are supported in later versions and how undoing an action would affect the propagation algorithm. During the validation process, the user can accept, reject (UI.2.a), and create mappings manually (UI.2.b) (six mappings types are supported). All mappings calculated for a particular concept are shown to the user (Li et al. Reference Li, Tang, Li and Luo(2009)). Sessions (UI.2.e–) are not directly supported but load and save operations provide indirect support.
4.1.2 AlViz
AlViz (Lanzenberger et al. (Reference Lanzenberger, Sampson, Rester, Naudet and Latour2008, Reference Lanzenberger, Sampson and Rester2010)) is a Protégé plugin that uses multiple views to visualize an alignment produced by the FOAM system (Ehrig & Sure (Reference Ehrig and Sure2005)) (UI.1.c). Thus, the user is involved after the computation of the alignment (SS.1.e). During the alignment process, each ontology is represented as a pair of views—a tree and a small world graph—that is, four in total. The views are connected by the linking and brushing paradigm where navigation in one of the views changes the representation in the other. The nodes in the ontology are clustered according to a selected relationship, also called a mutual property, and level of detail, where the sizes of the clusters depend on the number of nodes in them and the colours are determined by one out of three strategies (UI.1.d). Colour-coding shows the degree of similarity and the type of the association but explicit similarity values are not provided (UI.1.h– –).
Mappings are edited (indirectly), accepted, and rejected (UI.2.a–) in the tree views by using toolbar buttons for choosing between one out of six types of mappings, called associations (UI.2.b) (UI.1.e–). The six types are equal, syntactical, broader than, narrower than, similar, and different. There is no clear distinction between mappings and candidate mappings (UI.1.e–). Temporary decisions for questionable mappings are supported by a tracking button (UI.1.e–) (UI.2.f). A search field under the tree view is provided for each ontology (UI.2.c).
The tool supports many of the tasks from the information-seeking mantra (UI.1.a)—overview by small-world graphs, zoom in to selected level of detail, filter by mutual property, details-on-demand by tooltips and labels, history by list of activities and undo/redo buttons, and relate by different comparison strategies. Ranking and recommendations at a mapping level are not provided, but the colour-coding of the clusters can help in the identification of interesting regions and starting points (UI.1.g–). Sessions can be considered supported by save and load (UI.2.e– –).
4.1.3 AML
AML (Pesquita et al. (Reference Pesquita, Faria, Santos, Neefs and Couto2014); Faria et al. Reference Faria, Martins, Nanavaty, Oliveira, Sowkarthiga, Taheri, Pesquita, Couto and Cruz(2015)) is a lightweight ontology alignment system that focuses primarily on scalability and coherence. While its matching algorithms are fully automated, AML supports user interaction during the filtering procedure, as well as validation of the final alignment. It employs an interactive selection algorithm based on the similarity scores produced by its various matching algorithms (SS.1.c) (SS.2.a) for picking candidates for revision, also taking into account ambiguous mappings. Additionally, it employs an interactive repair algorithm that addresses conflicting mappings (SS.3.b–). AML’s UI displays two different views of the alignment (UI.1.c): a local graph view, where the user can visualize an individual mapping and its local context, including related mappings (UI.1.d); and a list view that serves as an overview and enables the user to find further details about each mapping (both structural and lexical) upon clicking (UI.1.f). Additionally, the latter also enables the user to review and reject mapping candidates (UI.2.a–) and displays information about competing and logically conflicting mappings (UI.1.i–).
AML’s menu enables the user to customize the graph view and offers the functionalities of searching the alignment for mappings (UI.2.c) and creating new mappings from five types that are equivalence, sub, super, overlap, and unknown (UI.2.b) by searching through the ontologies. While AML does not explicitly implement sessions, it does allow the user to save and load the alignment at any stage, and thus interrupt and resume their revision at will (UI.2.e–).
4.1.4 CogZ
CogZ (Falconer et al. (Reference Falconer, Noy and Storey2007); Falconer & Storey (Reference Falconer and Storey2007)) builds on PROMPT (Noy & Musen (Reference Noy and Musen2000)). It is an extension of PROMPT’s UI and uses its other components to address cognitive requirements defined in Falconer & Storey (Reference Falconer and Storey2007). The matching process is iterative (SS.1.d). The tool starts by making a list of initial candidate mappings that are then presented to the user. Based on the user’s validations, the tool will check for conflicts and proceed in building additional suggestions that are based on the user’s previous input (SS.1.b) (SS.2.b) (SS.3.a). The examples of conflicts considered by the tool are name conflicts, dangling references, redundancy in the concept hierarchy, and slot value restrictions that violate concept inheritance (Noy & Musen (Reference Noy and Musen2000)) (SS.3.b– –) (only conflict detection, tool automatically deals with the conflicts, possible re-validations are not discussed).
The ontologies in CogZ are represented as trees, and mappings are represented as dashed lines between concepts. Hovering over a mapping shows the explanation for the mapping. The explanations are short natural language texts describing the reasons why a certain mapping was selected (UI.1.h–) (confidence value not shown). Users can also explore the neighbourhoods of the terms in a candidate mapping (UI.1.d) (UI.1.f) (UI.1.i– –). The user can define manually new mappings as well as add annotations (UI.2.b) (UI.2.d). Users can mark a candidate mapping as a temporary mapping (UI.2.f) (UI.1.e). When the user is validating a mapping (UI.2.a), the tool presents mappings related to the parts of the ontology where the user is currently working on (UI.1.d). The candidate-heavy regions in this view can be identified by parts of the ontologies with large concentration of lines between them (UI.1.g– –), but no recommendations are provided at a single mapping level. In addition, the UI provides searching (UI.2.c) and filtering (UI.1.a) for both ontologies and candidate mappings. All of the tasks considered in the visual information-seeking mantra are supported (UI.1.a), and the system keeps track of the user’s previous decisions and the user can at any time inspect the candidate mappings as well as already completed validations. In this way, the user can follow his/her progress.
Falconer et al. (Reference Falconer, Noy and Storey2006) show the alternate tree-map view (UI.1.c) that provides an overview of the ontology and candidate mappings. In this view, ontologies are partitioned into parts and colour-coded depending on the number of candidate mappings. Thus, candidate-heavy regions can be identified through different colour intensities. In addition to this, this view provides a pie-chart for each branch of the ontology that contains numbers of candidate mappings, mapped concepts, and concepts without association.
The mappings can be stored and loaded from a file, thus the whole mapping process does not need to be done in one occasion (UI.2.e–).
4.1.5 COMA
COMA (Aumüller et al. (Reference Aumüller, Do, Maßmann and Rahm2005); Massmann et al. Reference Massmann, Raunich, Aumüller, Arnold and Rahm(2011)) is a system for aligning large schemas and ontologies. The system supports the fragment-based matching strategy. In this strategy, the system applies a divide-and-conquer approach where it aims at identifying similar fragments of ontologies that are then matched. The user can validate the output from each phase of this process (matching pairs of fragments), and the user’s validation will be used in subsequent computations (SS.1.a) (SS.1.b) (SS.1.c) (SS.1.d) (SS.1.e) (SS.2.b) (SS.3.a). Suggestion selection is controlled via threshold values.
The ontologies are shown as trees, and mappings are shown as lines between them; the similarity values are colour-coded in the lines’ colours (UI.1.h– –) and are shown on hover. Therefore, regions with a large number of lines represent regions with many candidate mappings (candidate-heavy regions). Under each ontology, there is a search box (UI.2.c). The tool has limited support for the information-seeking tasks with filter, history, and relate not supported (UI.1.a– –).
The system allows saving and loading generated mappings to the mapping repository (UI.2.e–). Users can reject (UI.2.a–) or manually add new mappings (UI.2.b), it supports complex mappings, not only equivalence mappings. The system does not differentiate in the interface between candidate mappings and validated mappings neither supports temporary mappings (UI.1.e– –). If a user validates a candidate mapping, it is assigned the highest confidence value.
4.1.6 LogMap
LogMap (Jiménez-Ruiz et al. (Reference Jiménez-Ruiz, Cuenca Grau, Horrocks and Berlanga2011, Reference Jiménez-Ruiz, Cuenca Grau, Zhou and Horrocks2012)) is an ontology alignment system that implements scalable reasoning and diagnosis algorithms, which minimize any logical errors introduced by the matching process. It supports user interaction during the matching process, which is essential for use cases requiring accurate mappings, and it is able to generate equivalence and subsumption mappings.
LogMap presents to the user only the mappings that are not ‘clear cut’ cases (SS.1.e) (SS.2.a), for which user feedback would be highly beneficial. The number of such mappings can still be significant; hence, it is crucial to reduce the number of questions to the human expert by applying automatic decisions based on users’ feedback. Automatic decisions based on a particular user decision to accept or reject a mapping (UI.2.a) are made according to two criteria: ambiguity and conflictness. That is, additional mappings will be (automatically) rejected/accepted if they were in conflict (i.e., lead to an unsatisfiable concept) or ambiguous (i.e., share the source or target entity) with the user (SS.3.b– –).
Each candidate mapping is presented to the user with a confidence value (UI.1.h–), information about the context/scope of the matched entities (i.e., superconcepts and sub-concepts), and lexical information such as synonyms (UI.1.f). In addition, the ambiguous mappings and mappings in conflict are also presented in order to help the user understand the consequences of the feedback (UI.1.d–, UI.1.i–). The user can validate the mappings in one or several sessions (UI.2.e) or end the interactive process at any time (the remaining cases are decided heuristically). Finally, LogMap ranks mappings (UI.1.g–) according to their impact on other mappings (i.e., mappings that have other mappings in conflict are shown first).
4.1.7 RepOSE
RepOSE (Ivanova & Lambrix (Reference Ivanova and Lambrix2013)) is based on an integrated taxonomyFootnote 4 alignment and debugging framework. The system can be seen as an ontology alignment system with a debugging component for detecting and repairing modelling defects (missing and wrong subsumption relations/mappings) in taxonomy networks (both in the alignments and ontologies). The alignment process goes through three phases—generation of candidate mappings, validation, and repairing (SS.1.d) (SS.1.e). Selection of mappings suggestions is only controlled by threshold values for different matchers (SS.2.b). During the repairing step for every accepted mapping, the user is given possibility to add a mapping that would make the accepted mapping derivable. A limited form of re-computation as user feedback is used in the repairing process (SS.3.a) (SS.1.d) (SS.1.e). The system checks for contradictions after each group of suggestions is validated and after a repairing action and does not allow the current action to take place if such are found (SS.3.b–).
During the validation phase, the candidate mappings are shown as graphs in groups where the last group in the list contains the most suggestions (UI.1.g) (UI.1.d), thus the user can choose the area to start with. The nodes are colour-coded according to their hosting ontology and the edges according to the state of the represented mappings—candidate mappings and added/rejected mappings (UI.1.e–), (temporary mappings are not supported). The justifications of the mappings inferred from the taxonomy network are presented to the user as graphs, for the rest a tooltip that appears when the user hovers on an edge shows the similarity value calculated by the (combination of) matchers (UI.1.f–) (UI.1.h– –) (only derivation path, no information on why the mapping was selected). If the current user action contradicts with previous actions, an error message is shown to the user (UI.1.i–). Users can accept/reject mappings (UI.2.a). During the validation and repairing processes, recommendations based on external knowledge are provided (UI.1.g) for every mapping. Creating arbitrary mappings is not possible, but some flexibility is provided during the repairing phase where the user can create a mapping that entails the accepted mapping (mappings can be refined in the repairing phase (UI.2.b–)). The system supports equivalence and subsumption mappings. Sessions are indirectly supported (users can save/load mappings (UI.2.e–)). Some overview and details-on-demand (regarding mappings) tasks are supported (UI.1.a– –).
4.1.8 SAMBO
SAMBO (Lambrix & Tan (Reference Lambrix and Tan2006); Lambrix & Kaliyaperumal (Reference Lambrix and Kaliyaperumal2017)) is a session-based (UI.2.e) ontology alignment system. The sessions are in the form of interruptible computation sessions. Users can thus begin the validation process even before the completion of the computation. In addition, users can specify points of interruptions, for example, by specifying the number of concept pairs that need to be processed before the interrupt and the validation process. The system is iterative, and computation sessions can reuse the results from previous validations (SS.1.a) (SS.1.d) (SS.1.e) (SS.3.a). The validation decisions are also used in the recommendation of settings for the alignment algorithms (Tan & Lambrix (Reference Tan and Lambrix2007)). A partial alignment can be used to reduce the search space (Lambrix & Liu (Reference Lambrix and Liu2009)) (SS.1.a) (SS.1.d) (SS.1.e). Selection of mapping suggestions is controlled via different combination and filtering strategies using the similarity values for different matchers (SS.2.b). It is possible to include the reasoner to check the consistency of the validated candidate mappings. If conflicts are found, they will be reported to the user (supports only checks for problems within the logic in ontologies, users are asked to re-validate (SS.3.b– –)).
The UI is implemented in the form of tabs where each tab is related to one part of the alignment process. The system groups together related candidate mappings (UI.1.d). Related mappings are those that share the same terms. For every candidate mapping, the user can select to either reject it or accept it as either a subsumption relation or equivalence relation (UI.2.a). The system also allows manual creation of mappings (UI.2.b) as well as annotation of decisions (UI.2.d), showing the annotation is, however, not easy (UI.1.f– –). In the manual mode (UI.1.c), the user is presented with a tree view of the ontologies and needs to select one concept from each tree and the relation between them in order to create a mapping manually (UI.1.e–), and temporary mappings are not supported. In this view, the user can also search the ontologies (UI.2.c).
From the seven information-seeking tasks, only the history task is well supported (UI.1.a– –)—the system logs all user decisions and enables their review, and it includes an undo button as well. The user can also review remaining candidate mappings that need to be dealt with. Relate and details-on-demand are indirectly supported by grouping mappings for a single concept together in the list view.
4.2 Experiments
These experiments aim at assessing the impact of user validation and user errors to the performance of ontology alignment systems in an interactive setting. They were conducted in the scope of the Interactive Matching track of the OAEI from 2015 to 2018, and the results we show are a compilation of those results across the years, though we elaborate on the discussion made in the OAEI.
4.2.1 Set-up
The OAEI evaluation relies on the SEALS client, developed in the Semantic Evaluation At Large Scale projectFootnote 5. This client was modified in 2013 for the Interactive Matching track to allow systems to pose questions regarding the correctness of a mapping to the Oracle, which simulates a user by checking the reference alignment from that task. This process is fully automated, happening during the runtime of the system, and only systems that implement Oracle calls can be evaluated in this manner. The decision of when to stop the user interactions lies solely with the matching system. The Oracle will reply to any and all questions the system asks, but will also record and tally them all, to use as an evaluation criterion.
In 2015, we modified the Oracle to randomly generate erroneous replies, with a uniform distribution of fixed probability (or error rate), set by the OAEI organizer. In this experiment, the error rates considered were 0% (perfect Oracle, denoted by Or0), 10% (Or10), 20% (Or20), and 30% (Or30). While uniformly distributed random errors are not realistic—some mappings are expected to be more challenging to users than others—they serve our purpose of assessing how errors affect the performance of matching systems in an interactive scenario. Furthermore, the Oracle is implemented with a ‘fixed mind’, meaning that after it replies to a query from the system, it will always give the same reply for the same query. This prevents systems from asking repeated questions to compensate for the error rate, which, while not an unrealistic premise, would hamper our analysis of the effect of errors on the performance of the systems.
In 2016, we further modified the Oracle to enable it to reply to queries about a set of up to three related mappings rather than to only queries about individual mappings. If a query contains a set of no more than three competing mappings, then the Oracle counts this as a single interaction and returns the subset of correct mappings from the original set (under the given error rate). An example of a set of three competing mappings is: Muscle ≡ Muscle, Muscle ≡ Muscle Tissue, Striated Muscle Tissue ≡ Muscle Tissue. Formally, we can say that a set of mappings is competing if, for each mapping in the set, there exists another mapping that shares either its source or target entities. The rationale behind counting a small set of competing mappings as a single interaction is that it simulates a grouping scenario where the user is able to choose between related mappings with no more effort than it would take to revise an individual mapping (potentially less, since grouping makes more information available to the user which he might otherwise have to search in order to decide on any of the mappings in the group).
4.2.2 Data sets
The experiments were carried out on data sets from the OAEI. The Conference and Anatomy data sets were used in 2015–2018, the LargeBio (Large Biomedical Ontologies) data set was used in 2015–2016, and the (Disease &) Phenotype data set was used in 2016.
The Conference data set for the Interactive track comprises 7 small ontologies and 21 reference alignments between pairs of ontologies in the domain of conference organization. The Anatomy data set contains two medium-sized ontologies, the Adult Mouse Anatomy (2744 concepts), which is a part of the Gene Expression DatabaseFootnote 6 and a small fragment (3304 concepts) of the National Cancer Institute (NCI) ThesaurusFootnote 7 describing the human anatomy, and a reference alignment. LargeBio uses three large ontologies, the Foundational Model of AnatomyFootnote 8, SNOMED CT, and NCI, which contain 78,989, 306,591, and 66,724 concepts, respectively. There are different tasks for aligning the whole ontologies or fragments of the ontologies. The Phenotype data set has two tasks: aligning the Human Phenotype Ontology to the Mammalian Phenotype Ontology, and aligning the Human Disease Ontology to the Orphanet and Rare Diseases Ontology.
4.2.3 Evaluation parameters and configurations
Due to the several factors to take under consideration in these experiments (e.g., the number of queries, the number and type of erroneous replies), our evaluation includes an unusually high number of evaluation parameters, which are listed in Table 3.
Interactive matching evaluation parameters.
Regarding the effectiveness and efficiency of the alignment systems, we compute the size (number of mappings) of the alignments produced, the traditional parameters precision, recall, and F-measure, measured against the respective OAEI reference alignment, and finally, the run time of the system. These are the standard evaluation parameters in all OAEI tracks, so we can compare the interactive performance of the systems with their non-interactive performance in order to gauge the impact of user validation.
Regarding the user interactions of the system, we measure total requests and distinct mappings. The former is the number of distinct queries (of up to three conflicting mappings) the system asks the Oracle, representing the expected user workload in the validation process (so more requests means the system requires more work from the user). The latter is the total number of distinct mappings for which the Oracle gave feedback to the user (regardless of whether they were submitted simultaneously, or separately). The latter should be compared with the former to assess whether the system is harnessing a grouping strategy to reduce user workload (total requests < distinct mappings), or if on the contrary it is asking redundant questions (total requests > distinct mappings). Furthermore, we also measure the numbers of true positives, true negatives, false positives, and false negatives in the queried mappings, to get a more detailed picture about the status of the mappings the system tends to ask about (mostly correct, mostly incorrect, or a balanced mix) and whether the distribution of errors from the Oracle was balanced as well. With regard to these four parameters, it is their relative distribution rather than their absolute number that is of relevance. Although these are not used as evaluation parameters, we use the terms ‘question with negative answer’ and ‘question with positive answer’ to refer to validation requests for which the Oracle answers that the candidate mapping is false or true, respectively. Also pertaining to user interaction, we compute the time between requests, reflecting the expected user waiting times, and display the distribution of such times during the system run.
Regarding user expertise, we compute the Oracle positive precision and Oracle negative precision, which measure, respectively, the fraction of positive and negative answers given by the Oracle that are correct. They are computed directly from the counts of true and false positives, and true and false negatives, respectively. These two parameters give us a deeper insight into how the lack of user expertise (given by the error rate) affects the system depending on the bias of the system’s interactive algorithm towards negative or positive mappings.
Regarding the robustness of the systems, or how they are impacted by user errors, we compute the parameters precision for Oracle, recall for Oracle, and F-measure for Oracle, which are the same as the traditional parameters, but computed against the OAEI reference alignment modified by the Oracle’s errors. These parameters are expected to be constant across error rates if the system is linearly affected by the errors (i.e., only the errors produced by the Oracle change), or to decrease with the error rate if the system is affected supralinearly (i.e., there is error propagation). They can instead increase with the error if the system is able to detect and compensate for the higher error rate somehow and also when the errors cause the system to make more validation requests (even if the answer is erroneous, it will be correct according to the Oracle).
The evaluations of the Conference and Anatomy data sets were run on a server with 3.46 GHz (6 cores) and 8GB RAM allocated to the alignment systems. In 2015, each system was run three times. From 2016 to 2018, each system was run 10 times. The final result for a measure for a system and an error rate represents the average of the multiples runs. For the Conference data set with the ra1 alignment, the relative parameters (precision, recall, etc.) were macro-averaged across the various ontology pairs, whereas the absolute parameters (size, total requests, etc.) were summed across all pairs. Then, the parameters were averaged over the multiple runs.
The Phenotype (2016) and LargeBio (2015–2016) evaluations were run only once (due to their larger size) on a Ubuntu Laptop with an Intel Core i7-4600U CPU @ 2.10GHz x 4 and allocating 15GB of RAM.
4.2.4 Systems and techniques
This evaluation comprises only systems that participated in the OAEI 2015–2018 Interactive track, as it can only be carried out on systems configured to use the SEALS client and make use of the Oracle, which is not true of most of the systems we assessed functionally in Section 4.1. Furthermore, OAEI rules do not require systems to have a UI, and many do not, and thus could not be covered in Section 4.1. Thus, the overlap between the two sections is small, with only AML (Faria et al. Reference Faria, Martins, Nanavaty, Oliveira, Sowkarthiga, Taheri, Pesquita, Couto and Cruz(2015)) and LogMap (Jiménez-Ruiz et al. Reference Jiménez-Ruiz, Cuenca Grau, Zhou and Horrocks(2012)) being included in both. Note also that the versions of these two systems evaluated in this section are the SEALS version they submitted to the OAEI, which may differ from the stand-alone UI versions we assessed in Section 4.1.
AML (Faria et al. Reference Faria, Martins, Nanavaty, Oliveira, Sowkarthiga, Taheri, Pesquita, Couto and Cruz(2015)) and LogMap (Jiménez-Ruiz et al. Reference Jiménez-Ruiz, Cuenca Grau, Zhou and Horrocks(2012)) have participated continuously in the Interactive track since 2015, JarvisOM Footnote 9 and ServOMBI (Kheder & Diallo (Reference Kheder and Diallo2015)) participated in 2015, and ALIN (da Silva et al. Reference da Silva, Revoredo and Baiao(2018a)) and XMap (Djeddi et al. Reference Djeddi, Ben Yahia and Khadir(2018)) participated in 2016–2018.
Not all systems produced results for all data sets: ServOMBI and ALIN delivered partial results for the full LargeBio data set in 2015 and 2016, respectively, while JarvisOM did not deliver any results for the full LargeBio data set in 2015. Furthermore, XMap and ALIN did not complete all tasks in the Phenotype data set in 2016.
Apart from JarvisOM, which involves the user during the matching stage, the systems all make use of user interactions exclusively in the filtering stage. Both LogMap and AML request feedback on selected candidate mappings and filter candidate mappings based on the user validations. LogMap interacts with the user to decide on candidate mappings that are not clear-cut cases. AML uses patterns in the similarity values produced by its various matching algorithms to detect suspicious mappings and employs a query limit and other strategies to minimize user interactions. ServOMBI asks the user to validate all of its candidate mappings and uses the validations and a stable marriage algorithm to decide on the final alignment. ALIN uses the feedback from the user regarding accepted candidate mappings to add new candidate mappings and to remove candidate mappings that are covered by an anti-pattern related to the accepted candidate mappings. XMap uses various similarity measures to generate candidate mappings and applies two thresholds to filter the candidate mappings: one for the mappings that are directly added to the final alignment and another for those that are presented to the user for validation. The validation requests are mainly about incorrect mappings. JarvisOM is based on an active learning strategy known as query-by-committee: at every iteration JarvisOM asks the user for pairs of entities that have the highest disagreement between committee members and lower average euclidean distance, and at the last iteration, the classifiers committee is used to generate the alignment.
4.2.5 Results
The lessons learned from the OAEI Interactive Matching track are shared across the different data sets and different years, so for the sake of clarity and brevity we only present the results for the Anatomy data set for 2015 and 2018. These cover all participating systems from the 2015–2018 interval and are usually representative of the overall performance of the systems. Where there are notable differences between data sets, we discuss them in the text. The full results can be found at the OAEI Interactive track results web pages.Footnote 10
The evaluation results for the Interactive Anatomy data set from 2015 and 2018 are shown across Tables 4, 5, and 6 and in Figure 4. Table 4 shows the standard evaluation parameters of the systems in the non-interactive setting and in the interactive setting with varying error rates (perfect Oracle – Or0, 10% error – Or10, 20% error – Or20, and 30% error – Or30). Table 5 shows the evaluation parameters pertaining to user interactions and user expertise across all error rates, except for the time between queries, which is shown in the boxplot form in Figure 4. Table 6 shows the evaluation parameters for assessing the system robustness/impact of errors.
Impact of user validation and user errors on the effectiveness and efficiency of alignment systems, assessed in the Interactive Anatomy data set.
Note: The best values among systems in each setting are highlighted in bold, blue is used to indicate cases where interactive performance was better than non-interactive performance and red is used for the opposite case.
User interactions of the matching systems and user expertise, assessed in the Interactive Anatomy data set, with varying error rates.
Assessment of the robustness to errors of matching systems in the Interactive Anatomy.
Note: Blue is used to indicate cases where the performance of the system is substantially better with error than without (difference > 0.002), and red is used for the case where it is substantially worse.
AML improves more in terms of recall than precision with user interactions. It exploits them in part to test mappings with lower similarity scores than the ones it accepts in the non-interactive mode, which is why it asks more questions with negative answers from the Oracle than questions with positive answers. As a result, when the error rate increases, AML’s precision drops below the non-interactive precision (at20% in 2018), but its recall remains higher than the non-interactive recall. However, for the Conference LargeBio and Phenotype data sets, the improvement in precision and recall is similar, and for LargeBio and one of the Phenotype data sets, the number of questions with negative answers is about the same as the number of questions with positive answers. These differences to Anatomy may be partially explained by the fact that in the non-interactive mode, the precision of AML in Anatomy is already quite high. AML is affected linearly by the errors, as evidenced by the fact that its performance as measured against the Oracle (Table 6) remains almost constant at all error rates. This means that AML does not extrapolate from the user feedback about a mapping to decide on the classification of multiple mapping candidates. While extrapolation (be it through active learning, feedback propagation, or other techniques) is an effective strategy for reducing user demand, it also implies that the system will be more heavily impacted by user errors (e.g., Cruz et al. Reference Cruz, Palmonari, Loprete, Stroe and Taheri(2016)).
LogMap improves only with regard to precision with user interactions. In 2015–2016, it was the most balanced system regarding positive versus negative Oracle answers. This means that, in this particular task during 2015–2016, the questions with positive answers that LogMap asked the Oracle all correspond to mappings it would also accept in its non-interactive setting, whereas the ones with negative answers allow it to exclude some mappings that it would also (erroneously) accept. Due to the balance between its questions in 2015–2016, when presented with user errors, LogMap was affected with regard to both precision and recall in approximately equal measure. However, since its precision increased substantially with user interactions, it remains higher than the non-interactive precision at all error rates, unlike the recall. In 2017–2018, LogMap asks a similar amount of questions with positive answers, but circa 3 times as many questions with negative answers than earlier, which leads to a slightly lower precision. For the Conference data set and one of the Phenotype data sets, the system asks more questions with negative answers, while for LargeBio it asks more questions with positive answers and also obtains a small improvement in recall.
Another interesting observation about LogMap is that in 2015–2016, the number of requests it made increased slightly but steadily with the error rate, whereas other systems show stable rates or a lower amount of requests. This is also true, but to a lower extent for AML. Both systems employ logical repair techniques, and this increase can be tied to the fact that user errors can lead to more complex decisions when interaction is used in filtering steps and inferences are drawn from the user feedback. For instance, during alignment repair, if the user indicates that a mapping that would be removed by the system to solve a conflict is correct, the system may have to ask the user about one or more alternative mappings to solve that conflict, thus increasing the number of requests. In this context, the query-based evaluation of 2015 did not accurately reflect an interface-based alignment validation, where the user could be shown all the mappings that cause a conflict simultaneously. In 2016–2018, systems could present sets of competing mappings to the Oracle for a concerted decision, and in 2017–2018, LogMap took advantage of this evolution. It now makes a constant number of requests (388) that cover more than 1000 mappings.
JarvisOM is the system that most depends on user interactions, as evidenced by the poor quality of its non-interactive alignment. Thus, it is the system that most improves with user interactions, and the only one that improves substantially in both precision and recall. It is also the one that makes the least requests to the Oracle—only seven to eight requests per alignment—as it uses these requests in an active learning approach rather than to validate a final alignment. This means it is the system that extrapolates the most from the user feedback, which, as expected, makes it the one that is most affected by user errors—its F-measure drops by 26 percentage points from the perfect Oracle to the one with a 30% error rate. However, it depends so heavily on user interaction that even at 30% errors, its results are still better than the non-interactive ones. JarvisOM is also the system where the impact of the errors most deviates from linearity, precisely because it extrapolates from so few mappings. Another curious consequence of this is that its alignment size fluctuates considerably, increasing to almost double between the perfect Oracle and the one with a 20% Oracle error rate, but then decreasing again at 30% Oracle error rate. JarvisOM behaves very differently in the Conference track, showing a linear impact of the errors, as in that case less inferences are drawn from its 7–8 Oracle requests because they represent circa 50% of the Conference alignments (whereas in Anatomy they represent 0.5%).
Time intervals between requests to the user/Oracle for the Anatomy data set in 2015 (top 4 plots) and in 2018 (bottom 4 plots). Whiskers: Q1-1,5IQR, Q3+1,5IQR, IQR=Q3-Q1. The labels under the system names show the average number of requests and the mean time between the requests
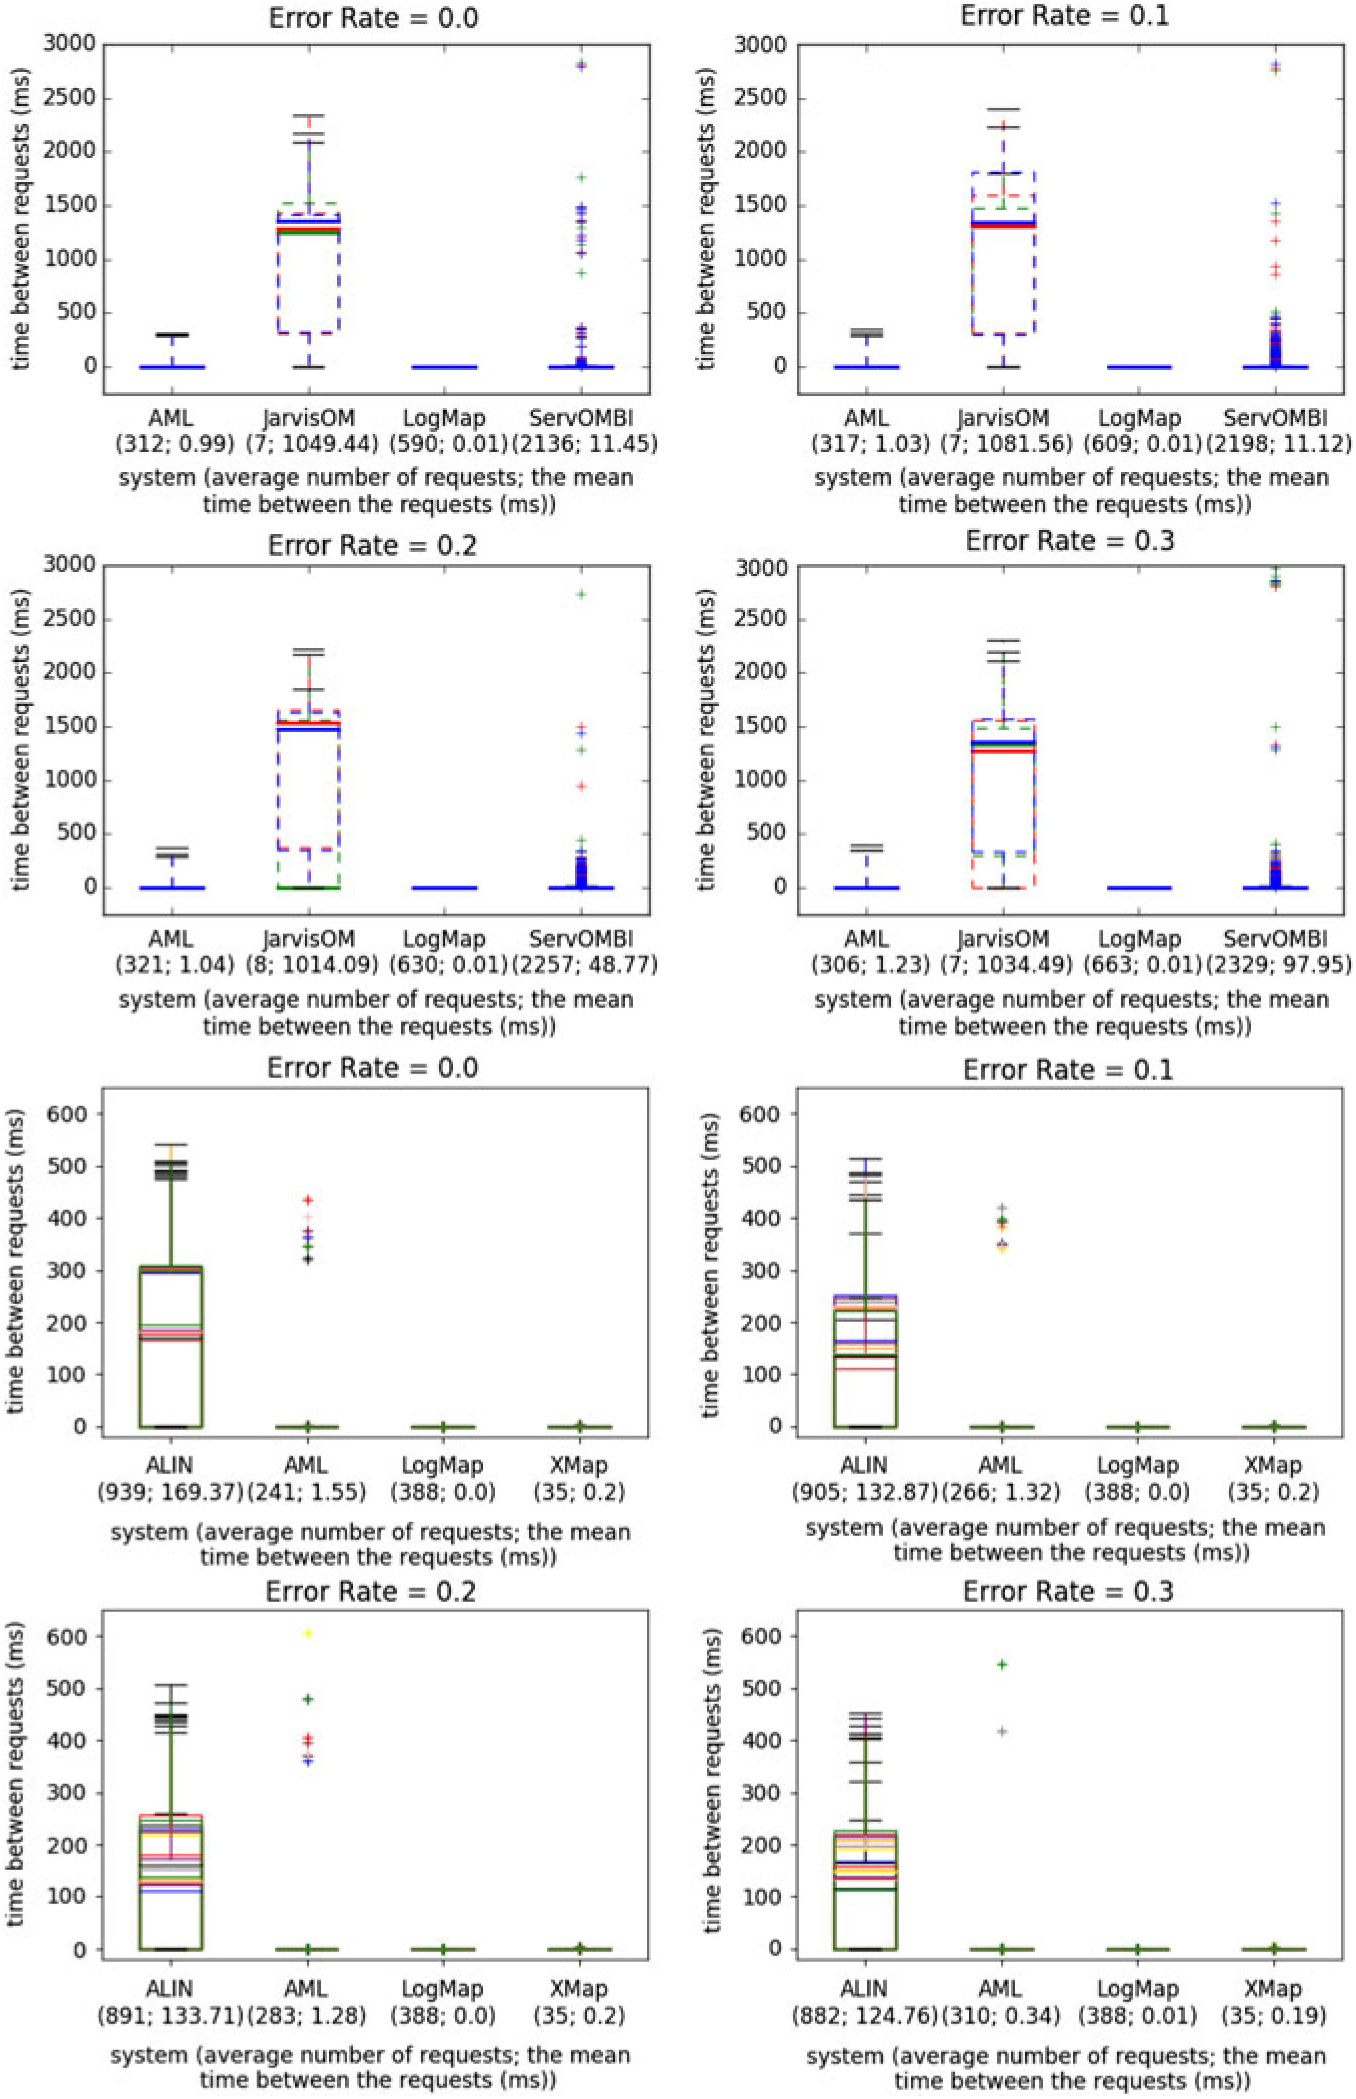
ServOMBI is the system that improves the least with user interaction in the Anatomy track, showing an increase of only 1 percentage point in F-measure, and improves only with regard to precision. In the Conference data set, there is a large improvement of 44 percentage points in precision and a 6 percentage points improvement in recall. It is also the system that makes the most Oracle requests, as it asks the Oracle about every candidate mapping it finds, and the only system that makes redundant questions (its total number of requests is almost double that of the distinct ones). Interestingly, it is also the only system that produces alignments that do not contain all the mappings identified as correct by the Oracle, as some are apparently discarded by its stable marriage algorithm. Because it makes so many Oracle requests, ServOMBI is strongly affected by Oracle errors, so much so that at only 10% Oracle error rate, the interaction is no longer beneficial in terms of F-measure. In fact, since 85% of the questions ServOMBI asks the Oracle have positive answers, the system would have a better performance (72% F-measure) by simply accepting all its mapping candidates than it does at 10% error rate. Because of its strong bias towards questions with positive answers, ServOMBI feels the impact of the errors mostly in terms of recall and alignment size, whereas precision is hardly affected. However, given the number of false positives returned by the Oracle at 30% error rate, we would expect a drop in precision as well, but it remains almost constant as the errors increase. This attests to the ability of this system’s stable marriage algorithm to filter out user errors. (For the Conference data set, the interaction is no longer beneficial in terms of F-measure at a 30% Oracle error rate, and the number of questions with positive answers is similar to the number of questions with negative answers.) Interestingly, the number of total Oracle requests made by ServOMBI increased with the Oracle error rate, even though the number of distinct requests remains constant—as it should, considering the system already asks the Oracle about all candidate mappings it identifies. This means that ServOMBI is making more redundant questions, which, given our experimental setting where the Oracle always gives the same answer to questions it replied previously, serves no purpose.
ALIN has in two of its three participations a higher precision for the non-interactive version of the system than for the interactive version. The recall and F-measure, however, are highly improved by using the interactive version of the system. For the Conference data set, the precision for the interactive version is higher than for the non-interactive version. Both precision and recall decrease with growing Oracle error rates. When comparing with the reference alignment modified by the Oracle, the precision remains constant with growing error rates. In contrast to other systems, for ALIN, the number of requests to the Oracle decreases when the error rate grows higher. Furthermore, ALIN was the first system to take advantage of the ‘multiple competing mappings’ feature in 2016, which allows it to use a single interaction to cover more than two mappings on average.
XMap did not improve (2016) or improved very slightly the quality of its suggested alignment compared with the non-interactive version of the system. The Oracle’s error rates do not influence precision and recall (and thus F-measure), although they do influence very slightly the recall and F-measure with respect to the reference alignment modified by the Oracle. For LargeBio, there is also a slight influence on precision. This may be because XMap asks few questions (35 in each OAEI participation), and these questions have mainly negative answers for which the Oracle has high precision.
4.2.6 Discussion
The effect of user interactions on the performance of alignment systems is clear, as the F-measure of all evaluated systems improves when they have access to a perfect Oracle (Or0) in comparison with their non-interactive performance. The precision and recall of all systems are also at least as high with a perfect Oracle as with no Oracle, as some systems improve mainly in precision and others improve mainly in recall. When we increase the Oracle’s error rate, we observe that the F-measure of all systems deteriorates, as expected. However, in many cases, even at relatively high Oracle error rates, some systems still have higher F-measures than in the non-interactive mode, which corroborates the observations in Jiménez-Ruiz et al. (Reference Jiménez-Ruiz, Cuenca Grau, Zhou and Horrocks2012). The rate at which user errors become net negative for an alignment system naturally depends on how much the system relies on user input but also on how good the non-interactive performance of the system is. Errors become net negative for AML at a lower error rate than other systems (20%) because it has a very high non-interactive F-measure, so even a few errors are very detrimental. They become net negative for LogMap at a rate of 30%, while they are still positive for XMap, despite the similar F-measure of the two systems, due to the huge differences in number of queries between them. They are also still positive for ALIN and JarvisOM at 30% because the non-interactive performance of these systems was relatively low. As ServOMBI employs the user to validate all its candidate mappings, there are much more user requests than for the other systems, and in being the system most dependent on the user, is also the one most affected by user errors.
The way in which the systems exploit user interactions, how they benefit from them, and how they are affected by errors are very different. In some cases, erroneous answers from the Oracle had the highest impact on the recall, in other cases on the precision, and in others still both measures were significantly affected. The impact of the errors was linear in some systems and supralinear in others. A supralinear impact of the errors indicates that the system is making inferences from the user and thus deciding on the classification of multiple candidate mappings based on user feedback about only one. This is an effective strategy for reducing the workload of the user but leaves the alignment system more susceptible to user errors.
Regarding the number of user requests, for system versions not using the mapping grouping functionality in their Oracle queries, we note that ServOMBI, LogMap, and AML generally increase the number of requests they make as the error rate increases, whereas XMap and JarvisOM keep their number approximately constant. For system versions using the mapping grouping functionality, ALIN decreases the number of requests when the error rate grows higher, while the number of LogMap requests remains constant. An increase can occur when interaction is used in filtering steps, and inferences are drawn from the user feedback (such as during alignment repair) as it may lead to an increased number of subsequent requests. JarvisOM is not affected by this because it uses interaction during matching and makes a fixed seven to eight requests per matching task. In each OAEI participation, XMap asked 35 questions. AML prevents raising the number of requests too much by employing a maximum query limit and stringent stopping criteria. When the Oracle has given a positive answer to a request in ALIN, the system asks questions about related concepts. Therefore, when the Oracle error rate grows and more correct candidate mappings are answered wrongly by the Oracle, fewer questions will be asked.
Most systems ask more questions with negative answers than questions with positive answers, which leads to a typically higher Oracle negative precision than positive precision (as, given a fixed error rate, there will be more false positives than false negatives). LogMap from 2015 and JarvisOM are more balanced in their questions, whereas ServOMBI is the only system that asks more questions with positive answers and as a result has a higher Oracle positive precision than negative precision.
Regarding system response times, two models are frequently used in the literature (Dabrowski & Munson (Reference Dabrowski and Munson2011)). The Shneiderman model takes a task-centred view and uses four categories according to task complexity: typing, mouse movement (50–150 ms), simple frequent tasks (1 s), common tasks (2–4 s), and complex tasks (8–12 s). It is suggested that the user is more tolerable to delays with the growing complexity of the task at hand. Unfortunately, no clear definition is given for how to define the task complexity. The Seow model looks at the problem from a user-centred perspective by considering the user expectations towards the execution of a task. The categories are instantaneous (100–200 ms), immediate (0.5–1 s), continuous (2–5 s), and captive (7–10 s). Ontology alignment is a cognitively demanding task and can fall into the third or fourth categories in both models. In this regard, the response times (in our paper, the time between requests) observed with the Anatomy data set (with the exception of several measurements for ServOMBI) fall into the tolerable and acceptable response times in both models. The same applies for the average times between requests for the tasks in the LargeBio data set. For the Conference data set, these are lower (with the exception of ServOMBI) than those discussed for the Anatomy data set. However, very low system response times may not always be needed as the user needs sufficient time for the validation of candidate mappings.
5 Conclusions
In this broad study of user validation in ontology alignment, we encompassed three distinct but inter-related aspects: the profile of the user, the ontology alignment systems’ services, and their UIs. We functionally assessed the services and UIs of state-of-the-art systems and carried out experiments to investigate the impact of errors in alignment validation within the scope of the OAEI.
Despite the advances in automated ontology alignment techniques, it is clear that user validation remains critical to ensure alignment quality, due to the complexity and diversity of ontologies and their domains. This is evidenced by the fact that over 90% of the users of ontology matching systems we surveyed stated that their use cases required manual validation, and also by the development effort of ontology alignment systems towards supporting user validations through services and UIs.
While there have been significant advances on the part of alignment systems in this regard, there are still key challenges to overcome in user validation of ontology alignments and aspects that merit further improvement:
Reducing user workload is key in such a time-consuming and laborious process. As our experiments demonstrate, systems tend to make an inordinate number of validation requests in relation to their improvement in performance with user interaction, and there are several strategies systems could adopt to reduce these requests:
– Prioritizing mapping candidates that are non-trivial and/or those which cause conflicts, and presenting mainly these to the user is something systems can clearly improve at.
– Grouping competing mappings and asking the user to choose between them is an effective strategy that several systems already employ (both in the experiments and in our functional assessment) but which should be balanced with the previous strategy, rather than exploited to ask the user to validate almost the whole alignment (as systems do in the experiments).
– Exploiting feedback propagation techniques in order to extrapolate user validations to mappings with similar features than those they revised is an effective strategy for reducing user workload, as demonstrated by JarvisOM in our experiments, but it is currently underexploited by alignment systems.
– Supporting manual annotations of mappings and validation over multiple sessions are both essential to enable users to interrupt and resume the validation task according to their availability. However, they are aspects where most alignment systems have room for improvement.
Balancing informativeness with cognitive load is extremely challenging, as systems have to provide rich contextual information to enable the user to decide on each mapping, while avoiding overwhelming the users with too much information, as humans have limited working memory. Some systems already do a reasonable job at this, by implementing some of the following strategies, but there is still room for improvement:
– Compartmentalizing information such that it is accessible to the user on-click but not all shown simultaneously is a strategy that many systems have adopted, in particular by providing alternate views of the alignment and/or each mapping that complement each other in the type of information they convey.
– Grouping competing mappings and displaying them together is also a relevant strategy in this regard, as it gives more information for the user to decide without significantly increasing the cognitive load.
– Providing detailed explanations about the provenance and justification for each mapping (ideally on-click) is important to support user decisions, but also something systems can improve at.
– Predicting and displaying the impact of validation decisions with respect to the logical entailments to the ontologies of the resulting alignment is also essential, as it is virtually impossible for users to grasp this information, yet it is critical to ensure alignment coherence. It is something that only a few systems do reasonably—mainly those that also implement logical repair algorithms.
Balancing user workload with user errors is also extremely challenging, as the most effective strategies for reducing validation errors—to have several users revise each mapping, or ask a single user for reassessment—all increase user workload substantially. Furthermore, the most effective strategy for reducing user workload—feedback propagation—is the most impacted by user errors. There are a few strategies that systems can adopt to compensate for or reduce the impact of user errors without increasing user workload, but few of them are adopted by the ontology matching community:
– Grouping competing mappings and asking the user to choose between them is yet again a relevant strategy in this regard, as it decreases the likelihood of error due to the user having more information available to make a single decision rather than two or more independent decisions with less information (this is only true with real users, not in our experiment with simulated user interactions).
– Asking about related mappings is a strategy that systems can adopt to try and gauge the level of expertise of the users, and determine how much to trust them. It may increase the user workload on its own, but if paired with a feedback propagation technique or in a strategy where untrusted users are asked less questions, the overall workload can be kept in check. Of the systems we overviewed and evaluated in our study, the only one that implements such a strategy is ALIN, so there is clearly potential for systems to explore it further.
– Asking users directly to gauge their confidence about the validation decision is another strategy to determine how much to value their feedback, information which can then be harnessed as in the strategy above. The main limitation of this approach is that it relies on the users being aware of the limitations to their knowledge, which may not be entirely accurate in cases that are more complex than they appear. But in general, this is likely the most reliable approach to preclude and handle user errors, and one that is severely underexplored by matching systems.
While our study can provide some help for users to decide which alignment system to use, that is beyond its scope. Our goal was to assess the state of the art as a whole, rather than to highlight individual systems. There are too many aspects to consider, and there is no clear-cut set of criteria that would enable us to choose the best system(s), given that all have aspects in which they are better or worse. An aspect of systems that is also relevant for this decision but was outside the scope of our study is the automatic performance of the system, as systems that produce better results automatically demand less user workload for validation. A recent study highlighted AML as one of the academic solutions meeting most of the functional requirements for an ontology mapping service (Harrow et al. Reference Harrow, Balakrishnan, Jimenez-Ruiz, Jupp, Lomax, Reed, Romacker, Senger, Splendiani, Wilson and Woollard(2019)), and our survey of alignment system users revealed that AML and LogMap are the most popular systems among the community, likely because both have a long history of versatility and quality in the OAEI, but this does not mean that they are necessarily the best systems for alignment validation.
Our functional assessment of state-of-the-art ontology alignment systems has shown that there is clear room for improvement with respect to the support for user validation of their UIs. We expect our assessment to serve as a starting point towards establishing guidelines and best practices for good UI design in the context of ontology alignment and aim to leverage it in that direction. That said, it is clear that the way forward for assessing the interfaces of ontology matching systems and promoting their development is through usability assays with real users having varying degrees of expertise (Pesquita et al. Reference Pesquita, Ivanova, Lohmann and Lambrix(2018)) in a semi-competitive setting such as the OAEI. The logistical challenges to organizing such an evaluation cannot be overstated, but it is clear that doing so should be our goal.
Our experiments from the OAEI have shown that there is also room for improvement with regard to the workload demand of interactive alignment systems and their ability to handle errors. In the short term, we aim to refine our experimental set-up to better simulate the manual validation process. Concretely, we will limit the number of queries systems are allowed to make, to force systems to make the most of the available workload. We will also have the simulated user provide a confidence value rather than a binary classification of each mapping, to enable systems to explore strategies relying on user confidence. In the long term, the way forward is to move the OAEI interactive evaluation towards user validation experiments with real users, relying on the UIs of the systems. Such an evaluation could even be combined with usability assays. Again, there are several logistical challenges to overcome, but the most feasible scenario for this evaluation would be a crowdsourcing scenario where some reward (monetary or otherwise) could be given to participants based on their workload (e.g., through a sponsorship).
Acknowledgements
This work has been financially supported by the Fundação para a Ciência e Tecnologia through the funding of the LaSIGE research unit (ref.UID/CEC/00408/2013) and project PTDC/EEI-ESS/4633/2014, the Swedish e-Science Research Centre (SeRC), the Swedish Research Council (Vetenskapsrådet, dnr 2018-04147), the Swedish National Graduate School in Computer Science (CUGS), the AIDA project (UK Government’s Defence & Security Programme in support of the Alan Turing Institute), The Alan Turing Institute under the EPSRC grant EP/N510129/1, the SIRIUS Centre for Scalable Data Access (Research Council of Norway, project 237889), the BIGMED project (IKT 259055), the ELIXIR-EXCELERATE project (INFRADEV-3-2015), and EUs Horizon 2020 research and innovation program (grant no.786993).


 Open access