


The development of renewable energies is a necessity, as fossil energy resources contaminate the climate and are declining as a result of extensive use. Moreover, the coronavirus COVID-19 (SARS-CoV-2) outbreak caused an additional decline in global energy markets, leading to an oil price collapse. The embracement of sustainable energy systems can intensify nations’ economic and energy security (Alper and Oguz Reference Alper and Oguz2016) but there are challenges, particularly a possible return to strict lockdown measures in the event of subsequent waves of infection. Consequently, governmental stimulus packages may be focused on health rather than on renewable-related measures, even with the higher electricity demand that resulted from quarantine policies (Cicala Reference Cicala2020). Renewable power integration, then, poses enormous challenges in grid demand-side management, which varies widely across countries and especially in emergent economies. According to the International Energy Agency (IEA 2020), the year 2020 saw a 13% decline in electricity capacity. Specifically, solar photovoltaic (PV) and wind power declined by 18% and 12%, respectively, over 2019. Despite the fact that greenhouse-gas emissions lowered during the pandemic with the partial or full cessation of industrial activity, this is likely to be insignificant in the long run, especially since status quo activities have emerged in the postpandemic period (Hepburn et al. Reference Hepburn, Brian O’Callaghan, Stiglitz and Zenghelis2020). Therefore, local governments should implement an egalitarian equitable distribution of the world’s energy supply in of oil, gas, coal and low-carbon sources by 2040 to mitigate a climate crisis. In Latin America and the Caribbean, energy consumption is associated with gross domestic product (GDP; Pablo-Romero and De Jesús Reference Pablo-Romero, Del and De Jesús2016), and economic growth has contributed to greater consumption of fossil fuels. However, the social-distancing measures and incurred financial strain on the health system and industry with the recent pandemic affected countries’ political and welfare systems. Thus, in 2020, the region’s poor population (US$2.15 per day, in 2017 purchasing power parity) rose due to reduction of Gross Domestic Product (up to 7.4%) and formal jobs (39 million people, Acevedo et al. Reference Acevedo, Castellani, Lotti and Székely2021). However, the region has a variety of emerging economies, climates, ecosystems, and untapped renewable sources, and the promotion and benefits of renewable energy integration in economic, social, and political matters have been recognized in several studies (Flavin et al. Reference Flavin, Milena Gonzalez, Ochs, da Rocha and Tagwerker2014; Organisation for Economic Co-operation and Development [OECD] 2019).
Latin America has a higher level of clean energy use than other world regions, but access to household electricity remains a challenge for the poor population, and upgrading and expanding infrastructure to supply modern and sustainable energy services is highly desirable (Jiménez Reference Jiménez2017). However, the renewable energy sector in Latin America received scant attention from scholars during the pandemic, and it is unclear to what extent the set targets by The Paris Agreement will be met (Economic Commission for Latin America and the Caribbean [ECLAC] 2018). Therefore, this article analyzes the renewable sector of the ten countries in Latin America and the Caribbean with the highest GDP by assessing each country’s installed capacity, energy performance, social and political constraints, and limitations and advantages in technology (hydro, wind, and solar).
Economic, social, and demographic development of the region
Latin America comprises thirty-two sovereign states and sixteen dependent territories covering an area of 20,111,457 square kilometers in the Caribbean, Mexico, and Central and South America. It has an estimated population of 642,216,682, with population density of 31 per square kilometer on average. The region is home to rich biological diversity, with approximately 60% of the planet’s terrestrial life and diverse marine flora and fauna (UN Environment Programme, World Conservation Monitoring Centre 2016). The biomes of the region vary from wetlands and coastal ecosystems to deserts, tropical forests, and extensive savanna and grasslands. Natural resources are abundant, with 25% of Earth’s forests and arable land, 30% of the world’s water resources, and 29% of global rainfall (Domínguez et al. Reference Domínguez, León, Samaniego and Sunkel2019). The region has traditionally been an exporter of natural wealth to emerging and developed markets, fueling the economy through infrastructure, services, and industrial facilities. These practices, though cost-effective in the short term, are not necessarily beneficial to the environment. Furthermore, Latin America and the Caribbean have the second greatest oil reserves in the world, after the Middle East. However, with inequality as a historical structural characteristic of Latin American societies, policies to develop and strengthen employment and social inclusion have proved ineffective despite the abundance of natural resources (Sinnott, Nash, and De La Torre Reference Sinnott, Nash and De La Torre2010).
Table 1 shows the key social and economic development indexes for the top 10 countries with the highest gross domestic product in 2018. The Human Development Index (HDI), classifies the countries from 0 to 1, according to variables such as life expectancy, education, and per capita income. Those countries with HDI greater than 0.80 are classified as having high human development; scores between 0.50 and 0.80 indicate medium human development; and scores of less than 0.50 indicate low human development. In general, Latin America has high HDI, with Chile and Argentina heading the list (0.847 and 0.83, respectively), and the rest of countries showing values from 0.65 to 0.76 (medium to high human development). This contrasts with the current inequality that has increased economic disparity between sectors of the population. Latin American countries face significant challenges to eradicating poverty and extreme poverty, as well as reducing inequality in all its dimensions. The GINI ratio measures the income inequality of a country with values between 0 and 1, where 0 corresponds to perfect equality and 1 to perfect inequality. The index shows a panorama of considerable inequality, with an average figure of 46.49%. Brazil and Colombia show a higher statistical dispersion in income distribution; however, inequality in levels of wealth in general evidence notable income disparity. This inequality is a historical structural characteristic of Latin American societies that has been maintained and perpetuated even at times of growth and economic prosperity. Income distribution policies have proved ineffective for developing and strengthening employment and social inclusion (ECLAC 2019). Latin America’s incomes have grown by only 12% since 1980, less than the world average of 65%. Additionally, the poverty rate in Latin America rose from 28% in 2014 to 31% in 2019 (Alvaredo et al. Reference Alvaredo, Lucas Chancel, Saez and Zucman2019). The economic growth rates are insufficient to close the income gap with advanced economies given the current heterogeneity (OECD 2019). For instance, by 2020, Brazil and Mexico were within the twenty major economies worldwide, whereas Haiti and Nicaragua were among the poorest countries in the world. Even with positive growth prospects, this economic inequality in Latin America will continue to grow if countries fail to modify their economic policies meant to establish and diversify their main economic sectors. In this sense, several studies have addressed the energy sector as an economic enhancer, building circular economies and assuming that the energy industry is essential for economic growth (Mignacca, Locatelli, and Velenturf Reference Mignacca, Locatelli and Velenturf2020; Yergin and Gross Reference Yergin and Gross2013). Particularly, countries rich in renewable energy resources can develop strategies to maximize the benefits from larger investment flows and higher employment rates. Furthermore, investment in renewable energy boosts a country’s innovation and technological advances.
Table 1. Key figures for social and economic development from selected countries.

Source: OECD (2019), Conceição (Reference Conceição2019), World Bank (2020).
General overview of the energy sector
Most worldwide electricity production comes from fossil fuels. The demand for these materials can thus be said to be constrained to a few developed and emerging but high-population countries, as shown in Table 2. Likewise, these countries contain the largest stock exchanges (China, followed by the United States and Japan), and thus import activities are essential to their economic output and public welfare, and also foment (directly and indirectly) oil-related policies for exporter countries. China still is the largest consumer of the three most utilized fossil fuels in domestic and industrial applications. Clearly, a disruptive activity in the market for those fossil fuels, such as COVID-19, can lead to a worldwide financial imbalance.
Table 2. Key worldwide energy consumers (Birol Reference Birol2020).

According to data from the IEA (2020), Latin America generates 964.18 million metric tons of oil equivalent (Mtoe), representing about 7% of global production. The energy matrix in Latin America is formed by seven types of energy: oil, natural gas, coal, hydro, nuclear, wind, and solar. From these, crude oil and natural gas represent the primary sources, with 69% of total generated (662.9 Mtoe) (Figure 1).
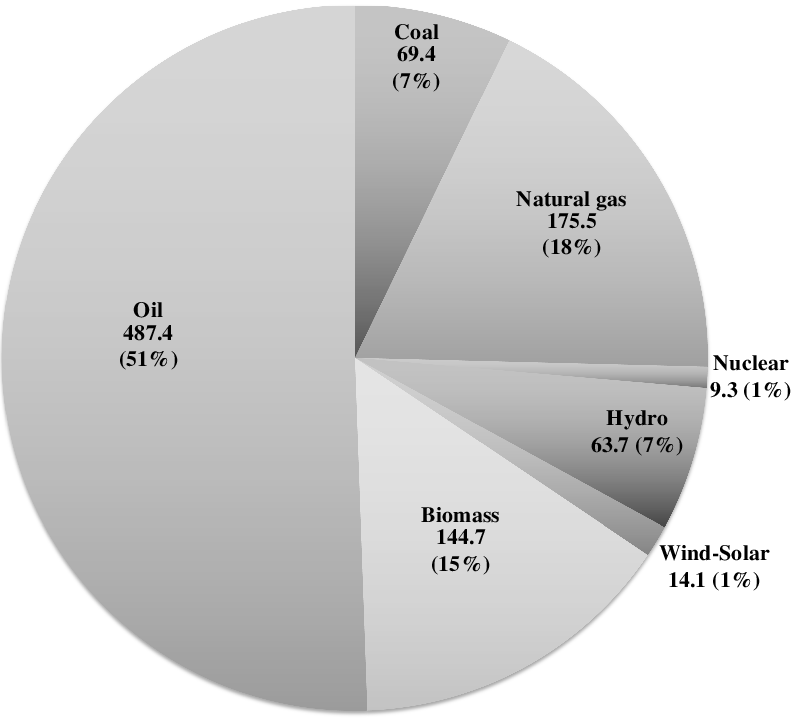
Figure 1. Energy production per type in Latin America (Mtoe) (IEA 2020).
Despite assessments that, by 2020, Brazil, Mexico, and Peru were among the largest oil exporters in Latin America, evidence suggests that their oil production has been dwindling or becoming unaffordable due to oil market disruption, especially in the wake of COVID-19 (Looney Reference Looney2020). These countries suffered financial losses and currency depreciation in the first and second quarters of 2020 (Ozili and Arun Reference Ozili and Arun2020). Because international demand for oil is only growing, overexploitation and the search for new fossil fuel resources is occurring, leading to a variety of domestic issues across the Latin American countries: dependence on foreign supply (e.g., Peru’s 2014 oil imports from the United States surpassed those of 2008 by a ratio of 3 to 1); reduced net revenues (e.g., Brazil exports 42% of its crude oil to China); disrupted domestic activities, as oil imports are destined to basic transport and sustainable infrastructure, such as electric vehicles, is still poorly developed in most countries; water stress in agricultural lands; and increased crop prices due to the production of alternative fuels (biofuels).
As Table 3 shows, total petroleum imports in selected countries amount to US$100.85 billon, including US$69.18 billion from refined petroleum, US$15,357.9 million from crude petroleum, and US$16,320.8 million from petroleum gas. Mexico is the country with the highest figures, particularly in refined petroleum and gas, followed by Brazil. Regarding electricity, Brazil is the main importer and Guatemala the main exporter. These data suggest an important dependence on the foreign market to cover internal demand for energy instead of investing in renewable energy oriented toward energy self-sufficiency.
Table 3. Balance of energy resource imports and exports from selected countries (in millions of USD, 2018)

Source: IEA (2020).
The combined energy production in 2018 from selected countries reached 745 Mtoe, with an electricity final consumption of 1,166.37 TWh (Table 4). Such energy production trends result in 1,292 million metric tons of carbon dioxide (CO2) released into the atmosphere, with a 2.2 metric tons of CO2 generated per capita. Although the environmental impact of electricity consumption in the study region is lower than the world average of 4.4 metric tons of CO2, the values show a dependence on energy systems with significant levels of pollution.

Moreover, as observed in Figure 2, the energy intensity, a ratio of gross inland energy consumption (total primary energy supply of a country, or TPES) and GDP, shows that the Dominican Republic needs the most energy resources to obtain GDP, with an intensity of 0.26, followed by Brazil and Panama, with 0.19 and 0.17, respectively. In contrast, Colombia and Argentina show higher energy efficiency, with an intensity estimated at 0.1.

Figure 2. Energy Intensity (TPES/GDP) (toe/thousand 2005 USD) (2017) (IEA 2018).
The average energy intensity in 2017 from selected countries reached 0.146, a higher value than the global average of 0.119 and 0.123 in OECD countries (IEA 2018). This indicates limited efficiency due to the higher costs of converting energy into GDP. The reduction of energy intensity in the region has been gradually low. Figure 3 shows inconsistent activity from 1980 to 2000, with numerous fluctuations. Since 2000, energy intensity started to decrease at a significantly low rate of 0.08%. Therefore, although a downward trend is evidenced, the rate of reduction is considerably lower than the 3% annual rate of reduction by 2030 that is fixed in the United Nations’ Sustainable Development Goals (Clark and Wu Reference Clark and Wu2016).
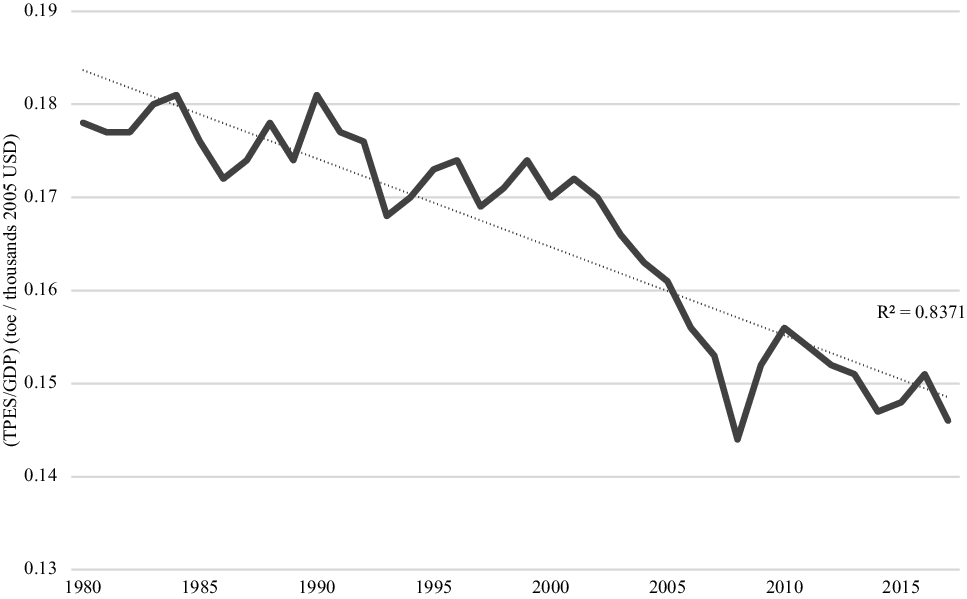
Figure 3. Energy intensity behavior in selected countries, 1980–2017 (IEA 2018).
Clearly, global energy intensity has not reached this target, and implementation of energy efficiency policies focused on renewable sources has been particularly limited in developing economies. This is despite the fact that the metric of levelized cost of electricity, or average cost of electricity considering a project’s affordability, for worldwide renewable energy is positive and in most cases less costly than fossil fuel production (Table 5). Renewable energies represent only 23% in the region (participation in the national energy matrix), including mainly production from hydro technologies; a new perspective is required if this trend is to change.
Table 5. 2021 worldwide average levelized cost of energy (LCOE) per energy source.

Source: International Renewable Energy Agency [IRENA] (2022).
Latin America and the Caribbean, and particularly the countries subject to the present analysis, show an unfavorable scenario for reducing energy intensity and achieving efficiency if a high dependence on fossil fuels remains.
Energy progress per type of energy source
Hydropower
Hydropower is created by rotation of multiple turbines that are coupled to an electrical generator; it uses the kinetic or potential energy of continuous flowing waters, such as in rivers and falls. Hydropower plants are classified according to power capacity: micro, less than 100 kilowatts (KW); mini, 101–2000 KW; small, 2,001–25,000 KW; and large, over 25,000 KW (Gatte and Kadhim Reference Gatte and Azeez Kadhim2012). A dam—the water-retaining structure (potential energy storage)—is an important but not required component of hydropower plants, such as in run-of-rivers plants (mostly small capacity). Dams control floods and can be used to store energy, as the water can be pumped by the same turbines at greater heights within the dam to convert electricity into potential energy, and vice versa. With the rise in the use of intermittent resources and cost-ineffectiveness of energy storage systems (e.g., batteries), the pumped hydropower is believed to play a key role in the sustenance of the future, renewable-based electrical grid.
In Latin America, the hydroelectric sector has a pivotal role in the domestic economy and the region’s lifestyle: the largest amount of the renewable electricity produced comes from water reservoirs, and most of the rest is supplied by conventional fuels. Brazil is the most populated and wealthiest of the studied countries, with hydroelectricity production of 397 TWh per year, representing 73% of total electricity consumption (IEA 2020). The hydropower capacity is 64% of the total electricity capacity (163 GW). Brazil is home to the Itaipu Dam on the Paraná River, one of the largest dams in the world, with a capacity of 12.6 GW (Ferroukhi et al. Reference Ferroukhi, Ghislaine Kieffer, Luiz Barroso, Muñoz and Gomelski2016). This energy matrix is followed by Colombia’s produced annual hydroelectricity of 60.5 TWh/year, representing 81% of total electricity consumption (IEA 2020). Colombia’s hydro sector represents the largest percentage of renewable installed capacity among the selected countries, accounting almost 12 GW, or 70% of the total. Argentina’s hydroelectric sector is in third place, with a generation of 40.2TWh/year, or about 30% of total electricity consumed (Secretary of Energy of Argentina 2020). The installed capacity is close to 25% of the total capacity of 39 GW. It is followed by Mexico’s 12.6 GW of installed capacity (total of 88 GW) and yearly generation of 34.54 TWh, about 12% of the nation’s consumption (IEA 2020). This is the lowest energy share among the countries, and thus Mexico is the most polluting country after Brazil. The oldest Mexican dam, La Angostura, dates to 1976 and has installed capacity of 900 MW. However, Peru, despite having a lower GDP than Mexico (see Table 1), still produces a modest 30 TWh/year, about 66% of its consumption (IEA 2020). The country’s hydro share capacity is 34% of the nation’s total electricity capacity of 15 GW. Chile, having the highest HDI, electricity consumption per capita, and income per capita of the selected countries, has a modest hydroelectric sector of 21.87 TWh/year, supplying almost 27% of its total electricity needs (IEA 2020). Moreover, 6.8 GW of its total installed capacity of 26 GW is due to hydropower plants. Panama, the second wealthiest but least energy-producing and lowest populated country, has hydroelectric capacity of 1.5 GW (45% of its total) and production of 7.2 TWh/year, compared with 9 TWh/year of the electricity needed (IRENA 2018). It is, in addition to Chile, one of the top-performing countries, as the largest electricity exporter (after Argentina) and the least polluting country. Ecuador produces 20 TWh/year of its total capacity of 30 TWh/year through hydroelectric power plants, and its installed capacity is 60% of the total’s 7.9 GW (Agencia de Regulación y Control de Electricidad 2020). Its largest hydroelectric dam is Coca Codo Sinclair, located between Chaco and Lumbaqui, with a capacity of 1.5 GW. Guatemala has the lowest electricity consumption per capita, but the hydro share is modest: 1.5 GW of installed capacity with a total of 4.6 GW, and 5.86 TWh/year of electricity generation, or 58% of total consumption (Ministerio de Energía y Minas 2019). The Dominican Republic has the least built-out hydroelectric energy matrix, comprising 15% of the total’s 3.9 GW installed capacity and generating 2.2 TWh/year, or 13% of total consumption (Comisión Nacional de Energía 2018). The Nizao River, located in the south of the country, contains three hydroelectric power plants—the Jiguey dam is the most important, with a power capacity of 98 MW.
To keep up with population growth and electricity demand, many Latin American countries aim to develop more large hydro projects but have almost depleted the most viable hydro sites. Likewise, building more large dams can have profound health effects for the already-damaged surrounding fish population and may cause floods in nearby settlements, if poorly designed. For instance, the diversion dam of the Ituango hydroelectric power station (2.4 GW) in Colombia failed during construction, leading to evacuation of a nearby village; the project’s finalization was then postponed to 2021. Relying on just a few hydropower plants has disadvantages as well. In 2009, the Itaipu’s power activity was halted for about four hours as a result of wind and rain impact on transmission lines, causing a major blackout in Brazil and Paraguay and affecting about sixty million people. Alternative solutions may include development of small-scale hydropower stations to minimize the influence of the meteorological events (e.g., droughts due to El Niño) on the reliability of the power plants and the local community.
Solar
Solar energy technology relates to the conversion of the sun’s energy (light and heat) into electrical or thermal energy. This is mainly based on the photovoltaic effect, or the production of an electric current in a semiconductor material resulting from the absorption of light radiation (Zhao et al. Reference Zhao, Wa Gao, Williams, Hanif Mahadi and Ma2019). Sunlight is directly transformed into electrical energy in photovoltaic (PV) solar cells consisting of a semiconductor material, such as silicon. Solar energy has two main characteristics (Nwaigwe, Mutabilwa, and Dintwa Reference Nwaigwe, Mutabilwa and Dintwa2019). First is dispersion, referring to the density of the energy that reaches 1 kW/m2. As this is less than other energy densities, large catchment areas are required to concentrate solar rays. Second is intermittence, as solar radiation is limited to daylight hours, so requires energy storage systems. Because the nuclear reaction occurring in the sun’s core, the source of the solar energy, will continue for the next 5 billion years, solar energy is considered inexhaustible and renewable.
Brazil produces 832 GWh (4,549 ktoe), representing 1.5% of the energy matrix, with installed capacity of 1,795 MW (Empresa de Pesquisa Energética 2019). Although Mexico has a photovoltaic power output estimated at 5.52 kWh/kWp, the country generates only 0.7% of its energy from solar, accounting for 3,199 GWh (4,413 ktoe), with installed capacity of 4,426 MW (Secretary of Energy 2018). Chile reports a generation of PV solar at 5,121 GWh (892 ktoe); however, this is significantly low given reported installed capacity of 4,857.93 MW (Comisión Nacional de Energía 2019); in terms of the primary energy supply for energy, the contribution of solar energy is low, with only 3364.8 TCal (1% of total). Colombia does not report solar energy generation; however, energy consumption in the Non-Interconnected Zones (Non-Interconnected Zones are the municipalities, corregimientos, localities and hamlets not connected to the National Interconnected System) is supplied by diesel plants, small hydroelectric plants, and more recently solar panels. Although not officially registered, minor solar PV energy production exists (Unidad de Planeación Minero Energética 2018). Peru reports only 287 GWh (982 ktoe), representing 0.51% the total energy generated; installed capacity is estimated at 96 MW in main areas: Sierra, 5.5–6.5 kWh/m2/day; Costa, 5.0–6.0 kWh/m2/day, and Selva, 4.5–5.0 kWh/m2/day (Ricaldi-Arévalo 2020). Ecuador produces only 37 GWh (12 ktoe) of energy from solar PV, representing 0.13% of total energy produced, with installed capacity estimated at 26.74 MW. Argentina produces 16 GWh (54 ktoe) from solar PV, or less than 0.81% of the energy matrix; current installed capacity is estimated at 317 MW from a solar park located in the Northeast and Cuyo regions (Secretary of Energy of Argentina 2019). In Panama, only 2.06% of total energy is produced from solar, at 156 GWh (56ktoe), with installed capacity estimated at 143 MW (Panama Secretariat of Energy 2020). The Dominican Republic reports 139 GWh (53 ktoe) from solar, representing 0.31% of total energy produced and installed capacity of 87.90 MW (Comisión Nacional de Energía 2018). Guatemala produces 199 GWh (294 ktoe) from solar, and this represents 1.9% in the energy matrix with an estimated capacity of 92.5MW and an average solar radiation of 5.3kWh/m2/day (Ministerio de Energía y Minas 2019).
With these figures, Latin America enjoys a relatively good solar irradiance. Mexico and Chile have the most potential for thermal and photovoltaic power. Nevertheless, solar technology is highly undeveloped and evolving, and changes in electricity costs can vary tremendously by region. Only a few solar farms are in operation (Table 6). Mexico and Brazil, being the highest-earning countries, contain the largest solar capacity, although Chile, a much lower-earning country, has about the same amount due to recent government stimulus and untapped potential. The main disadvantages of solar energy are its intermittency, along with the high cost of energy storage systems. To counterbalance this, some countries offer small to medium-sized grid-tied distributed generation to household and commercial users, subject to a nonselling excess power utility contract; however, a solar panel system is still relatively unaffordable to most Latin American households (Ferroukhi et al. Reference Ferroukhi, Ghislaine Kieffer, Luiz Barroso, Muñoz and Gomelski2016). By contrast, the time in which the investment would be recovered in Brazil is nine years, and elsewhere it is still speculative, given the lack of documentation and low domestic implementation. Off-grid photovoltaic systems, though, have received high acceptance in the rural and agricultural sectors due to financial grants and inoperability of conventional systems. Likewise, solar thermal collectors for heating residential water have attracted a great deal of interest given their simplicity and long life span of over ten years). But the payback period varies according to governmental subsidies and fuel, electricity, and capital costs: it is 13.5 years in Colombia, 2 years in Ecuador, 2–13 years in Guatemala, and 2.8 years in Peru (UN Environment Programme, 2015). The market is expected to grow, as fuel costs increase, and domestic renewable policies are implemented effectively.
Table 6. Renewable energy trend for selected countries (million metric tons of oil equivalent).

Wind
Wind energy includes all the technology available for harnessing the air’s kinetic energy. The three-bladed, horizontal-axis wind turbine is by far the most common concept employed; it is based on the principle of airfoils to produce mechanical then electrical power. The turbine’s efficiency, the ratio of useful work over input energy, is close to 50% (Manwell, McGowan, and Rogers Reference Manwell, McGowan and Rogers2010). The wind technology is comprehensive and lucrative, and its potential on tackling climate change is clear, once considering economic, ecological, and visual constraints. According to assessments, potentially exploitable sites must be relatively accessible and close to demand, with high occurrence (capacity factor >0.25) of winds, at least class 3 (>7 m/s) (Oyedepo, Adaramola, and Paul Reference Oyedepo, Adaramola and Paul2012; Archer and Jacobson Reference Archer and Jacobson2007). To augment wind approval, resolution wind maps have been prepared by Archer and Jacobson (Reference Archer and Jacobson2005) for South America, with seven classifications of wind sites, based on the mean annual wind speeds. However, wind technology has not been extensively applied in many of the ten selected countries, but trends show it is growing and becoming more accessible, particularly as industry favors the implementation of large-scale wind turbines.
Mexico, Brazil, and Chile have the most wind farms among Latin American countries, but these still fall short of hydropower development. Brazil is the leading wind producer, with wind capacity of 14 of 163 GW of its total, along with annual generation of 42.373 TWh, representing (in 2022) 9.5% of the nation’s total consumption (Puerto and Luis Reference Puerto and Luis2015). The Ventos do Araripe, the largest Brazilian wind farm, with capacity of about 360 MW, is between the windy regions of Pernambuco and Piauí. Mexico is set to become a leader in the wind sector, with annual electricity production of 20.89.TWh, compared with total electricity consumption of 281.57 TWh (IEA 2020). The wind sector’s capacity is 6.3% of Mexico’s total electricity capacity. If large-scale projections are correct, Mexican wind resources could provide 50 GW in a competitive manner by 2030 (Sovacool Reference Sovacool2021), potentially reducing natural gas imports and increasing domestic employment. Chile’s wind sector is about 1.5 GW (6%) of total installed electricity capacity and produces 3.59TWh (14%) of annual consumption (Comisión Nacional de Energía 2019). The Chilean wind farm, El Arrayán, which has fifty 2 MW turbines, was the largest in South America when it began operating in 2014. Peru has installed wind capacity of ∼0.4 GW (Ricaldi-Arévalo 2020), compared with its total 15 GW; it produces 1 TWh of wind-based electricity, for 2% of annual electricity consumption. Peru’s 132 MW Wayra I project, launched in 2018 with forty-two 3.15 MW turbines, is currently the largest capacity for a wind farm in Peru. Argentina’s wind capacity is only 2% of total capacity, and it produces about 0.6 TWh/year, or 0.45% of total consumption (Secretary of Energy of Argentina 2020). The largest wind power plant there, the 122 MW Bicentennial, was installed in 2019 in Santa Cruz. Despite Panama’s annual wind electricity generation is 0.49TWh, compared with 9 TWh of electricity consumption; its wind sector capacity still represents 9% of the country’s total (∼3.3 GW) (International Renewable Energy Agency 2018). The Dominican Republic produces 0.4 of 17 TWh/year of electricity through wind resources, and its installed capacity is only 2.5% of its total capacity (Comisión Nacional de Energía 2018). Because of its geographical location, harsh storms and hurricanes can be expected to increase in coming decades; this requires the use of still not fully developed hurricane-proof turbines to promote investor confidence and sector growth. Guatemala’s wind industry comprises 2.17% of the country’s electricity capacity of 4.6 GW, with annual generation of 0.21 TWh, as opposed to an annual total of 10 TWh (Ministerio de Energía y Minas 2019). Colombia produces the least wind energy, with annual generation of 0.03TWh, or 0.005% of national consumption (Unidad de Planeación Minero Energética 2018). Most of its wind-based electricity is supplied through the Jeripachi wind farm, with capacity of 19.5 MW.
The development of the wind industry in Latin America is continuing apace, and its large presence in the energy matrix is imminent. Local energy-regulating agencies would appreciate the installation of large-scale hydropower plants as efficient energy storage systems to overcome the intermittency problems of sources, such as wind. With increased turbine and support advancements, large-scale deployment is expected in the next decades.
Critical review of current status in selected countries
To reduce fossil fuel imports, national regulatory agencies encourage, directly and indirectly, sustainable energy schemes, such as by taxing gas emissions or petroleum liquids and providing incentives for alternative energy methods, with modest positive results: Brazil increased solar electricity generation 180-fold, from 2015 to 2020 (IEA 2020), and wind electricity capacity increased by almost seven times from 2010 to 2015 in Mexico (IEA 2020). One of the main advantages of investing in renewable energy is the resulting reduced stress on oil resources. The electricity production from renewable energy (Table 6) is now safe and available, but depending on the country, it can be still too expensive as compared with fossil fuel technology. Nevertheless, the generalizability of renewable resource preference is problematic, as costs are conditional on various elements: resource accessibility, adaptiveness of the grid system to renewables’ intermittency, government financial capacity and stimulus, public approval, demand and supply, and environmental concerns. As few of the countries analyzed are energy self-sufficient, international cooperation, including the operation and creation of interconnected grid systems, has been used to offset the large domestic electric demand. But this electricity capacity may have the effect of diminishing the need for and encouragement of domestic renewable energy investment (a low payback period). Single wind and solar energy devices have shorter life spans and power outputs than hydropower stations do, requiring multiple adjacent installations to become a significant viable alternative. Increasing solar and wind capacity implies the use of large spaces, disrupting biodiversity and causing habitat losses if installed in intact forests, as occurred in Mexico. Also, solar and wind farms are vulnerable to public opinion and extreme meteorological events (e.g., hurricanes, storms); therefore, relying on a few types of renewable resources, even if cost-effective, is not necessarily opportune. The future trends for each country analyzed here are discussed in the following sections.
Argentina
The economic crisis of 2001 affected the energy sector due to preferential subsidies for conventional energy projects (Haselip and Potter Reference Haselip and Potter2010). This significantly reduced the participation of renewable energy projects and raised financial, geographical, technological, and political barriers. In recent years, Argentina has been working on overcoming such barriers and transitioning from high dependence on fossil fuels to a focus on renewable energy sources. According to a 2015 law (No. 27191), the share of renewable energy in Argentina is to reach 20% by 2025, with 126 projects currently operating and 90 under development. To achieve this, the country can increase capacity of wind and hydro power plants; for instance, only 25% of viable hydro energy has been exploited, and wind capacity may reach 15 GW (Secretary of Energy of Argentina 2020). In 2016, the RenovAr program (electric power supply from renewable sources) was introduced to increase installed capacity by 4,600 MW, with 71% from wind and 26% from solar PV (Schaube, Ortiz, and Recalde Reference Schaube, Ortiz and Recalde2018). Solar farms are technically feasible, but only few projects are expected in the next decade. The development of the renewable sector, as a whole, seems to be vulnerable due to the country’s financial and political problems and affordable energy costs (Ferroukhi et al. Reference Ferroukhi, Ghislaine Kieffer, Luiz Barroso, Muñoz and Gomelski2016). Options for phasing out the fossil fuel technology include involvement of the private sector and international cooperation.
Brazil
By 2018, about 45% of energy in Brazil came from renewable sources, higher than the world average of 13% (Puerto and Luis Reference Puerto and Luis2015). The main renewable source is hydropower. Brazil’s hydroelectric power capacity is expected to add, through the construction of twenty-six projects, 44 GW to the electrical grid by 2028 (Monzoni and Vendramini Reference Monzoni and Vendramini2016). Since many running-water sites that are close to settlements or accessible have already been exploited, most power plants are to be located in the Amazon, an area rich in biodiversity. The planned Belo Monte power plant will be the third largest worldwide, with capacity of about 11.23 GW. For this reason, environmental concerns have risen among nearby communities, and the shift from hydro to other type of renewable energies is necessary for the gradual rising of electric demand and compliance with the Paris Agreement. Brazil is considered a top solar market in Latin America, particularly for PV, and up to 126 GWp (peak power) of solar capacity may be generated by 2040 (Hansen and Zambra Reference Hansen and Zambra2020). The solar industry is now showing positive growth with the manufacturing of PV modules and parts and the availability of net metering. For instance, solar energy had a remarkable increase of 316%, going from 832 GWh in 2017 to 3,461 GWh in 2018. Many wind projects have been planned in Brazil’s Northeast. Wind power generation increased by 46.5% from 2000 to 2005 (IEA 2020), with capacity reaching almost 40GW by 2029 (Empresa de Pesquisa Energética 2019). Moreover, energy derived from fossil fuels decreased 25% in 2018 (Empresa de Pesquisa Energética 2019). The government has implemented a series of tax exemptions on sales and income, on the basis of territory and type of renewable energy implementation. For instance, a state tax on circulation of merchandise and services can be exempted or postponed as related to the operation and acquisition of renewable energy systems, mostly wind, solar, and biomass. These figures reveal Brazil as a country with solid efforts to transit into a sustainable energy sector in the short and medium term. Investments in the renewable sector will result in improved and increased infrastructure, for an expected total of 765 wind plants, 150 solar, and 833 (>1MW) hydro (Monzoni and Vendramini Reference Monzoni and Vendramini2016).
Chile
With an energy intensity of 0.1 toe/100 USD (2010 PPP) Chile has invested in expanding its green energy infrastructure in order to reduce the cost of producing electricity. The country has established ambitious projections intended to reach 90% of energy from renewable sources by 2050. Tax incentives are still poorly developed, however, and the mix of the national electricity sector, through the law 20698, aims to contain at least 20% of renewable energies (Comisión Nacional de Energía 2019). The government has passed a series of legislation for accelerating access to renewable energies, such as auctions, net metering, grid access, and taxes on carbon emissions. Theoretically, solar energy could provide most or all of Chile’s electricity in the nearby future. However, hydropower plants will still play a key role in the transition period, followed by increasing installation of solar farms across suitable regions, such as the Atacama Desert, a dry place with the highest global solar incidence. As of March 2020, thirty-seven electricity generation projects were in the development stage, with an estimated date of operation between 2023 and 2025 and total capacity of 3.8 GW (Comisión Nacional de Energía 2019). Most of these are solar (1.37 GW), followed by wind (1 GW) and hydro (0.9 GW). Furthermore, ninety-one new renewable projects have been approved in 2022, with total investment of 153USD billion. The transmission lines, with an extension of 403 km, are being expanded throughout the country.
Colombia
In 2014, the government passed Act 1715 in connection with implementation and development of nonconventional sources of energy (NCSE), with a focus on sustainability. The law provides a series of tax reductions for corporations and individuals related to use and acquisition of renewable energy and its applications, as well as projects and equipment related to the increase of energy efficiency and environmental preservation. However, energy transition in Colombia has been gradual; as of 2020, 324 active solar energy projects were registered with the Unidad de Planeación Minero Energética—they were expected to produce 9164 MW, compared with 104 hydroelectric projects with total capacity of 4291 MW and 19 wind energy projects with 2,555 MW total capacity (Arango Reference Arango2019). The power capacity of the projects varies per source, with 44% of the solar power plants below the 1 MW (Ministerio de Minas y Energía 2019). The lowest cost source is wind, with an average cost of US$8/MWh. Solar comes in second place (US$12/MWh) and hydraulic in third (US$13/MWh) (Departamento Nacional de Planeación 2019). Despite the largest observed trend of renewable projects from solar and wind, various development programs consider energy auctions to increase their presence, from less than 1% of total net generation capacity to approximately 6% in 2022; however, the total energy promised by the NCSE projects is less than 35% of the current installed capacity (Arango Reference Arango2019). With average radiation values for different regions of the country estimated at 4.62 kWh/m2/day, solar energy is expected to grow with the construction of El Paso solar park, which is expected to generate 176 GWh to supply annual energy needs of about 102,000 houses and 400,000 people (Unidad de Planeación Minero Energética 2018).
Dominican Republic
Electricity generation in the Dominican Republic is based on a diversified matrix formed by wind, water, sun, biomass, natural gas, coal, and petroleum derivatives. The Dominican Republic’s energy matrix will see a 25% rise from renewable energies capacity, according to Law No. 57-07. A report by the International Renewable Energy Agency (IRENA 2016) estimates that 44% of the country’s electricity could be produced by renewables resources, following a national strategic plan, by using wind- and solar-intensive sites and developing micro-hydropower generation. PV utility-scale and off-grid systems have great potential across the island but are underdeveloped: only 15 MW is net metered. The panorama seems promising: an investment of US$522.5 million is expected for five new electric power generation projects in coming years. The major initiatives includes the Agua Clara Wind Farm, with installed capacity of 50 MW; Matafongo wind farm, with an installed capacity of 34 MW; Montecristi Solar, with installed capacity of 58 MW; Guanillo wind farm, with installed capacity of 50 MW; and Los Guzmancito wind farm (Poseidón), with an installed capacity of 48.3 MW (Comisión Nacional de Energía 2018). Moreover, IRENA (2016) suggests that the Dominican Republic could generate 16 TWh of electricity from renewable energy by 2030, specifically from renewable generation capacity of 6 GW (from total installed capacity of 10 GW). Onshore wind farms are technically viable along the southwestern and northwestern coasts. Wind energy could be the largest source of renewably sourced electricity, with electricity generation of 6.1 TWh per year in 2030 from forty-five wind parks. Photovoltaic technology, with average radiation of 3.86–5.05kWh/m2/day, could contribute 3 TWh of total capacity of 1.9 GW in 2030; this potential includes both network-connected capacity (large-scale and decentralized) and off-grid capacity in non-interconnected areas. Regarding bioenergy and waste, there is the potential to increase total bioenergy capacity from bagasse and biogas, as well as through co-combustion up to 448 MW by 2030. However, since the island is propense to meteorological events such as hurricanes and storms, the government needs to invest in improving the electrical grid and ensuring clear mechanisms to attract investors in the energy sector.
Ecuador
Ecuador has passed a series of fiscal regulations to prioritize the development of renewable energy projects. These include tax allowances for renewable electricity producers, support of research institutions, cooperation with private companies, and investment in electricity transmission and distribution. For 2019, the effective power generation of Ecuador from renewable sources was estimated at 5.227,22 MW (about 65% of total effective power); total production and energy imports reached 21.224,31 GWh (about 72% of total) from renewable resources (Agencia de Regulación y Control de Electricidad 2020). According to the Ministry of Energy, renewable sources may account for 90% of total electricity consumed by 2025. Nonetheless, most of this will be due to hydroelectric resources; in theory, these are about 91 GW, but only 22 GW are possible in terms of economics (Posso et al. Reference Posso, Espinoza, Sánchez and Zalamea2015). Furthermore, the country could harness its solar radiation estimated in 4.57 kWh/m2/day, with Loja, Pichincha, and Galápagos identified as the most suitable provinces for exploiting solar resources at medium and large scale (Cevallos-Sierra and Ramos-Martin Reference Cevallos-Sierra and Ramos-Martin2018). Current projects include the photovoltaic power plants of Isabela Solar and Panel Fotovoltaico, which started operations in 2019 with the aim of contributing 1.15MW to current installed capacity.
Guatemala
The government has a target to lower greenhouse gases emissions, through the Nationally Determined Contributions and Low Emissions Development Strategy (LEDS). The LEDS main objectives comprise the phase out of fossil fuels through increase of sustainable and environmentally-friendly projects, with respect to different sectors: transport, energy, industry, forest, agriculture, solid and liquid waste management (Ministerio de Ambientes y Recursos Naturales 2018). Nevertheless, Guatemala has a considerable but poorly exploited number of renewable resources. The hydroelectric sector represents 35% of the country’s energy matrix and the largest untapped resource with about 4.6 GW. Plans exist to build a 58 MW hydropower plant, the Presa Oxec II (Ministerio de Energía y Minas 2019). An assessment study reports sixty viable renewable energy projects across the country based on several factors: expected demand and supply, cost of production, and rate of water flow. Of these, nineteen are hydroelectric plants (1.17 GW), nine are solar plants (0.31 GW), and eight are wind plants (0.33 GW) (Ministerio de Energía y Minas 2019). The current energy policy considers transiting from the current 35% to 80% of electrical generation from renewable resources by 2027. This goal involves mainly the exploitation of wind and solar resources, as social conflicts have led the government to limit development of new hydroelectric plants. Regarding solar and wind energy, in addition to the sixty projects, expansion plans consider the optimization of four plants that will provide 110 MW to the National System Interconnected (in Spanish, Sistema Nacional Interconectado, or SNI).
Mexico
The energy sector has played a strategic role in Mexico’s economic development, both due to its importance in the productive sector and the significant contribution of tax revenues. Mexico is ranked as the nineth country with the largest amount of oil reserves in the world and the fourth in America (Alemán-Nava et al. Reference Alemán-Nava, Casiano-Flores, Cárdenas-Chávez, Díaz-Chavez, Scarlat, Mahlknecht and Parra2014). However, as the energy sector has depended on an internal production of fossil fuels and a constant importation of oil derivatives such as gasoline, diesel, and jet fuel, the renewable energy sector has become a focus of attention in recent years. Mexico encourages sustainability through direct and indirect actions. First, users can install and interconnect renewable co-generation systems at small and medium scale into the national electricity grid. Second, economic incentives and loans exist for small-scale solar projects, and additional credits can be reclaimed for home purchases with eco-friendly technologies. Fiscal incentives include accelerated depreciation for renewable energy equipment through article 34. Other discounts apply to water bills and property taxes through renewable energy usage. As Mexico has vast water resources, including rivers, lakes, and drainage basins, hydropower has been the most exploited technology. However, solar sources are vast; the Chihuahua Desert has estimated direct normal irradiation of 7.871 kWh/m2/day. Also the national photovoltaic average ranges between 3.84 and 5.51 kWh/kWp (World Bank Group 2020), attesting to the viability of solar energy projects. Furthermore, the power density for wind is estimated at 325 W/m2 with 6.03 m/s at a height of 50 meters (Technical University of Denmark 2020), showing the potential of wind projects. In 2015, Mexico fixed a goal of 35% of the total energy exclusively from renewable sources by 2024 and 50% by 2050. To achieve these goals, several wind and solar projects are in development or operational, although the share of future hydro can be sufficient to meet the set target: 18 to 22 GW (Secretary of Energy 2012). As of 2019, eighty-four projects across the country were active; almost half were combined cycle power plants and the rest solar, followed by wind and hydro (Secretary of Energy 2018). With such performance, Mexico seemed to have great promise in taking action to increase renewable energies. Nevertheless, recent changes in the government have brought uncertainty; the new Energy Sector Program 2020–2024 favors increased hydrocarbon exploration activities, and wind and solar auctions are no longer available (Secretary of Energy 2020). New projects will aim to increase oil infrastructure and refinery processing capacity, leading the country to greater dependence on fossil fuels and limiting the transition into a renewable and sustainable energy sector.
Peru
Two key decrees related to Peru’s sustainability are No. 1002, on the acceptance and investment of renewable energy, and No. 012-2011-EM, concerning its regulation. Tax incentives are not yet specifically designed for the renewable sector, but there are general sector incentives for complying with specific requirements. The benefits include reduction of value-added taxes, regimes for energy asset depreciation, and tax stability agreements. Peru presents great potential for generating renewable energies, which has not been exploited efficiently. The country has wind potential of 22,000 MW, with sixty approved concessions to execute studies related to the development of wind power plants, mainly on the country’s coast (Ministerio de Energías y Minas 2018). The average solar energy potential of Peru is estimated in 6.5 kWh/m2/day; the largest solar system, the Rubi, covers 400 hectares and produces 180 MW (Ricaldi-Arévalo 2020). Additionally, more potential projects in the Andes can be explored. Moreover, the government has developed the Master Plan for Renewable Energies in Rural Areas and has set mandatory percentages for biofuels. The country’s hydroelectric potential, estimated at 69,445 MW (Ricaldi-Arévalo 2020)—only 7% is used—requires updating, or a modern, real-time version of the hydro-energy map.
Panama
In 2004, Panama adopted Law Nos. 37 42, 44, 45 to stimulate the nonconventional energy matrix via tax incentives applicable to wind, biomass, gas, biofuel, and biomass power facilities. These laws encompass reductions of income, municipal and import taxes, accelerated depreciation strategies, and additional industry incentives, such as a commercial license fee exemption. Due to these strong efforts, Panama obtains 70% of electricity through renewable resources (IRENA 2018). But as observed in other Latin American countries, Panama has used most hydro sites for large-scale power generation (>100 MW), and only small- to medium-scale power plants may be commercially exploited, increasing the need for other unproven sustainable technologies. Furthermore, Panama has income tax exemptions of 25% to 100% for ten years regarding the type of technology and according to the metric tons of CO2 decreased (Washburn and Pablo-Romero Reference Washburn and Pablo-Romero2019). Panama’s National Energy Plan 2015–2050 aims for 77% of installed power capacity from renewable sources by 2050. To increase use of renewable resources, the government has created research institutions on renewable energies and conservation, and has approved net metering and wind and solar auctions. The planned solar power capacity will be 345 MW, compared with wind’s 662 MW (IRENA 2018). Regarding wind power, Panama has an average estimated wind speed of 5–7 meters per second (m/s) at a height of 200 meters (IRENA 2018). In terms of solar energy, average irradiance is estimated at 4.8 kWh/m2/day; the provinces of Chiriquí and Veraguas have potential for construction of solar parks with the aim of increasing installed capacity.
Conclusion
A large worldwide demand for fossil fuels is constrained to the largest global economies, such as China, a country with the highest population, third-largest economy, and first human case of COVID-19. It is fundamental that oil importer countries phase out oil dependence and promote cleaner technologies. The disruption of the pandemic showed the fragility of economies reliant on the oil’s supply and demand balance. Latin American countries, traditionally exporters of raw materials, should adapt to self-reliant concepts, requiring an intensive social-political problem to override the current oil-based momentum strategies. These countries, in theory, can play a key role in the achievement of the UN Sustainable Development Goals in terms of affordable, reliable, sustainable, and modern energy systems. Therefore, this article has systematically reviewed the current status of the energy sector in Latin America highlighting the progress and potential of renewable sources. Although hydropower is the main renewable resource implemented, the relevance of solar and wind energy have considerably improved but will require governmental investment to maximize their share of the energy matrix. Brazil, Chile, and Mexico are the leaders in renewable energy in both Latin America and the world. Their plethora of natural resources, the use of dams as storage to counteract wind and solar intermittency, and favorable climatic conditions can significantly strengthen the renewable energy sector in Latin America and the Caribbean by providing guarantees and contracts to reduce financial risks to private investors. This transition can help create new job opportunities, protect vulnerable populations, and promote resilience to climate change. However, social conflicts and political instability continue to be the main barrier to overcome in the region. Governments must democratize public policies on renewable energy to bridge the gap among the interests of stakeholders and advance the transition process. Further research can be conducted on integral feasibility long-term projects for each type of renewable source to determine yields, costs, and environmental impacts, thus assisting the decision-making process.


 Open access