


Introduction
Leucite−pollucite crystal structures
The crystal structure of the anhydrous mineral leucite, ideally KAlSi2O6, consists of a three-dimensional, tetrahedrally coordinated silicate framework in which one third of the tetrahedral sites (T-sites) has Al replacing Si, with the polymerised framework consisting of linked four-, six-, and eight-membered rings of TO4 tetrahedra. There are two types of channels in this framework structure; the larger (W) channels are occupied by extra-framework K+ cations, whereas the smaller (S) channels are vacant. The hydrated zeolite mineral analcime (NaAlSi2O6·H2O) has a tetrahedral (Si,Al)O4 framework structurally similar to that of leucite and most samples have been refined as cubic $Ia\bar{3}d$ (e.g. Ferraris et al., Reference Ferraris, Jones and Yerken1972) with Na in the S-sites and H2O in the larger W-sites; analcime is the prototype (‘aristotype’) for the ideal $Ia\bar{3}d$
 ANA framework structure (Baerlocher et al., Reference Ch, Meier and Olson2001). At room temperature the space group of natural leucite is I41/a tetragonal (Mazzi et al., Reference Mazzi, Galli and Gottardi1976). Most natural pollucites have Cs-rich compositions (e.g. Teertstra and Černý, Reference Teertstra1995) in the solid-solution series pollucite (CsAlSi2O6) – analcime (NaAlSi2O6·H2O) with Cs and H2O located in the W-site and Na in the S channels. Natural pollucites have a cubic $Ia\bar{3}d$
 (Beger, Reference Beger1969) or pseudo-cubic $Ia\bar{3}d$
 structure (e.g. C2/c, Kamiya et al., Reference Kamiya, Nishi and Yokomori2008), topologically identical to that of I41/a leucite. The synthetic end-member CsAlSi2O6 pollucite was originally reported to be $Ia\bar{3}d$
 at room temperature on the basis of laboratory powder X-ray diffraction (XRD) studies (Taylor and Henderson, Reference Taylor and Henderson1968; Torres-Martinez and West, Reference Torres-Martinez and West1989; Yanase et al., Reference Yanase, Kobayashi and Mitamura1999), however, later papers reported a I41/a structure based on synchrotron powder XRD or high-resolution powder neutron-diffraction studies (Xu et al., Reference Xu, Navrotsky, Balmer and Su2002; Palmer et al., Reference Palmer, Dove, Ibberson and Powell1997). The boron analogue CsBSi2O6 occurs as the natural mineral kirchhoffite; this is reported to have the tetragonal space group I41/acd (Agakhanov et al., Reference Agakhanov, Pautov, Karpenko, Sokolova and Hawthorne2012) with the same framework topology as leucite and pollucite except that B and Si are ordered onto different T-sites which perhaps reflects their different fourfold ionic radii B3+ 0.11 Å and Si4+ 0.26 Å (cf. Al3+ 0.39 Å) (Shannon, Reference Shannon1976). Because of their macroscopic properties, minerals having leucite/pollucite framework structures are of technological interest with pollucites acting as potential storage materials for Cs radioisotopes in nuclear waste, while pollucites and leucites have found applications in glass ceramics and as dental porcelains (e.g. Gatta et al., Reference Gatta, Rinaldi, Mclntyre, Nenert, Bellatreccia, Guastoni and Della Ventura2009; Hogan and Risbud, Reference Hogan and Risbud1991; Cesar et al., Reference Cesar P.F., Miranda and and Okada2005). The functional property of these materials is related to the presence of channels containing large alkali cations within the framework structure, formed by six-rings of tetrahedra aligned along the crystallographic [111] direction; these are the ‘so-called’ percolation channels that are believed to control the properties of diffusion, ion conductivity and molecular sieving in zeolite-type materials and glasses (Zharadyik et al., Reference Zharadyik, Jirásek, Starý and Sivek2020; Holakovsky et al., Reference Holakovsky, Kratochvilova and Kocirik2006; Jones et al., Reference Jones, Thrall and Henderson2010). Thus, while these minerals are conventionally classified as feldspathoids (Deer et al., Reference Deer, Howie and Zussman1966; Reference Deer, Howie and Zussman2004), they also are considered to be members of the zeolite structure type (Coombs, Reference Coombs1997).
The general formula for leucite, pollucite and other synthetic anhydrous leucite analogues is AY 3+Z2O6, in which A is a monovalent alkali metal cation (K, Rb and Cs), Y is a trivalent cation (Al, B, Fe3+ and Ga) and Z is a quadrivalent cation (Si and Ge) (e.g. Taylor and Henderson, Reference Taylor and Henderson1968; Torres-Martinez and West, Reference Torres-Martinez and West1989; Palmer et al., Reference Palmer, Dove, Ibberson and Powell1997; Martucci et al., Reference Martucci, Pecorari and Cruciani2011). It is also possible to have topologically equivalent leucite structures where one sixth of the T-sites is occupied by divalent cations; such dry-synthesised leucite/pollucite analogues have a general formula A 2X 2+Z 5O12, in which X is a divalent cation (Be, Mg, Mn, Fe2+, Co, Ni, Cu, Zn and Cd) and Z is a quadrivalent tetrahedral cation (Si, Ge and Ti) (e.g. Roedder, Reference Roedder1951; Bayer, Reference Bayer1973; Torres-Martinez and West, Reference Torres-Martinez and West1989, 1984; Kohn et al., Reference Kohn, Dupree, Mortuza and Henderson1991, Reference Kohn, Henderson and Dupree1994; Bell et al., Reference Bell, Redfern, Henderson and Kohn1994a, Reference Bell, Knight, Henderson and Fitch2010; Henderson et al., Reference Henderson, Bell, Kohn and Page1998, Reference Henderson, Bell and Knight2017). All of these compounds are known to occur with room-temperature crystal structures having either cubic $I\bar{4}3d$ , cubic $Ia\bar{3}d$
 or tetragonal I41/a space groups with disordered framework cation T-sites. Note that powder diffraction patterns for cubic $I\bar{4}3d$
 and $Ia\bar{3}d$
 for the same compound would be very similar, and our earlier work (Henderson et al., Reference Henderson, Bell and Knight2017) showed that refining the powder XRD data set for dry-synthesised K2MgSi5O12 using both space groups gave very similar statistical parameters for the fit qualities; it was concluded that much higher resolution in Q on better crystallised samples would be required to resolve this situation for this disordered cubic leucite.
We have also used hydrothermal synthesis methods to obtain lower symmetry phases with a leucite/pollucite framework topology that has ordered framework T-site cations; these have the formula A 2X 2+Si5O12 with K, Rb or Cs in A and Mg, Fe, Mn, Co, Ni, Cu, Zn or Cd substituting for Si in X (see Henderson et al., Reference Henderson, Bell and Knight2017 for a summary of such samples). Initial room temperature, laboratory powder XRD studies suggested that hydrothermally synthesised K2MgSi5O12 had symmetry lower than tetragonal, though Kohn et al. (Reference Kohn, Dupree, Mortuza and Henderson1991) used 29Si magic-angle spinning nuclear magnetic resonance (MAS NMR), to show the presence of 10 Si peaks, which together with two tetrahedral Mg atoms, confirmed a formula with 12 T-sites in a 24 oxygen unit cell. Later multi-technique work showed that such phases are either monoclinic P21/c (A = K) or orthorhombic Pbca (A = Rb or Cs) at room temperature. For example, we used synchrotron powder XRD, together with electron diffraction (in a transmission electron microscope fitted with a liquid-nitrogen-cooled, double-tilt sample holder), and 29Si MAS NMR, to determine the structures of P21/c monoclinic K2MgSi5O12 (Bell et al., Reference Bell, Redfern, Henderson and Kohn1994a) and Pbca orthorhombic Cs2CdSi5O12 (Bell et al., Reference Bell, Redfern, Henderson and Kohn1994b). In addition, high-resolution synchrotron and neutron powder diffraction methods were used to establish that Cs2CuSi5O12 has a Pbca structure (Bell et al., Reference Bell, Knight, Henderson and Fitch2010); the neutron diffraction data provided more reliable oxygen coordinates for this sample. Note that P21/c is a maximal, non-isomorphic sub-group of Pbca. Over the years, the data for Cs2CdSi5O12 and K2MgSi5O12 have provided a firm foundation for determining the structures of orthorhombic Pbca and monoclinic P21/c leucite analogues using either synchrotron (e.g. Bell et al., Reference Bell, Redfern, Henderson and Kohn1994a,b) or laboratory-based (e.g. Bell and Henderson, Reference Bell and Henderson2018) XRD methods. We have also shown recently that leucite analogues containing two different extra-framework cations with formulae RbCsX 2+Si5O12 (X = Mg, Ni or Cd), have Pbca orthorhombic structures with Rb and Cs ordered into separate sites (Bell and Henderson, Reference Bell and Henderson2019).
Hydrothermal crystallisation of framework silicates generally results in well crystallised products with narrower diffraction peaks than starting materials crystallised in air. In various papers we have reported the synthesis of both dry and hydrothermally crystallised samples from the same starting material of crushed glass or powdered gel: e.g. K2MgSi5O12 (Bell et al., Reference Bell, Redfern, Henderson and Kohn1994a); Cs2CuSi5O12 (Bell et al., Reference Bell, Knight, Henderson and Fitch2010); K2CoSi5O12 (Bell and Henderson, Reference Bell and Henderson2018). In the case of the apparent ‘polymorphism’ shown by K2MgSi5O12 it was concluded earlier that the charges and sizes of Mg2+ (as opposed to Al3+) are sufficiently different from those for Si4+ to ensure that the fully-ordered monoclinic phase is formed relatively rapidly, driven by the catalytic effect of water in the hydrothermal experiment (Bell et al., Reference Bell, Redfern, Henderson and Kohn1994a; Henderson et al., Reference Henderson, Cressey and Redfern1995); Kohn et al. (Reference Kohn, Henderson and Dupree1994) mainly used robust, multi-nuclear MAS NMR results to report similar suggestions for P21/c and Pbca leucite analogues with Mg, Zn or Cd as the divalent cation in the framework. Thus, for A 2X 2+Si5O12 leucites the P21/c and Pbca phases are believed to be the thermodynamically more-stable forms for this compound with the cubic $Ia\bar{3}d$ phases being stranded metastable forms at room temperature and pressure (Kohn et al., Reference Kohn, Henderson and Dupree1994; Bell et al., Reference Bell, Redfern, Henderson and Kohn1994a; Henderson et al., Reference Henderson, Cressey and Redfern1995). While preparing a large sample (50 g) of cubic $Ia\bar{3}d$
 K2MgSi5O12 recently for an ongoing neutron diffraction study, one of us (CMBH) found that crystallising finely powdered starting-material glass in air at 1073 K for 5 days gave a single-phase cubic product with a very small background hump due to a residual glassy phase. This sample was reheated at 973 K for 21 days in an attempt to reduce the amount of residual glass, but this produced a second phase that could be matched to the presence of a small amount of the monoclinic polymorph. Reheating the sample at 1173 K for 11 days transformed the sample to a poorly crystallised P21/c monoclinic phase confirming that at these temperatures the ordered phase is indeed the thermodynamically more-stable form of K2MgSi5O12. It seems clear that the hydrothermally crystallised low-symmetry forms of Cs2CuSi5O12 and K2CoSi5O12 are also more stable than their dry-crystallised cubic forms. In turn, it is likely that most of the published reports of syntheses of disordered, cubic divalent cation leucites of stoichiometry A 2X 2+Si5O12 (e.g. Bayer, Reference Bayer1973; Torres-Martinez et al., Reference Torres-Martinez, Gard and West1984; Yanase et al., Reference Yanase, Kobayashi and Mitamura1999) represent metastable phases.
Leucite structure, thermally driven displacive phase transitions
Phase transitions from I41/a (point group 4/m) tetragonal to $Ia\bar{3}d$ (point group m3m) cubic structures have been observed as the temperature increases in natural leucite and synthetic leucite analogues, and it was concluded that the phase transition in KAlSi2O6 leucite is second order, displacive, rapid, reversible and continuous (Taylor and Henderson, Reference Taylor and Henderson1968; Lange et al., Reference Lange, Carmichael and Stebbins1986; Palmer et al., Reference Palmer, Salje and Schmahl1989, Reference Palmer, Dove, Ibberson and Powell1997; Palmer, Reference Palmer and Salje1990; Carpenter et al., Reference Carpenter, Salje and Graeme-Barber1998a). Studies using XRD and differential scanning calorimetry (DSC) suggest that an intermediate I41/acd tetragonal phase occurs between I41/a and $Ia\bar{3}d$
 (Lange et al., Reference Lange, Carmichael and Stebbins1986; Palmer et al., 1990; Newton et al., Reference Newton, Hayward and Redfern2008). A phase transition from $I\bar{4}3d$
 cubic to $Ia\bar{3}d$
 cubic has been reported in the synthetic boron-bearing leucite KBSi2O6 on heating (Martucci et al., Reference Martucci, Pecorari and Cruciani2011). The leucite analogue KGaSi2O6, is isostructural with KAlSi2O6 and also shows a I41/a tetragonal to $Ia\bar{3}d$
 cubic phase transition over the temperature range 673–970 K but this is believed to be an unquenchable, displacive, first-order transition (Bell and Henderson, Reference Bell and Henderson2020). In addition, an unquenchable, displacive, first-order phase transition from P21/c monoclinic to Pbca orthorhombic was observed on heating the hydrothermally-synthesised, leucite analogue K2MgSi5O12 (Redfern and Henderson, Reference Redfern and Henderson1996). Note that the transitions for both KGaSi2O6 and K2MgSi5O12 are smeared out over a range of temperatures with the low- and high-temperature polymorphs coexisting to define ‘regions of coexistence’ (Henderson and Taylor, Reference Henderson and Taylor1982); both of these transitions show clear, positive volume discontinuities (ΔVs). Such features point to first-order phase transitions that might have martensitic mechanisms (Henderson and Taylor, Reference Henderson and Taylor1982; Bell and Henderson, Reference Bell and Henderson2020). Finally, a high-temperature synchrotron powder X-ray diffraction study on Cs2ZnSi5O12 (Bell and Henderson, Reference Bell and Henderson2012) showed a reversible phase transition from Pbca orthorhombic to $Pa\bar{3}$
 cubic, this was the first reported leucite phase transition showing a change from ordered to disordered T-site cations.
It is clear that synthetic analogues of the leucite/pollucite group show a multiplicity of space groups (including I41/a, I41/acd, $I\bar{4}3d$ , $Pa\bar{3}$
 , Pbca and P21/c); all of these are isotropy subgroups of the $Ia\bar{3}d$
 aristotype (Stokes and Hatch, Reference Stokes and Hatch1988) and can be considered to have a pseudo-cubic $Ia\bar{3}d$
 structure (Henderson et al., Reference Henderson, Bell and Knight2017). A universal aristotype crystal structure for such phases has recently been determined by using a non-linear optimisation of the fractional coordinates (Knight and Henderson, Reference Knight and Henderson2019).
We have recently published room-temperature structures for P21/c leucite analogues having the stoichiometry K2XSi5O12 (where X = Fe2+, Co and Zn) and predicted that these should show phase transitions to Pbca high-temperature polymorphs at ~700 K (Bell and Henderson, Reference Bell and Henderson2018). In the present paper we report high-temperature powder X-ray diffraction (HT-XRD) results for the P21/c K2ZnSi5O12 leucite analogue and use calculated spontaneous strain parameters to discuss the mechanism of the phase transitions for both this sample and the equivalent K2MgSi5O12 leucite analogue (Redfern and Henderson, Reference Redfern and Henderson1996). In addition, we provide estimates of the heats of transition for the P21/c to Pbca phase transitions in two samples of monoclinic K2ZnSi5O12 and for the equivalent K2MgSi5O12 leucite analogue.
Experimental methods
Sample synthesis
The K2ZnSi5O12 samples were synthesised (Henderson et al., Reference Henderson, Charnock, Bell and van der Laan2016) from a stoichiometric mixture of high purity K2CO3, ZnO and SiO2 (>99.9% pure). The mixture was ground under acetone for 1 hour and heated overnight in a Pt crucible at 873 K in a standard muffle furnace to break down the carbonate. It was ground again and then heated at 1373 K for 30 minutes; the resultant melt was quenched to a glass by dipping the bottom of the Pt crucible in water. The glass slug was then crushed to a fine powder (<50 μm) and this served as the starting material for synthesis under dry and water-saturated conditions. All of the KZn-leucites were prepared from this finely-ground, slightly K-poor, starting material glass (K1.83Zn1.00Si5.05O12, see Kohn et al., Reference Kohn, Henderson and Dupree1994). Hydrothermally synthesised sample KZS4 was prepared by heating 0.5 to 0.6 g of finely-ground glass powder plus 1 to 2 wt.% H2O in a sealed gold capsule at 843 K in a cold-seal pressure-vessel at 50 MPa water vapour pressure for 19 days; using the same methods KZS1 was synthesised at 843 K, 50 MPa for 8 days and KZS3 at 741 K, 50 MPa for 22 days (Kohn et al., Reference Kohn, Henderson and Dupree1994). Powder XRD showed that KZS3 and KZS4 are single-phase monoclinic P21/c products but that KZS1 also has an impurity, disordered cubic leucite component. The monoclinic K2MgSi5O12 (KMS2) was prepared in the same way at 873 K, 50 MPa for 7 days (Kohn et al., Reference Kohn, Henderson and Dupree1994); note that analysis of the glass starting material gave a composition of K1.97Mg1.01Si5.00O12, very close to the stoichiometric formula. All the hydrothermally synthesised KZS and KMS leucites were checked by laboratory XRD immediately after synthesis and found to have flat backgrounds consistent with the absence of amorphous starting material; in all cases the split peaks suggested that the symmetries were lower than cubic. In this paper we will use the names KZn-Lc and KMg-Lc for these sample compositions instead of the ideal end-member formulae.
Powder X-ray diffraction
An earlier ambient temperature study (Bell and Henderson, Reference Bell and Henderson2018) on hydrothermally synthesised KZn-Lc (KZS4) showed that this sample crystallised in the P21/c monoclinic space group with a structure identical to that of the first cation-ordered leucite analogue, hydrothermally synthesised KMg-Lc (Bell et al., Reference Bell, Redfern, Henderson and Kohn1994a); note however that the glass starting material for this sample has 1.83 K atoms per formula unit (apfu) rather than the end-member value of 2 apfu (see above). High-temperature powder XRD data were collected on this sample using an Anton Paar HTK1200N high-temperature stage mounted on a PANalytical X'Pert Pro MPD using CuKα radiation, a Ni β filter and a PIXCEL-1D area detector.
Note that when collecting XRD in this high-temperature stage the flat plate sample holder is only ~16 mm in diameter. To minimise any X-ray scattering from outside the sample the beam size defining slits and mask between the X-ray tube and the sample have to be smaller than that normally used for ambient temperature XRD measurements done in the open air. Therefore, the X-ray flux on the sample will be reduced and the resultant data quality will be poorer than normal ambient temperature measurements.
Initial high-temperature data (Run 1) were collected over the angular range 10–100°2θ for 16 temperature steps between 298 and 973 K and cell parameters after cooling the sample from 973 K to room temperature were also determined for Run 1 (Table 1). Further high-temperature data (21 temperature steps, Run 2) on the same sample were then collected from 10–80°2θ between 773 and 973 K; Run 2 experiments were carried out over smaller temperature steps than those for Run 1 to provide a more detailed study of how the phase assemblage might change through a phase transition. Run 2 cell parameters are given in Table 2. Rietveld refinements (Rietveld, Reference Rietveld1969) using FULLPROF (Rodriguez-Carvajal, Reference Rodriguez-Carvajal1993) were done for both Run 1 and Run 2 data. Run 1 data up to 823 K and Run 2 data up to 843 K were single-phase-refined using the P21/c monoclinic cation-ordered structure of K2ZnSi5O12 (Bell and Henderson, Reference Bell and Henderson2018) as a starting model. Run 1 data at 898 and 973 K and Run 2 data above 868 K were single-phase-refined using a Pbca orthorhombic cation-ordered structure isostructural with Cs2CdSi5O12 (Bell et al., Reference Bell, Redfern, Henderson and Kohn1994b). However, this approach for P21/c structures gave a/c unit cell axis ratios greater than 1 while those for Pbca cells were less than 1; this clearly does not match the expected result either side of the phase transition. It is clear that the setting used for Pbca does not match that for P21/c and to cope with that inconsistency the highest temperature, single-phase atomic coordinates for P21/c were transposed to match those for the lowest temperature coordinates for a single-phase Pbca cell. These were then used as the starting model for the high temperature Pbca cells, which gave comparable results either side of the phase transition with matching cell parameters. The structural refinements were then carried out as follows.
Table 1. Variation of K2ZnSi5O12 lattice parameters and phase proportions 294–973 K (Run 1).
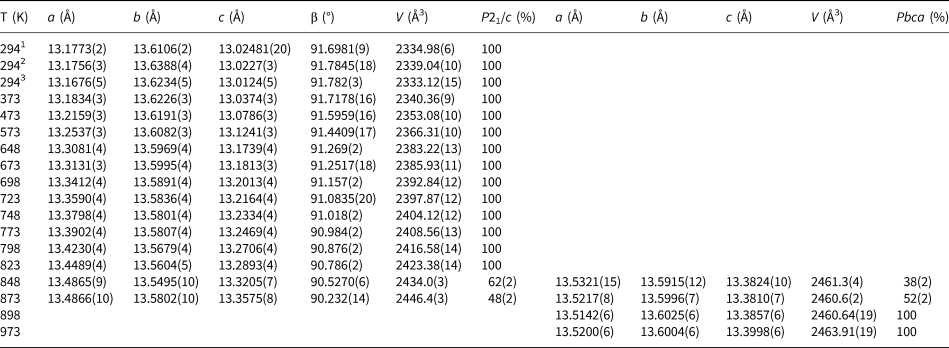
1 Indicates original ambient temperature data (Bell and Henderson. 2018); 2 indicates new data collected in furnace before heating Runs; 3 indicates new data collected in the furnace after heating.
Table 2. Variation of K2ZnSi5O12 lattice parameters and phase proportions 773–973 K (Run 2).

Tetrahedrally coordinated Si–O distances were soft-constrained initially to 1.61(2) Å and tetrahedrally coordinated Zn–O distances were soft-constrained to 1.93(2) Å. Scale factor, zero point, background, lattice, profile, atomic coordinates and temperature-factor parameters were refined. Temperatures factors for all sites containing Si were constrained to have the same value. Temperatures factors for all sites containing O were also constrained to have the same value (though not the same as Si). For P21/c refinements all four K-sites were constrained to have the same temperature factor. However, for Pbca refinements the temperature factors for the two K-sites were allowed to refine freely. For P21/c refinements both Zn-sites were constrained to have the same temperature factor, however, for Pbca refinements there was only one Zn-site so the temperature factor for this site was allowed to refine freely.
Structural refinements for the two-phase regions were more complex. Thus, the Run 1 data at 848 K and 873 K and the Run 2 data 848–863 K were refined with two KZn-Lc phases, P21/c monoclinic and Pbca orthorhombic. Due to severe peak overlap no atomic coordinates or temperature factors were refined for these coexisting phases, only scale factor, zero point, background, lattice and profile parameters were refined. For the Run 1 two-phase refinements the P21/c coordinates and temperature factors were fixed at those from the 823 K refinement and the Pbca coordinates and temperature factors were fixed at those from the 898 K refinement; the same approach was used for Run 2 two-phase refinements. Tables 3 (Run 1) and 4 (Run 2) show the profile fitting parameters for these Rietveld refinements. Note how the R-factors and χ2 parameters tend to be larger in the two-phase regions for single-phase refinements compared to those for two-phase refinements. For example, the Run 2 (Table 4) mean χ2 parameter for the monoclinic stability field samples (P21/c) is 1.41 ± 0.03 and for the orthorhombic (Pbca) samples is 1.48 ± 0.05, compared with χ2 values for P21/c+Pbca, P21/c, Pbca at 853 K of 1.49, 1.52 and 1.96 and at 863 K of 1.59, 1.80 and 1.62, respectively.
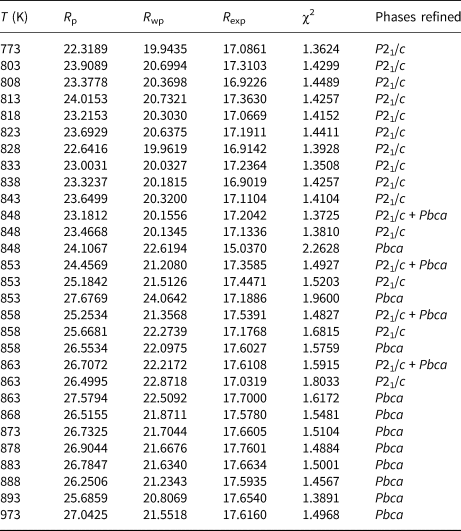
Table 4. Variation of K2ZnSi5O12 Rietveld refinement background subtracted R-factors 773–973K (Run 2).
The Rietveld-refined, high-temperature data provides reliable unit cell parameters and phase proportions, and the atomic coordinates for the single-phase-field temperatures provide useful information on how the tetrahedral framework shows cooperative rotations as it expanded with increasing temperature and became more symmetrical around the large cavity cations located in the [111] channels (see later VESTA plots in Fig. 4). However, we are not able to report reliable bond distances and bond angles for the many independent T-sites and cavity-cation-sites in these framework structures. Thus, Tables 3 and 4 show R-factors of ~20 for these refinements. The R-factors for the refinement of the P21/c ambient temperature structure of KZn-Lc were ~1 (Bell and Henderson, Reference Bell and Henderson2018). This is similar to the results that we reported on our high-temperature powder XRD study on the phase transition in KGaSi2O6 (Bell and Henderson, Reference Bell and Henderson2020). For the KGaSi2O6 leucite sample it was possible to obtain useful atomic parameters for the low-temperature tetragonal and high-temperature cubic phases but, as mentioned above, this is more difficult for the multi-site, lower symmetry monoclinic and orthorhombic KZn-Lc polymorph data reported here. Thus, the structural interpretations and spontaneous-strain analysis reported here for KZn-Lc are based mainly on the phase stability relations and on the high-quality unit cell parameters.
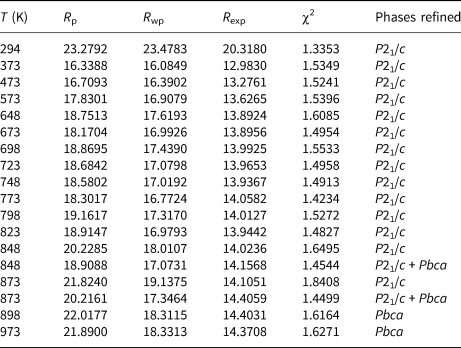
Table 3. Variation of K2ZnSi5O12 Rietveld refinement background subtracted R-factors 294−973K (Run 1).
The crystallite sizes for two samples of KZn-Lc (KZS4 and KZS3), and for the small amount of P21/c KMg-Lc leucite (KMS2) that was still available for study, were obtained for powder samples mounted on silicon wafers which were scanned using an Empyrean XRD with CoKα X-rays. An identical scan was done for a silicon standard to calibrate instrumental peak widths. The PANalytical HighScore Plus automatic crystallite size Rietveld program was used to obtain crystallite sizes based on the whole powder diffraction pattern, not just a few strong low-angle peaks. The estimated room-temperature crystallite sizes are given in Table 5 along with room temperature unit cell parameters for the samples studied by DSC.
Table 5. Unit cell parameters, crystallite sizes (XRD) and transition heats (DSC).
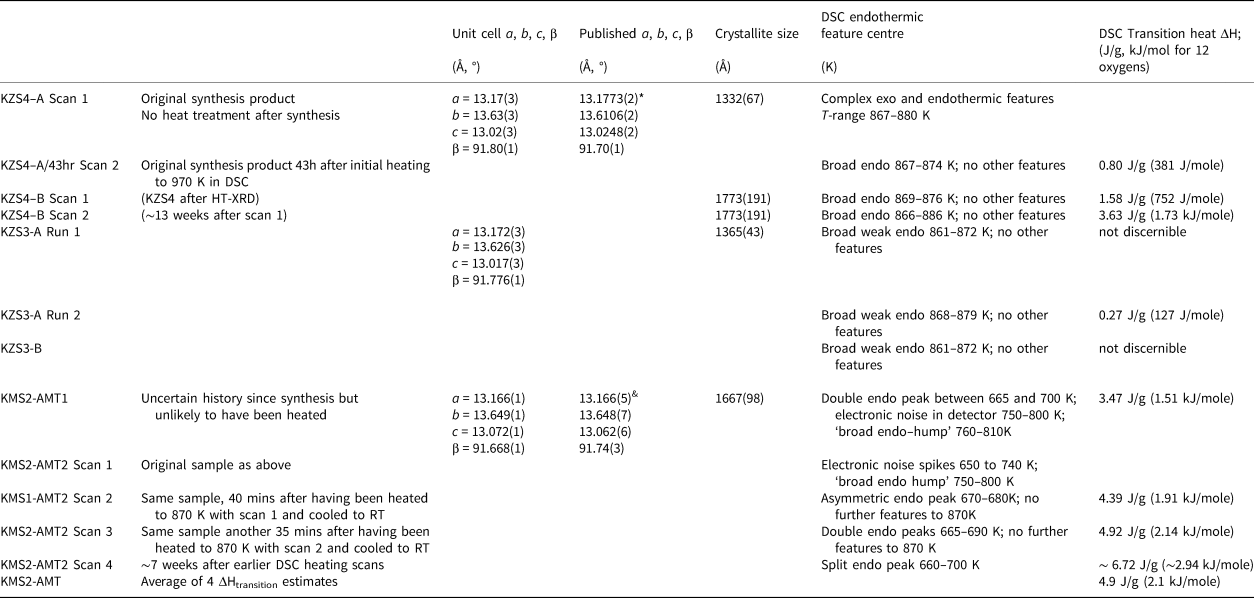
* Bell and Henderson (Reference Bell and Henderson2018); & Bell et al. (Reference Bell, Redfern, Henderson and Kohn1994a)
The temperature-dependent unit cell parameters for KZn-Lc reported in Table 1 were used to investigate the spontaneous strains shown by the ferroelastic monoclinic phase as it approaches the phase transition to the orthorhombic paraelastic phase. For these calculations we followed the general approach of Carpenter et al. (Reference Carpenter, Salje and Graeme-Barber1998a) and that for natural leucite KAlSi2O6 (Palmer, Reference Palmer and Salje1990) where the strain for a particular unit cell parameter (x T) at a particular temperature in the monoclinic phase is defined as (x T – x 0)/ x 0, where x 0 values are calculated by linear extrapolations of the high-temperature cell parameters for the paraelastic orthorhombic phase into the lower temperature monoclinic phase stability field. Thus a 0, b 0, c 0, β0 and V 0 are provided for the monoclinic phases. Figure 1 shows how linear extrapolations of the KZn-Lc orthorhombic high-temperature values for a, b, c, β and V provide estimates for a 0, b 0, c 0, β0 and V 0 at the temperatures for the Run 1 monoclinic polymorphs; note that the fitting equations used are those obtained for Run 2 (orthorhombic phase cell parameters between 868 and 973 K) as only 3 data points are available for the Run 1 data. In addition, the temperature data points chosen for the Run 2 high-temperature orthorhombic phases include only single-phase data points from above the phase transition. We also fitted the temperature variations for orthorhombic phases for averages of both Run 1 and Run 2 data; these gave different coefficients to those obtained for Run 2 data alone, though the strain parameters calculated provided overlapping data points for all parameters (except for b that shows very small changes with temperature) on the diagrams discussed in the Results. Note that the cell parameter ‘strains’ calculated will reflect errors involved in the estimation of x 0 values with the largest errors occurring at the temperatures furthest from the phase transition. The a 0, b 0, c 0 and V 0 values for KMg-Lc were obtained in a similar way from the parameters reported in Table 1 (Redfern and Henderson, Reference Redfern and Henderson1996); Henderson (Reference Henderson2021) has already made a preliminary study of the spontaneous strains for the KMg-Lc data in a review of composition, thermal expansion and phase transitions in framework silicates.
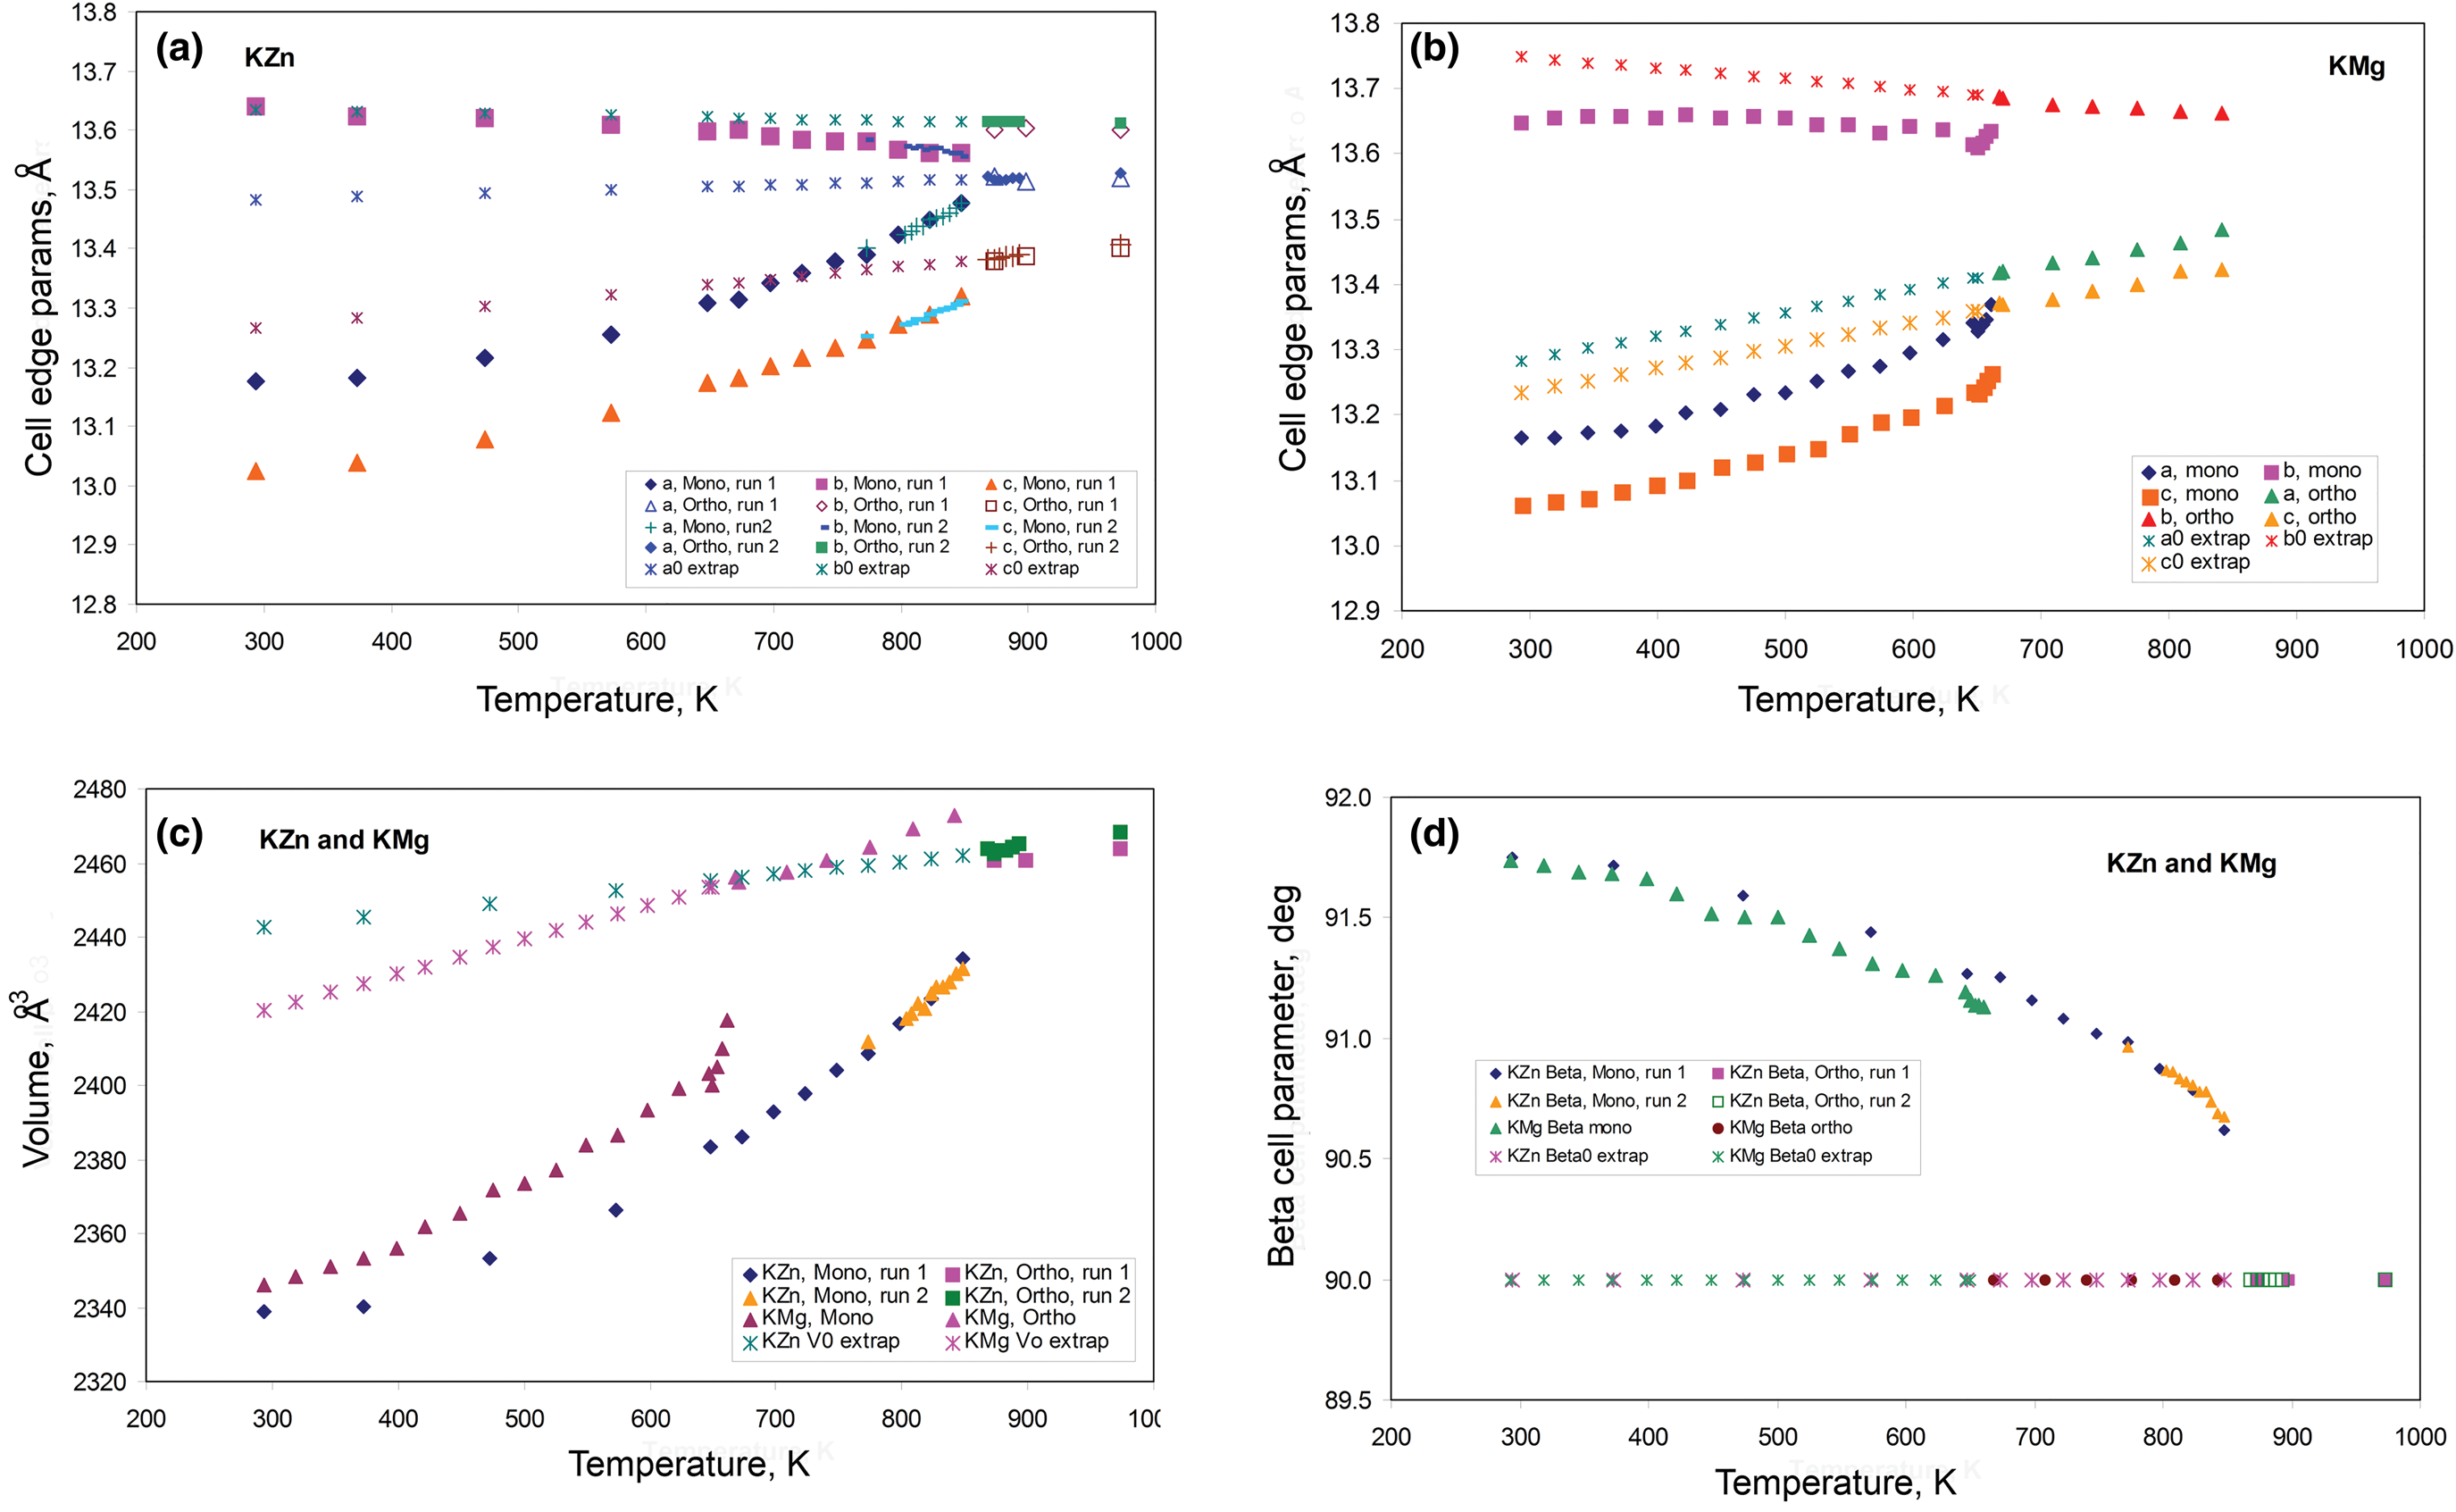
Fig. 1. Comparison of high-temperature unit cell parameters for KZS-Lc, sample KZS4 (this work) and KMg-Lc, sample KMS2 (Redfern and Henderson, Reference Redfern and Henderson1996). (a) a, b and c cell parameters for KZS4 (Runs 1 and 2); (b) a, b and c cell parameters for KMS2; (c) V cell volumes for KZS4 (Runs 1 and 2) and KMS2; (d) β angles for KZS4 (Runs 1 and 2) and KMS2. Also shown are the high-temperature orthorhombic lattice parameters extrapolated into the monoclinic polymorph stability field; Run 2 fits are used to model these values for KZn-leucite and the published Redfern and Henderson (Reference Redfern and Henderson1996) data are used for KMg-Lc.
Thermal analysis
A Netsch STA (Simultaneous Thermal Analyzer) 409PG Luxx®) was used to collect differential thermal analysis (DTA) data on a sample of KZS4. Powder (100 mg) was loaded into an Al2O3 sample cup, the sample was heated at 10 K/minute over the temperature range 303–1554 K, and under a flow of air at 40 ml/minute. From the temperature difference between KZn-Lc powder and an empty Al2O3 sample cup a DTA trace was plotted; this showed a weak endothermic effect at ~860–870 K. A thermogravimetric analysis (TGA) scan was performed simultaneously with the DTA; this showed a weight loss of ~0.2 wt.% up to 400°C however, weight data values at higher temperatures were unreliable reflecting the very small change in mass; unfortunately, no further sample was available to assess repeatability.
A more informative thermal analysis study was subsequently carried out by differential scanning calorimetry (DSC) using a Perkin Elmer DSC8000 system. This equipment has a double furnace mode so that the heat flow change at the sample against that on the reference material is continually monitored. Samples were analysed using crimped Al capsules that were pierced with a syringe needle to allow venting; note that Al melts at 660°C (933 K) that restricts the top temperature for the DSC analyses to ~883 K. Powdered samples (20 to 30 mg, accurately weighed) were heated at a rate of 10 K/min or 20 K/min over the temperature range 523 to 883 K. The reference to the sample was an empty, crimped and pierced Al capsule. Both sample and reference were purged with nitrogen gas using a flow rate of 40 ml/minute. The instrument was calibrated for temperature and sensitivity using indium and zinc standards, and the standard procedure within the Pyris TM software. We found that the α–β quartz phase transition occurs at 852 K with a ΔH of 5.5 J/g compared with a suggested value of 6.0 J/g for a finely ground powder at 848 K (Ghiorso et al., Reference Ghiorso, Carmichael and Moret1979).
For the leucite samples studied we found that the low heat changes were difficult to discern above the baseline on the first DSC heating experiments because the samples showed complex heat effects. The temperature ranges for the thermal properties are given in Table 5 together with estimated heats of transition (ΔHtransition) determined from DSC scans following the method of Lange et al. (Reference Lange, Carmichael and Stebbins1986).
Powder XRD results and discussion
Thermal expansion characteristics and phase relations for KZn-Lc
The unit cell parameters for KZn-Lc (sample KZS4) at temperatures from 298 to 973 K (Run 1) are given in Table 1 and Fig. 1 shows how these refined lattice parameters vary with temperature; note that the first row gives the original unit cell parameters at room temperature (Bell and Henderson, Reference Bell and Henderson2018) while data in rows 2 and 3 give cell parameters determined in the heating cell before and after Run 1 heating experiments. Table 3 shows how the background subtracted R wp, R p, R exp and χ2 parameters from Rietveld refinements vary with temperature. For comparison, Fig. 1 also shows equivalent parameters from Redfern and Henderson (Reference Redfern and Henderson1996) for monoclinic KMg-Lc. For the KZn-Lc Run 1 data, the a and c parameters (Fig. 1a) show little significant change between 294 and 373 K but then have steadily increasing expansion rates up to ~650 K and then both show a slightly greater rate of increase up to 870 K. The b parameters initially show little significant change up to 600 K followed by a slight decrease to 870 K (Fig. 1a). At the highest temperatures the monoclinic a parameter is only slightly smaller than that for b (b/a ≈ 1.006 at ~850 K). All three cell edges then show a step up to higher values at ~870 K for the orthorhombic structures, and then only small increases up to the highest temperature studied (973 K). The β angle (Fig. 1d) shows a small decrease up to 573 K followed by a better defined and faster decrease up to 778 K and then from 898 K the orthorhombic β parameters are plotted at 90°. For Run 1, the cell volumes (Fig. 1c) show little change up to 373 K followed by steadily increasing values up to 848 K and then a step up to the volumes for the orthorhombic phases. It is clear that the monoclinic to orthorhombic transition is characterised by a small positive ΔV. On cooling, the transition is reversible returning the room-temperature cell edges to values close to, but slightly smaller than, those determined at room temperature before heating (see Table 1). This is consistent with the P21/c to Pbca being a displacive transition similar to that for KMg-Lc leucite (Redfern and Henderson, Reference Redfern and Henderson1996).
Figure 2 shows how the positions of the (004), (040) and (400) Bragg reflections in KZn-Lc move to lower 2θ values over the temperature range 833–878 K as the crystal structure transforms from P21/c monoclinic, through the 2-phase region, to Pbca orthorhombic. More detailed Rietveld refinement results for the KZn-Lc sample are provided in Fig. 3 and show clear differences reflecting the phase stability changes. This figure shows difference plots for XRD data collected at 803, 868 and 893 K with the full diffraction pattern given in the left-hand panels and the main (400) suite of peaks over the range 25.5 to 28.0°2θ given in the right-hand panels. Thus, at 803 K (Fig. 3a,b) only a monoclinic phase is present and the three principal axes (040, 400 and 004) are well resolved and have symmetrical shapes. The shoulder on the high angle flank of the peak at ~27°2θ is due to weaker Bragg reflections that are not part of the main (400) suite of peaks for this monoclinic phase; note the absence of a clear peak at ~27.3°2θ at this temperature. At 858 K two phases are present and the first peak in Fig. 3d is now broader than before with a shoulder ~⅔ of the way up the low 2θ flank, which can be assigned to the (040) peak for an orthorhombic phase (denoted (040)o). The crest of this broad peak has a complex form which is explained by the existence of three overlapping Bragg reflections, namely (040)m (m = monoclinic), (004)o, (400)m, in that order. Note that the Miller indices assigned here are based on the model P21/c and Pbca structures that have reversed a and c parameter values. The peak at ~ 26.7°2θ appears to be asymmetric, consistent with it having two components, namely (400)o and (004)m. There is now a clear peak at ~27.3°2θ, which is not part of the main (400) suite of peaks, consistent with the presence of an abundant orthorhombic phase in the mixture. At 893 K only an orthorhombic phase is present, but the first strong peak (Fig. 3f) is formed by the overlapping (040)o and (004)o reflections. The peak at ~27.3°2θ is now stronger and narrower than that at 863 K, consistent with the orthorhombic phase being the only component present above the phase transition. Even though peak overlap is more serious for the mixed phases in this ‘region of coexistence’, the Rietveld refinement gives reliable proportions for the two coexisting phases (Tables 1 and 2); indeed, the proportion of the monoclinic phase (y) decreases steadily with increasing temperature with a linear fit defined by y = –0.0357 × T (K) +31.143 (R 2 = 0.96). We conclude therefore that our data for KZn-Lc show the same two-phase characteristics for the phase transition as found for the higher resolution KMg-Lc data (Redfern and Henderson, Reference Redfern and Henderson1996); indeed the peak features for KMg-Lc in the two-phase region (figure 4, Redfern and Henderson, Reference Redfern and Henderson1996) show exactly the same features as described above for the KZn-Lc sample.
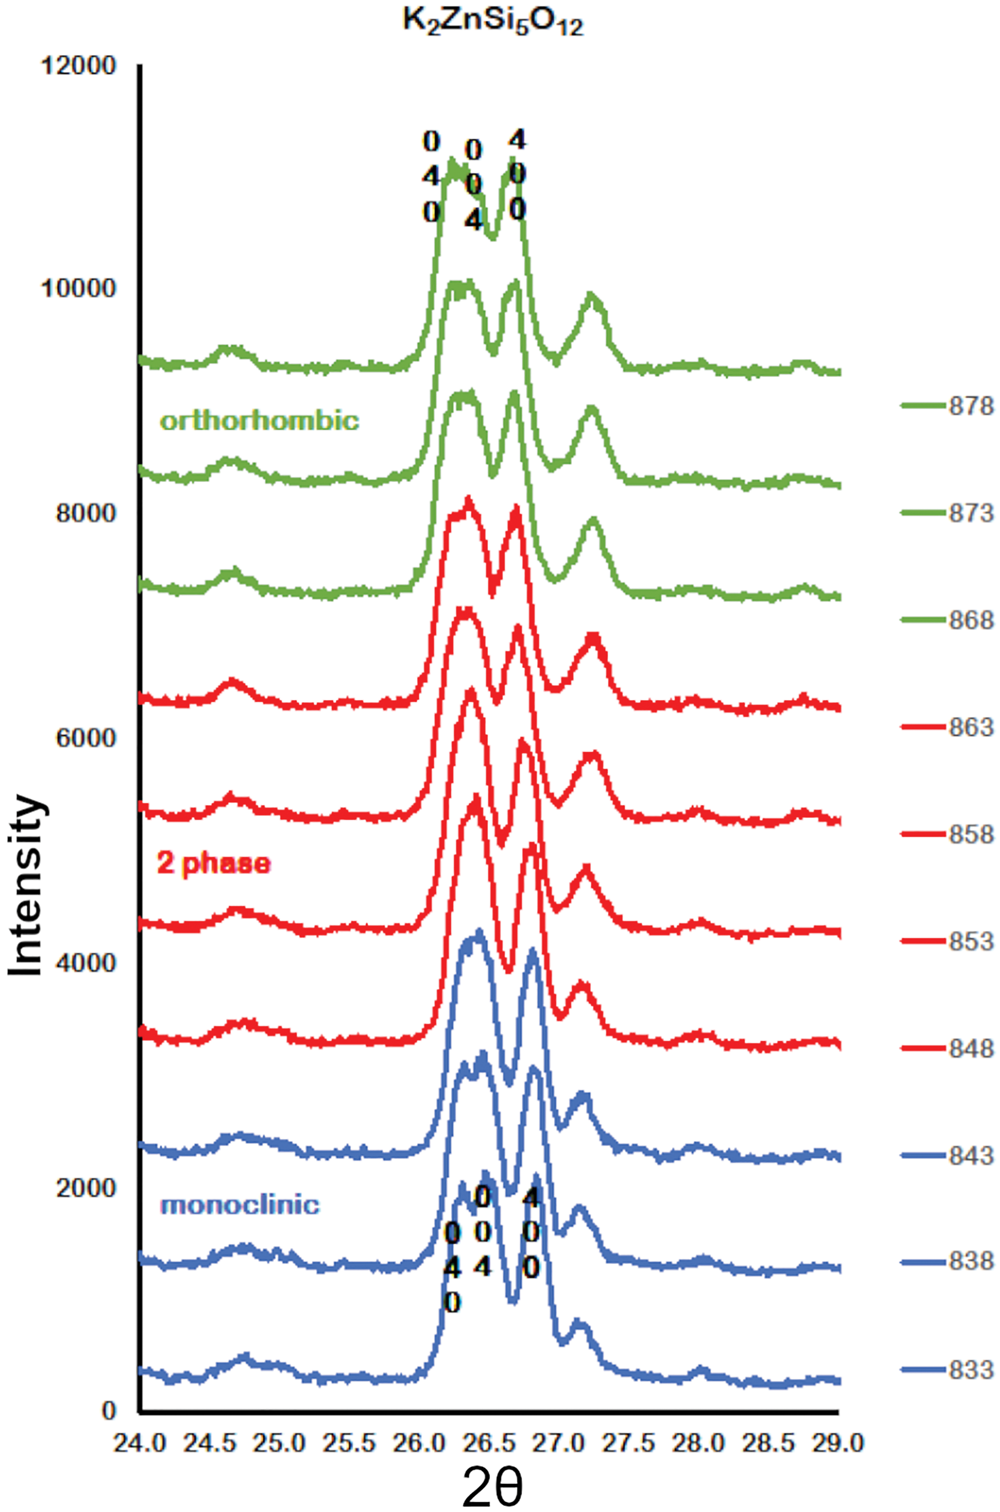
Fig. 2. Plots showing Run 2 XRD data for KZS4 from 24 to 29o2θ over the temperature range 833 to 878 K. Monoclinic (040), (400) and (004) Bragg peaks move to lower 2θ angles through the 2-phase region into the orthorhombic phase. Monoclinic data, blue; 2-phase data, red; orthorhombic data, green.

Fig. 3. Rietveld plots for KZS4 Run 2 experiments: (a) 803 K 10–80°2θ, (b) 803 K 25.5–28°2θ, (c) 858 K 10–80°2θ, (d) 858 K 25.5–28°2θ, (e) 893 K 10–80°2θ, (f) 893 K 25.5–28°2θ. Blue dots show observed data points, red lines show calculated profiles, green lines show difference between observed and calculated, black crosses show positions of Bragg reflections.

Fig. 4. VESTA plots for KZS4 looking down the [111] channel in the silicate framework structure. Purple spheres represent K+ cations, red spheres represent O2– anions, green tetrahedra represent ZnO4 units and blue tetrahedra represent SiO4 units. (a) 773 K, monoclinic P21/c; (b) 843 K, monoclinic P21/c; (c) 868 K, orthorhombic Pbca; (d) 973 K, orthorhombic Pbca.
VESTA plots (Momma and Izumi, Reference Momma and Izumi2011) at temperatures chosen to demonstrate the framework changes through the phase transition are given in Fig. 4 for KZn-Lc at 773 K (monoclinic single phase), 843 K (monoclinic just below the region of coexistence), 868 K (orthorhombic just above the region of coexistence) and 973K (orthorhombic single phase); these plots show the central [111] channel of the leucite crystal structure containing K+ cations. Note how the central channel (effectively the cavity cation percolation channel) changes with increasing temperature due to a cooperative rotation of linked tetrahedra. This is particularly apparent over the phase transition from P21/c monoclinic to Pbca orthorhombic corresponding to the expansion of the unit cell over the transition. Note that this channel is more symmetrical for the orthorhombic polymorph at 973 K than for the monoclinic polymorph at 773 K reflecting a trend towards a more pseudocubic high-temperature structure (i.e. the b/c ratio at 773 K is 1.025 compared to 1.015 at 973K).
Data for the temperature dependences of the unit cell parameters for monoclinic KMg-Lc (Redfern and Henderson, Reference Redfern and Henderson1996) are also shown here in Fig. 1b, c and d, Note that the two phase region for the KMg-Lc compound spans the temperature range from 647 to 670 K and that, for the monoclinic phases, the upturn at ~650 K for a, b, c and V, and the downturn for β, are due to the presence of the orthorhombic phase distorting the shapes of the monoclinic diffraction peaks. The unit cell expansion trends for KMg-Lc are very similar to those described here for KZn-Lc; both samples show very similar values for all parameters and similar rates of change with increasing temperature reflecting the similar sizes of the divalent Zn and Mg cations in tetrahedral coordination (0.60 and 0.57 Å, respectively; Shannon, Reference Shannon1976); both KZn-Lc and KMg-Lc analogue leucites have unit cell parameters b >> a > c. However, note that KMg-Lc shows a wider difference between the b versus a and c parameters at the phase transition with a b/a ratio of 1.021 compared with a value of 1.006 for KZn-Lc (cf. b/c = 1.028 and 1.017, respectively). This is clearly related to the former showing the phase transition at a much lower temperature (~650 K) compared with ~850 K for KZn-Lc (see section on ‘Characteristics of the monoclinic P21/c – orthorhombic Pbca transition in leucite analogues’). Redfern and Henderson (Reference Redfern and Henderson1996) pointed out that, as temperatures increased, the orthorhombic cell parameters for KMg-Lc tended to converge towards a higher symmetry structure. For example, the b/a ratio would extrapolate to 1.0 at ~1000 K. Redfern and Henderson speculated that a tetragonal phase with space group Ibca would be a possible polymorph though stressed that it would have disordered T-sites. They also suggested that leucite analogues with a ZnSi5O12 framework might show an order–disorder relationship at a phase transition. Indeed, Bell and Henderson (Reference Bell and Henderson2012) reported such an order–disorder reversible transition in the Cs2ZnSi5O12 leucite analogue consistent with much faster Zn–Si tetrahedral exchange kinetics than for Mg–Si (also see Kohn et al., Reference Kohn, Henderson and Dupree1994). We have shown for the monoclinic KZn-Lc leucite analogue that the b/a ratio has decreased to 1.006 at ~850 K and extrapolation of this trend for the Run 2 experiments suggests that b and a would have merged at ~873 K. If the transition to T-site ordered orthorhombic Pbca had not occurred, we speculate here that the transition might have been to a hypothetical disordered Ibca structure and ultimately to cubic disordered Ia $\bar{3}$ d at an even higher temperature.
To return to known leucite analogue structures, Redfern and Henderson (Reference Redfern and Henderson1996) pointed out that the phase transition for KMg-Lc showed the coexistence of both monoclinic and orthorhombic polymorphs over a small temperature range (~25 K). For that work a Guinier X-ray camera (Huber; monochromatic CuKα1 radiation) was used to study the KMg-Lc sample and the higher resolution of this equipment provided reliable evidence for the coexistence of two phases (see Redfern and Henderson, their figure 4). The Run 2 experiments on KZn-Lc reported here were carried out at smaller temperature steps through the phase transition than for Run 1 in order to establish if both phases coexisted over a temperature range between the beginning and end of the transition, similar to that reported for KMg-Lc; Run 2 experiments also allow a clearer temperature range for the phase transition to be established. These data are given in Tables 2 and 4 and are shown in Fig. 1 with different symbols to those for Run 1 data. It is clear that the data sets of unit cell parameters for Run 1 and Run 2 agree within experimental error. Even though the Run 1 room-temperature cell edges are smaller after the heating experiments than before, this has not affected the high-temperature physical properties of this sample (KZS4-A). Thus, for Runs 1 and 2, the a and c parameters show steady increases and b steady decreases with increasing temperature up to ~870 K (Fig. 1a). Above 870 K the orthorhombic phases all have lattice parameters displaced to higher values than the monoclinic trend; the orthorhombic lattice parameters show only a small increase with increasing temperature. Note that lattice parameters at temperatures from 848 to 863 K are shown for both the coexisting monoclinic and orthorhombic polymorphs but peak overlaps inevitably lead to less reliable parameters for the ‘mixed’ phases, especially for the orthorhombic cells (Fig. 1a); however, these cell-parameter ‘shifts’ are not random and are predictable based on the monoclinic phase having lower a, b, c and V together with higher β than the equivalent orthorhombic phase at the transition temperatures. As expected, the β angle (Fig. 1d) and volume (Fig. 1c) show clear discontinuities between the monoclinic and orthorhombic phases, with the volume trend having a positive volume discontinuity (ΔV) of ~1.2%.
Heat effects associated with the phase transition in KZn-Lc and KMg-Lc
Thermal effects observed for KZn-Lc sample
An initial DTA scan of a powdered sample of KZn-Lc (KZS4) was obtained over the temperature range 294–1281K. This scan (Fig. 5a) shows a weak endothermic feature smeared out over a temperature range from ~855 to 880 K, which can be matched clearly to the P21/c to Pbca phase transition observed by the high-temperature powder XRD study. In order to study the heat effects associated with the phase transition in more detail, preliminary DSC scans were carried out with a new aliquot of powdered KZS4 that had not been reheated since its original synthesis (denoted KZS4-A). The results for the temperature ranges over which thermal effects were observed and for the heats of transition observed for endothermal peaks are summarised in Table 5 and a DSC scan for key Runs are shown in Figs 5b, 5c and 5d. The first scan of the KZn-Lc sample (KZS4-A, scan 1) shows complex, sinuous undulations over the temperature ranges 834–840 K and 867–873 K that might be related to a series of exothermic and endothermic effects (see top scan in Fig. 5b). The same sample was scanned again after 43 hours at room temperature (KZS4-A scan 2; see middle scan Fig. 5b); this showed a fairly symmetrical endothermic effect over the range 867–875 K with a ΔH of 0.80 J/g (equivalent to a value of 380 J/mol on the basis of the simplest molecular formula for KZn-Lc (MW 476.04) with 12 oxygens) (Table 5). It is clear that initial heating of the sample using DSC caused some change in the sample so that the later scans with the same sample show much simpler thermal behaviour that allow the heat of the monoclinic to orthorhombic transition to be estimated from the area defined by the endothermic feature (denoted ΔHtransition). In order to assess this effect further the KZS4 sample that had been used in the HT-XRD experiments was scanned using DSC (denoted KZS4-B here). For this experiment, a clear endothermic effect over the temperature range 869–876 K is the only thermal feature present (see lower scan in Fig. 5b); this feature defines a ΔHtransition of 1.58 J/g (752 J/mole) (Table 5) though repeat scans showed significant changes in the shape of the DSC base-line leading to variable ΔH values. After 13 weeks at room temperature and following adjustments to the DSC data collection conditions, KZS4-B, scan 2 provided the highest ΔHtransition observed for this compound with a value of 3.65 J/g (1.74 kJ/mole) (Table 5, Fig. 5c).

Fig. 5. Representative DTA and DSC scans for hydrothermally synthesised monoclinic P21/c KZn- and KMg-leucite analogues: (a) DTA scan for KZn-Lc sample KZS4-A as-synthesised sample; (b) DSC scan for KZn-Lc sample KZS4-A as-synthesized sample; (c) DSC scan for KZS4-B, after HT-XRD studies and after one DSC heating cycle; (d) KMg-Lc sample AMT2 after three DSC heating cycles. Further information is given in Table 5 along with details of enthalpy of transition measurements.
Two other hydrothermally synthesised samples of KZn-Lc leucite were also available for study, however it was found that new powder XRD scans at room temperature for one sample (KZS1) had both ordered monoclinic and disordered cubic phases present; this sample was not studied further here. Nevertheless new powder XRD scans for the second sample (KZS3, see the section on ‘Sample synthesis’) showed that it is a single phase monoclinic analogue. Note that the room-temperature cell parameters and crystallite sizes for unheated samples of KZS4 and KZS3 are the same within experimental error (Table 5). The first DSC scan for KZS3 (KZS3-A) did not show the complicated exothermic/endothermic features of KZS4-A on the first heating; instead, it gave a very weak endothermic feature, over the temperature range 861–872 K; this feature is much weaker than those found for KZS4 and does not provide a reliable value for the transition heat. However, a second scan of sample KZS3-A gave a similar, weak endotherm from 868 to 879 K for which we have obtained a tentative transition heat of ~0.27 J/g (127 J/mole). A second sample (KZS3-B) also gave very weak heat effects at 862 to 872 K, but it is not possible to obtain a reliable estimate for its heat of transition. Although we were not able to assign a robust transition heat for the KZn-leucite KZS3, the temperature range matches that for KZS4 and clearly reflects the occurrence of the same monoclinic–orthorhombic phase transition for this compound. It is also clear that the thermal behaviour of the monoclinic KZn-Lc leucites is very sample dependent even though their room-temperature cell parameters are essentially the same and that the ΔHtransition value estimate for KZS3 is much smaller than that found for KZS4; we will consider the possible reasons for such differences below (see section ‘Possible chemical and structural controls of heat effect differences observed’).
Thermal effects observed for a KMg-Lc sample
Only one hydrothermally crystallised sample of KMg-Lc was synthesised at Manchester by CMBH, some 35 years ago, and portions of this were studied shortly after that at Warwick and Bristol (by Simon Kohn), at Cambridge (by Simon Redfern), at Daresbury and Sheffield (by AMTB), and at Manchester (by CMBH). We were keen to obtain DSC data on a sample of this compound to compare with results for KZS-Lc and only one possible small sample labelled AMT was located at Manchester however the history of usage of that sample was obscure. Further investigation using XRD at Sheffield Hallam University show this to be undoubtedly monoclinic KMg-Lc with room-temperature cell parameters matching those reported by Bell et al. (Reference Bell, Redfern, Henderson and Kohn1994a) and Redfern and Henderson (Reference Redfern and Henderson1996) (Table 5). In addition the crystallite size of the original sample was found to be ~1670 Å, which shows it to be the best crystalline synthetic leucite we have studied here. Two small samples of the original, as-synthesised sample (denoted KMS2-AMT1 and KMS2-AMT2) have been scanned by DSC but the first scan of each gave complicated patterns (Table 5). The first scan for KMS2-AMT1 gave a clear double endotherm at 665 to 700 K that provides an estimate for the ΔHtransition of 3.47 J/g (1.51 kJ/mole); note that the temperature region for this heat effect is close to the region of coexistence of 646–671 K reported by Redfern and Henderson (Reference Redfern and Henderson1996). However, the region from ~750 to 800 K showed spikes of electronic-like noise superimposed on a poorly defined feature that might not be significant. Scan 1 for a new aliquot of this sample (KMS2-AMT2) showed spikes of electronic noise from 650 to 740 K and an endothermic-like feature from 750 to 840 K. We speculate that some of the other features suggest that the sample is undergoing some initial changes in composition or structure. Further heating scans were therefore carried out on sample KMS2-AMT2. Scan 2 was started 40 minutes after cooling Scan 1 to room temperature and showed a fairly narrow endothermic peak (670–680 K) giving a ΔHtransition of 4.39 J/g (1.91 kJ/mole) (Table 5). Scan 3 on the same sample was started 35 mins after scan 2 had been cooled to room temperature; this scan showed a clear double endothermic peak from 665 to 690 K and gave a ΔHtransition value of 4.92 J/g (2.14 kJ/mole) with clear baselines showing no other thermal features (Table 5). After adjustment to the baseline collection parameters a final scan (obtained 7 weeks later) gave an endothermic feature, which between 660 and 700 K defines a ΔHtransition of ~ 6.72 J/g (~ 2.94 kJ/mole) (Table 5 and Fig. 5d). The heat effects observed for the hydrothermal KMg-Lc sample occur over the same temperature conditions as the monoclinic to orthorhombic phase transition determined by HT-XRD (Redfern and Henderson, Reference Redfern and Henderson1996) and we assign an average ΔHtransition value of 4.9 J/g (2.1 kJ/mole) to the phase transition for this compound (Table 5).
We have reported that the first heating Runs of hydrothermally synthesised KZS and KMS leucite analogues both show complex DSC patterns, which indicates that the samples are undergoing both chemical and structural changes during these initial experiments. Later scans on the same samples show simpler features with clear endotherms covering fairly wide temperature ranges; in addition, repeat heating experiments tend to show peaks having some differences in shape and in peak area, which we speculate reflect local changes that occur during the annealing and relaxation processes the samples undergo. In the following section we attempt to account for such effects.
Possible chemical and structural controls of heat effect differences observed
In a multi-nuclear MAS NMR study of leucite analogues of formula A 2X 2+Si5O12 with A = K, Rb, or Cs and X = Mg, Zn or Cd, Kohn et al. (Reference Kohn, Henderson and Dupree1994) commented that static 1H NMR showed the presence of water in some hydrothermal synthesised samples; they pointed out that TGA showed that such water was lost from 100 to 600°C, though no further information was given. However, Kohn (personal communication, May 2021) has recently confirmed that 1H NMR showed the presence of 0.5 to 2 wt.% H2O in crystalline Mg- and Zn- leucite samples (Kohn et al., Reference Kohn, Henderson and Dupree1994). Note that the only TGA data we have been able to obtain on the KZn-leucite sample KZS4 is a 0.2 wt.% loss between room temperature and 400°C; this is lower than that reported above but no sample is available currently for a better determination. We conclude here that the water lost at the lowest temperatures would be adsorbed water (denoted H2O–), though that lost at the highest temperatures in the KZn- and KMg-Lc samples studied here is likely to be molecular water occupying the large cavity positions (H2O+ in W-sites) within the leucite framework. Such water in analcime (NaAlSi2O6·H2O) is mainly lost close to 400°C and that in wairakite (CaAl2Si4O12·2H2O), is mainly lost at ~400 and 550°C (Deer et al., Reference Deer, Howie and Zussman2004); both of these minerals have leucite-type framework structures.
Kohn et al. (Reference Kohn, Henderson and Dupree1994) also used 29Si MAS NMR to show that a hydrothermally synthesised KMg-Lc sample (KMS2, 600°C, 50MPa, 7 days) was characterised by the presence of 10 sharp Si peaks (10 distinct Si-sites) with a flat, low intensity background, showing that the sample is a well-crystalline, fully-ordered monoclinic P21/c phase. In contrast, they showed that a hydrothermal KZn-Lc sample (KZS3, see above) had 10 identifiable Si peaks of well-crystallised, ordered material superimposed on a broad hump-shaped background of more disordered material (see Kohn et al. Reference Kohn, Henderson and Dupree1994; their figure 3). Note that they comment that the powder XRD pattern for KZS3 indicates a well-crystalline monoclinic sample pointing to any disorder being on the shorter range length scale probed by MAS NMR spectroscopy.
The presence of some water in crystalline hydrothermal KMg-Lc might, therefore, account for instabilities in the DSC scan for the previously unheated sample, though the starting material glass for that sample is close to the stoichiometric end-member composition (Kohn et al., Reference Kohn, Henderson and Dupree1994). However, the fact that the starting material glass for the KZn-Lc analogue is deficient in K (see section on ‘Sample synthesis’) suggests that the vacant W-sites in some of the hydrothermal samples might well contain a significant amount of molecular water trapped within the crystalline framework. Thus, we speculate here that the complex DSC features observed in the previously unheated KZS4-A, scan 1 sample could be related to water loss mainly starting at ~500°C, which might have been accompanied by some rapid, short-range re-ordering of K in the W-sites and Si and Zn in the T-sites. Such a process could explain exothermic-like features. However, at the same time the monoclinic to orthorhombic phase transition started; that crystallographic transition together with the effects of water loss would lead to the associated endothermic features. Note that the displacive crystallographic phase transition would be fully reversible but the water loss and site-ordering features would not be reversed on cooling. We have commented earlier that slightly smaller unit cell edges were found at the end of the Run1 HT-XRD experiments on KZS4-B and we speculate here that this could be due to water loss from the W cation site leading to some framework contraction.
We have shown above that DSC heating Runs on the KZS4-A sample after 43 hours of cooling (scan 2) shows only weak endothermic effects suggesting ΔHtransition values of ~380 J/mole (Table 5, Fig. 5b). However, the sample used for the HT-XRD powder investigation of the monoclinic–orthorhombic phase transition (denoted KZS4-B here) showed a much simpler thermal behaviour with a better defined endothermic peak over a similar temperature range to that observed for KZS4-A scan 1 (Table 5, Fig. 5b) with a much larger ΔHtransition of ~750 J/mole (Table 5) though our early DSC scans showed poor reproducibility. A final scan on KZS4-B (scan 2, obtained 13 weeks later) gave a higher ΔHtransition of ~1.73 kJ/mole (Table 5, Fig. 5c). Both of the KZS4 samples show simple endothermic features over the temperature range of ~868–875 K, reflecting the occurrence of the phase transition observed by HT-XRD. However, the higher transition heat for KZS4-B would be consistent with that sample having been annealed more effectively during the HT-XRD experiments thus providing a locally better-ordered structure and a more reliable thermal analysis result. The suggestion that the KZS4 sample had become better ‘ordered’ during the HT-XRD experiments is supported by the crystallite-size estimates reported in Table 5: before high-T XRD Runs ~1330 Å and after both HT-XRD and DSC experiments, 1773 Å (Table 5). These values reflect the case that well-crystallised, ordered samples provide better powder XRD patterns resulting from the larger crystallite repeat and X-ray scattering distances. Note that naturally occurring leucite (KAlSi2O6) might be expected to be better crystalline than any synthetic hydrothermally-crystallised leucite and this is confirmed by the room-temperature value of 345 nm (3450 Å) reported by Bell and Henderson (Reference Bell and Henderson2020).
The fact that hydrothermal KZS3 has a much smaller ΔHtransition than that for KZS4 must also be explained. We have shown that KZS3 has a crystallite size of ~1360 Å, within error of the unheated KZS4 sample (Table 5), though the MAS NMR data for the former sample clearly shows a much smaller proportion of a long-range-ordered monoclinic phase than for KZS4 (see above), which presumably restricts the effectiveness of any crystallographic transition and thus the size of the associated heat effect.
On the basis of the DSC data it seems clear that the transition heats in our samples are dependent on local factors in the frameworks that we do not fully understand; unfortunately, we do not have sufficient of any of the samples to study this more systematically with a program of annealing heat treatments and TGA, together with NMR, Raman or infrared spectroscopy to study the presence of water within W-sites. However, we suggest that the most reliable values for ΔHtransition are ~1.7 kJ/mole for the KZS4 sample and ~2.1 kJ/mole for the KMS2-AMT leucite. It seems likely that the best crystalline sample and most reliable ΔHtransition value is that for the KMg sample, though it is possible that none of the values represent equilibrium. Lange et al. (Reference Lange, Carmichael and Stebbins1986) studied the tetragonal I41/a to cubic Ia $\bar{3}$ d phase transition in natural and synthetic K-leucite samples by DSC and reported ΔHtransition data on the basis of a 6 oxygen cell as: average of 3 natural leucites ΔHtransition = 3.37 kJ/mole; synthetic KAlSi2O6 3.81 kJ/mole; synthetic KFe3+Si2O6 2.45 kJ/mole; and synthetic Si-rich solid solution Lc0.86Or0.14 wt.% 2.91 kJ/mole. On a J/g basis these transition heats would be 15.5, 17.5, 9.8 and 12.7 J/g, respectively; the values we find for KMg-leucite are significantly smaller and average ~4.9 J/g. It is clear that the nature of the tetrahedral cations and their proportions would affect the transition energies, as would the perfection of the crystalline frameworks for such samples. In addition, our samples have ordered T-site frameworks while the other samples (Lange et al., Reference Lange, Carmichael and Stebbins1986) will have mainly disordered Si–Al and Si–Fe frameworks. Much more sample synthesis, and high-resolution structural, spectroscopic and thermal analytical studies are required to adequately address this interesting research area, however this is not possible in the foreseeable future.
Characteristics of the monoclinic P21/c to orthorhombic Pbca transition in leucite analogues
The hydrothermally-synthesised KZn-Lc leucite analogue has an ambient temperature silicate framework structure in which Si and Zn cations are ordered over the framework. It has a P21/c monoclinic crystal structure and is isostructural with the first cation-ordered leucite analogue KMg-Lc, which was determined using integrated synchrotron powder XRD, electron diffraction, and 29Si MAS NMR methods (Bell et al., Reference Bell, Redfern, Henderson and Kohn1994a). A high-temperature Guinier powder XRD study on another portion of the same KMg-Lc sample (Redfern and Henderson, Reference Redfern and Henderson1996) showed a reversible, unquenchable ferroelastic phase transition that was initiated at ~650 K; the high-temperature form was indexed as a Pbca orthorhombic cation-ordered structure isostructural with Cs2CdSi5O12 (Bell et al., Reference Bell, Redfern, Henderson and Kohn1994b). In that study of KMg-Lc, both monoclinic and orthorhombic polymorphs were present over a temperature range of ~25 K and the calculated unit cell volume showed a positive ΔV of ~1.6 %. Both of the features pointed to a first-order transition (Redfern and Henderson, Reference Redfern and Henderson1996). Note that the topologically equivalent P21/c and Pbca structures, where the former has 12 distinct T-sites (10 Si and two M 2+) and the latter 6 T-sites (5 Si, 1 M 2+) [Bell et al., Reference Bell, Redfern, Henderson and Kohn1994a, Reference Bell, Redfern, Henderson and Kohn1994b], are permitted to show a continuous, second-order transformation (Stokes and Hatch, Reference Stokes and Hatch1988) but the ΔV and two-phase characteristics reported for the KMg-Lc phase transition excludes this possibility. This is consistent with that transition being a reversible, non-quenchable, first-order ferroelastic phase transition.
We have already predicted that P21/c KZn-Lc should show a phase transition to Pbca at ~700 K (Bell and Henderson, Reference Bell and Henderson2018), but the high-temperature data for KZn-Lc reported here show the phase transition occurring over the temperature range 848–863 K where both monoclinic and orthorhombic phases are present. This two phase region is similar to that described for unquenchable, displacive phase transitions shown by kalsilite analogues in the SrAl2O4–BaAl2O4 system and was named the ‘region of coexistence’ (Henderson and Taylor, Reference Henderson and Taylor1982); based on similarities shown for displacive phase transitions occurring in ZrO2 and high-cristobalite, it was suggested that the aluminate ‘nepheline/kalsilite-type’ phase transition had properties of a strain-related martensitic transition (Henderson and Taylor, Reference Henderson and Taylor1982; Avdeev et al., Reference Avdeev, Yakovlev, Yaramchenko and Kharton2007; Henderson, Reference Henderson2021).
Two-phase regions in the I41/a to $Ia\bar{3}d$ displacive phase transitions have also been reported for synthetic KGaSi2O6 and synthetic (K,Na)[Al,Fe3+,Si]3–4O6–8 leucites and it was concluded that all these phases showed martensite-type phase transitions (Bell and Henderson, Reference Bell and Henderson2020); that paper included a more detailed discussion of the mechanisms of martensitic displacive phase transitions in ZrO2, cristobalite and BaTiO3 in the Supplementary material.
DTA and DSC measurements for KZn-Lc leucites show an endothermic heat effect smeared out over ~15 K, corresponding to the phase transition range determined by powder XRD. Figure 1 shows how the lattice parameters vary with temperature and it is clear that all these data are consistent with the P21/c to Pbca transition occurring over a temperature range of ~20–25 K. This is likely to be related to the effects of internal strain being mediated in a stepwise, thermally controlled fashion (see below).
KZn-Lc and KMg-Lc leucite analogues both show similar first-order phase transitions with positive ΔV values (1.2 and 1.6%, respectively), with two-phase regions smeared out over ~20–25 K; however, the phase-transition temperature for KMg-Lc is much lower than that for KZn-Lc. As the tetrahedral Zn2+ cation is slightly larger than that for tetrahedral Mg2+, the KZn-leucite should have a slightly larger framework, however, cubic disordered K, Rb and Cs leucite analogues (A 2ZnSi5O12) invariably have smaller cell volumes than their Mg-counterparts at room temperature (Bayer, Reference Bayer1973; Kohn et al., Reference Kohn, Henderson and Dupree1994; Yanase et al., Reference Yanase, Kobayashi and Mitamura1999; Henderson et al., Reference Henderson, Bell and Knight2017). The same is true for the ordered P21/c and Pbca (K, Rb and Cs)-Mg and -Zn equivalents (Kohn et al., Reference Kohn, Henderson and Dupree1994; Henderson et al., Reference Henderson, Bell and Knight2017; and this work). This relationship would be consistent with the larger Zn-containing frameworks being more collapsed about each central cavity cation than their Mg equivalents. This, in turn, would result in the phase transition to the higher symmetry polymorph being displaced to a higher temperature as found here. However, the starting glass material for the KZn-leucite sample shows a deficiency of K in the W-site (see above) while that for the KMg-leucite sample is within error of the stoichiometric KMg-Lc composition (Kohn et al., Reference Kohn, Henderson and Dupree1994) and this might also be a factor in influencing the actual phase-transition temperature and overall characteristics.
The spontaneous strains associated with these phase transitions are analysed in the next section.
Strains associated with the ferroelastic (P21/c) to paraelastic (Pbca) phase transition in KZn-Lc
We have already pointed out that T-site ordered P21/c and Pbca leucite analogues have the same structural topologies as the I41/a and $Ia\bar{3}d\;$ leucite frameworks. Several detailed studies of the strains associated with the second-order ferroelastic (I41/a) to paraelastic ($Ia\bar{3}d$
 ) displacive phase transition in natural leucite (KAlSi2O6) have been published (e.g. Palmer et al., Reference Palmer, Salje and Schmahl1989, Reference Palmer, Dove, Ibberson and Powell1997; Palmer, Reference Palmer and Salje1990; Carpenter et al., Reference Carpenter, Salje and Graeme-Barber1998a). All of these studies interpreted aspects of the phase transitions for natural leucite in terms of Landau Theory, which was developed initially for continuous second-order transformations. However, subsequent research showed that this approach could be extended to describe first-order and reconstructive phase transitions, and even to incommensurate phases (Tolédano and Tolédano, Reference Tolédano and Tolédano1987; Tolédano, Reference Tolédano2012). In the present case, as mentioned above, Group Theory shows that a phase transition from Pbca to P21/c is permitted to be second order as it satisfies both the Landau and Lifshitz criteria, but this does not preclude such a transition being first-order that is system dependent. A first-order transition in the Ehrenfest classification requires the first differential of the Gibbs function to be discontinuous at the phase transition, e.g. entropy or volume, which is demonstrated in KZn-Lc by the occurrence of a volume discontinuity between the orthorhombic and monoclinic phases.
The excess free energy (ΔG) at a phase transition can be defined using a simple Landau potential as:

where Q is an order parameter, Tc is the transition temperature, T the temperatures for a series of experimental measurements, and A, B and C are coefficients defining the shape of the Q vs. T trend. For a continuous, second-order phase transition (with no ΔV) A, B and C are positive. A value of B = 0 marks the occurrence of a tricritical point and for negative B values (B < 0) the phase transition is said to be first order (e.g. Aitta, Reference Aitta, Paycha and Hobbs2009); such a first-order transition will be characterised by the presence of discontinuities in symmetry-breaking and non-symmetry breaking strains, and perhaps by the occurrence of a two-phase region (e.g. also see Salje, Reference Salje1990; Hayward et al., Reference Hayward, Romero, Gallardo, del Cerro, Gibaud and Salje2000; Tolédano, Reference Tolédano2012). Redfern and Henderson (Reference Redfern and Henderson1996) have already shown for T-site ordered KMg-Lc leucite that the symmetry relations for the P21/c to Pbca transition satisfy the general Landau and Lifshitz criteria and that discontinuities in both the volume and the shear strain (e13, see below) indicate a first-order mechanism. The spontaneous strain vs. order parameter relationships for the KMg-Lc transition show that the driving order parameter e13 [effectively (–cos β*)/2] scales with the ferroelastic order parameter (Q), whereas the non-symmetry-breaking volume strain (V ss) scales with Q 2 (Redfern and Henderson Reference Redfern and Henderson1996). Although Redfern and Henderson (Reference Redfern and Henderson1996) fitted the temperature dependence of the e13 temperature dependence for KMg-Lc, and reported values determined for A/C and B/C coefficients and for T c, we were not able to obtain robust fits for the KZn-Lc sample, reflecting the lower quality of data obtained here compared to the higher resolution Guinier camera data used by Redfern and Henderson.
Carpenter et al. (Reference Carpenter, Salje and Graeme-Barber1998a) in a key paper on ferroelastic transitions gives many examples for mineral and inorganic compounds that display either second- or first-order displacive phase transitions. Other recent papers dealing with the strains associated with monoclinic–orthorhombic phase transitions involved the P21/n to Pnma transition in ZSM-5 zeolite (Ardit et al., Reference Ardit, Martucci and Cruciani2015) and in olivenite (Tarantino et al., Reference Tarantino, Zema, Callegari, Boiocchi and Carpenter2018). In these cases, and for P21/c to Pbca in KZn-Lc and KMg-Lc, the same point group pair mmm and 2/m is involved but note that the ZSM-5 zeolite and olivenite have many features consistent with second-order transitions in contrast to KZn-Lc and KMg-Lc. In the present work we have combined the different approaches used by Redfern and Henderson (Reference Redfern and Henderson1996), Carpenter et al. (Reference Carpenter, Salje and Graeme-Barber1998a) and Ardit et al. (Reference Ardit, Martucci and Cruciani2015) to address the spontaneous strain relationships that reflect the changes in the structural state shown by the KZn-Lc phase transition.
Carpenter et al. (Reference Carpenter, Salje and Graeme-Barber1998a) defined the components of the spontaneous strain tensor for a monoclinic–orthorhombic transition, where a 0, b 0, c 0 and V 0 are orthorhombic parameters extrapolated into the lower temperature monoclinic field. Figure 1 shows how linear extrapolations of the KZn-Lc orthorhombic high temperature values for a, b, c, β and V provide estimates for a 0, b 0, c 0, β0, and V 0 at the temperatures for the Run 1 monoclinic polymorphs (see section on ‘Powder X-ray diffraction’). The a 0, b 0, c 0 and V 0 values for KMg-Lc were obtained in a similar way from the parameters reported in Table 1, Redfern and Henderson (Reference Redfern and Henderson1996).
The Carpenter et al. (Reference Carpenter, Salje and Graeme-Barber1998a) spontaneous strain equations used here are: e11 = a/a 0 – 1 (Carpenter equation 49); e22 = b/b 0 – 1 (equation 50); e33 = ((c/c 0) sin β) – 1 (equation 51); e13 = (0.5(c/c 0)cos β) [equation 53; note that for small linear strains this has a value close to (–cos β*)/2]; e12 = e23 = 0 (equations 52 and 54). The linear strains e11, e22 and e33 are non-symmetry-breaking (nsb) and scale with Q as eii α Q 2. The shear strain e13 is symmetry-breaking (sb) and scales with Q as e13 α Q. The volume strain is defined as V ss = (V – V 0) / V 0 (Carpenter equation 69) and there is a discontinuity, ΔV, at the transition point.
We have calculated the individual strain parameters from the measured cell parameters for KZn-Lc (this paper) and KMg-Lc (Redfern and Henderson, Reference Redfern and Henderson1996; see also Henderson, Reference Henderson2021) in an Excel spreadsheet and plot the results in Fig. 6a and b. Note that the values calculated for e11, e22, e33, and V ss have significant uncertainties arising from the need to extrapolate orthorhombic cell parameters over wide temperatures ranges to provide a 0, b 0 and c 0 for each temperature step in the monoclinic stability field, but e13 is better constrained because the extrapolated β0 term is fixed at 90°. For the KZn-Lc sample (Fig. 6a) the data for the monoclinic and orthorhombic symmetries are plotted using separate symbols. Note that we have not plotted strain data for the two-phase mixtures because overlapping Bragg peaks for the coexisting monoclinic and orthorhombic phases lead to some of their cell parameters being less reliable than for the one-phase data points. The Run 2 data plot within error of the Run 1 points and the same is true for the orthorhombic data above the phase transition though we have not included the points for monoclinic, Run 2 strains as they obscure the detailed individual trends for the monoclinic phases close to the phase transition. However, the strain trends for Runs 1 and 2 are shown separately in Figs 7 and 8 below.
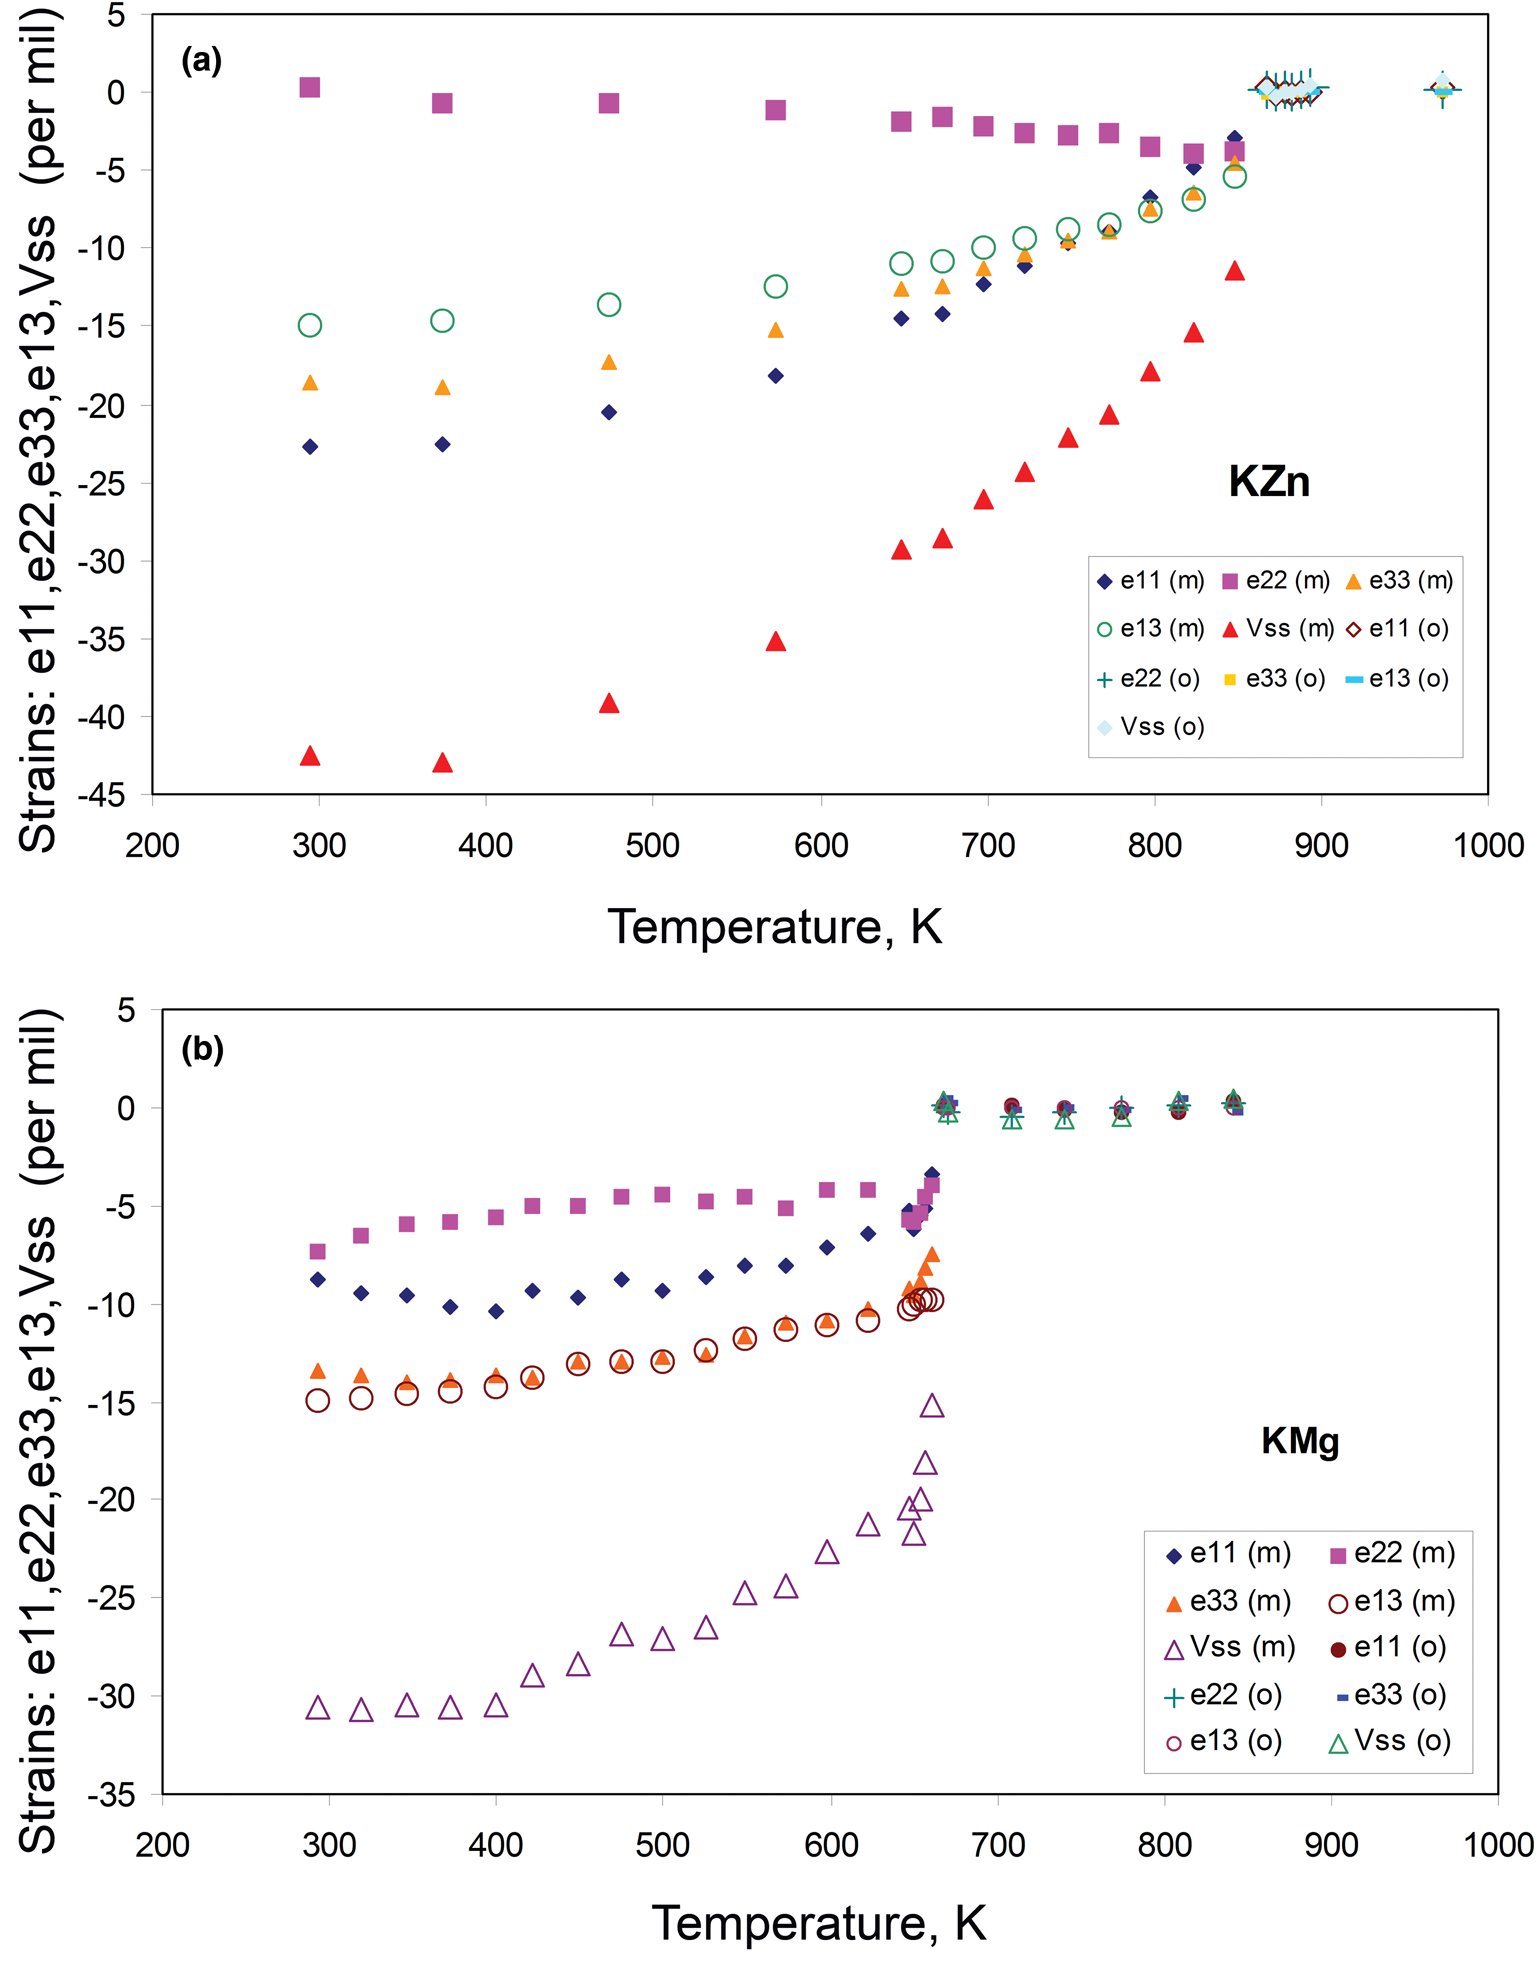
Fig. 6. Variation of calculated spontaneous strain parameters e11, e22, e33, e13, and Vss vs. temperature: (a) KZn-Lc, sample KZS4 (this work); (b) KMg-Lc, sample KMS2 (cell parameters from Redfern and Henderson, Reference Redfern and Henderson1996).
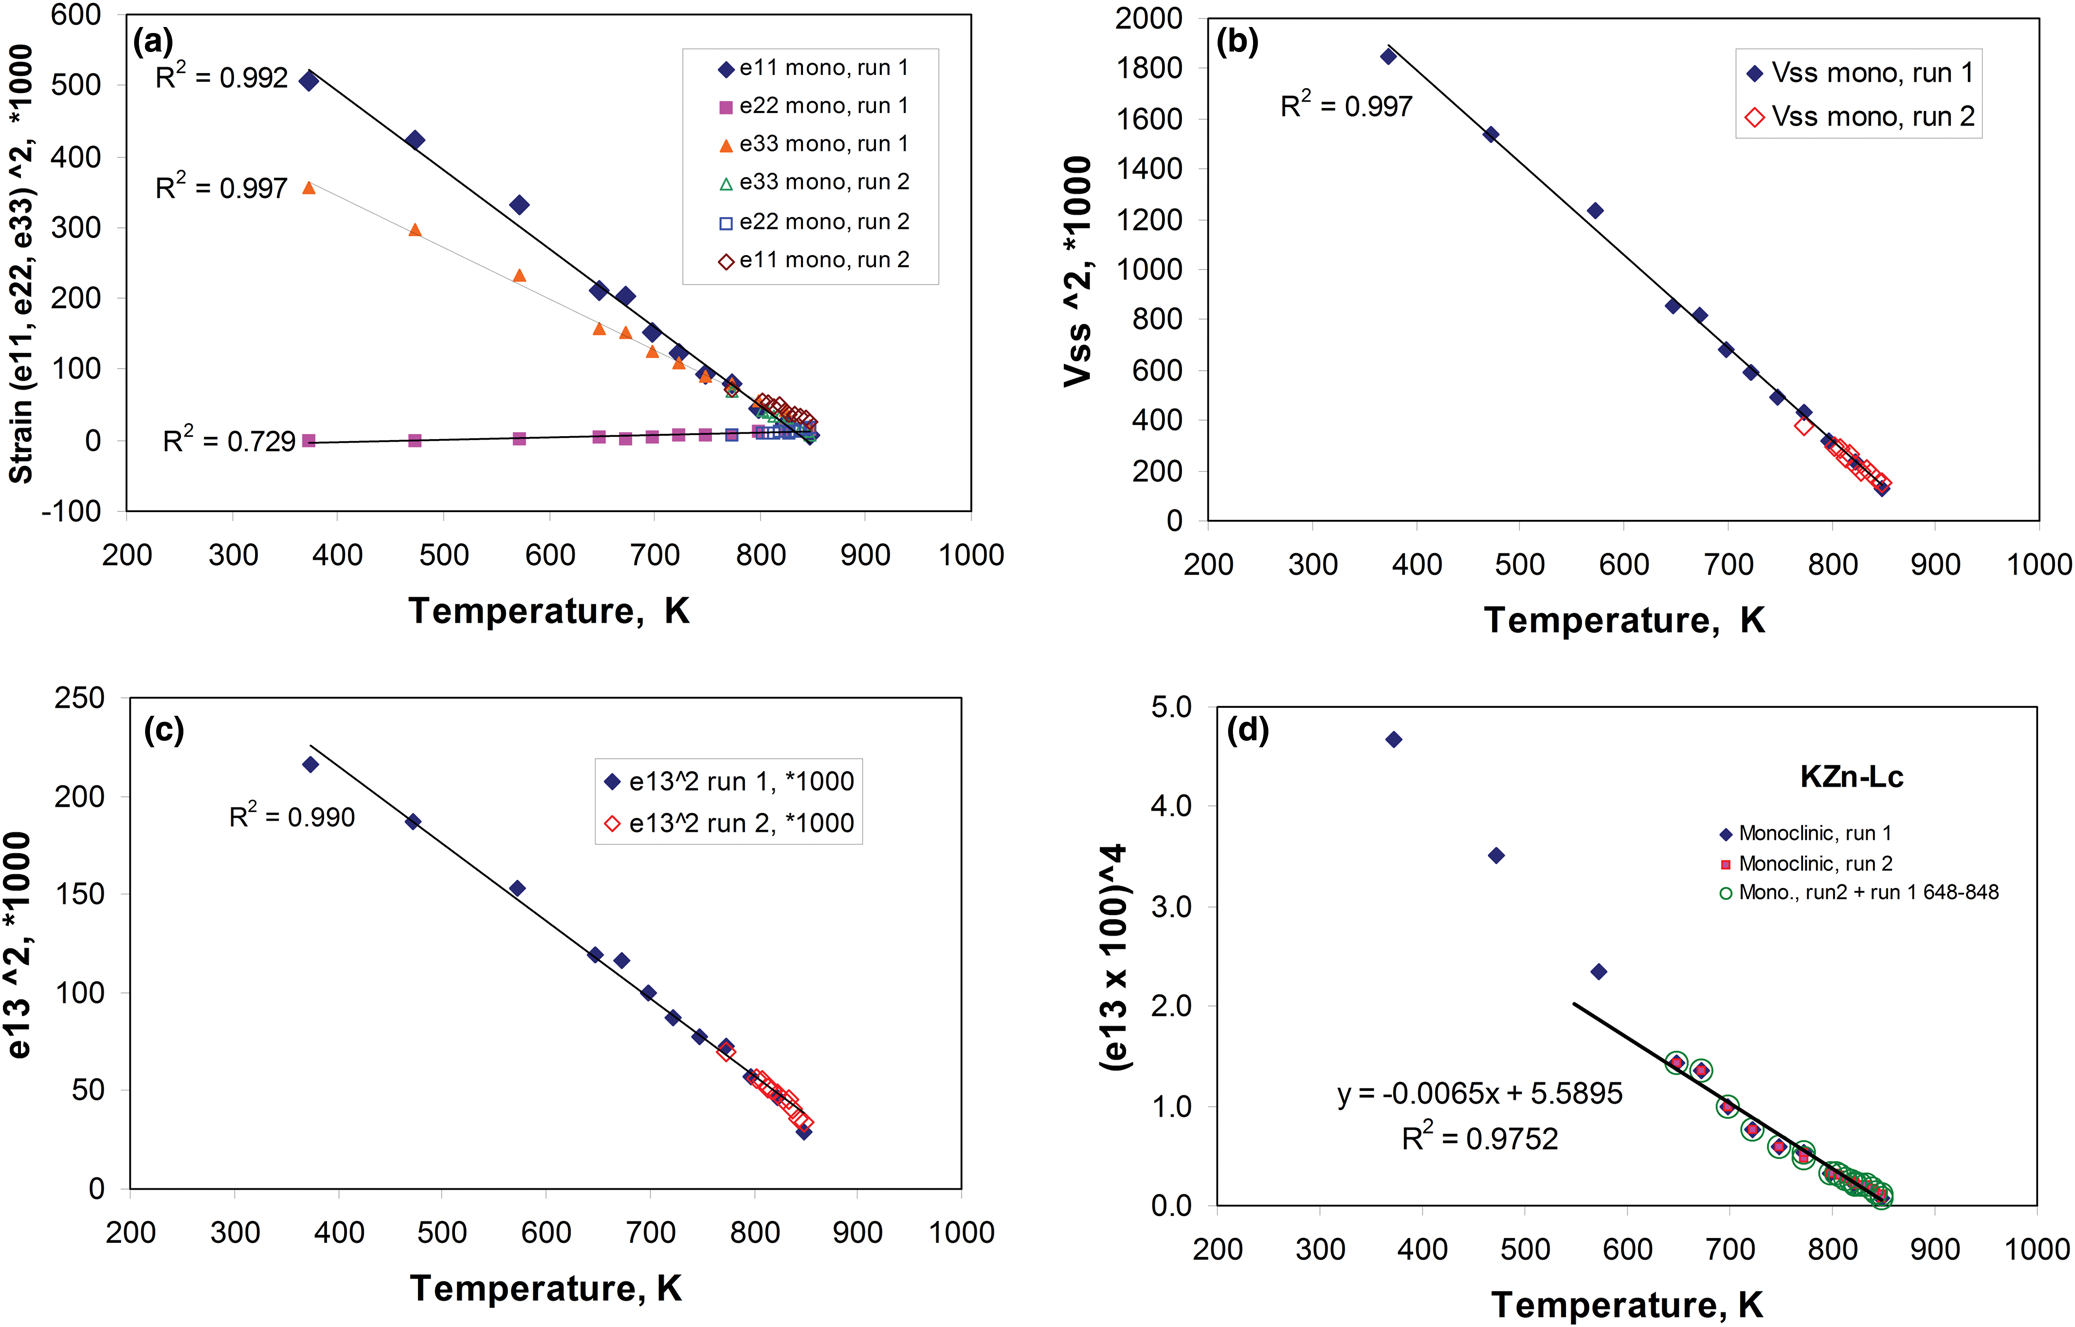
Fig. 7. Variation of strain parameters versus temperature for KZn-Lc, sample KZS4: (a) [e11, e22, e33]2 vs. T; (b) Vss2 vs. T; (c) e132 vs. T; (d) e134 vs. T. Linear fit data are shown for strain parameters. See text for explanation.
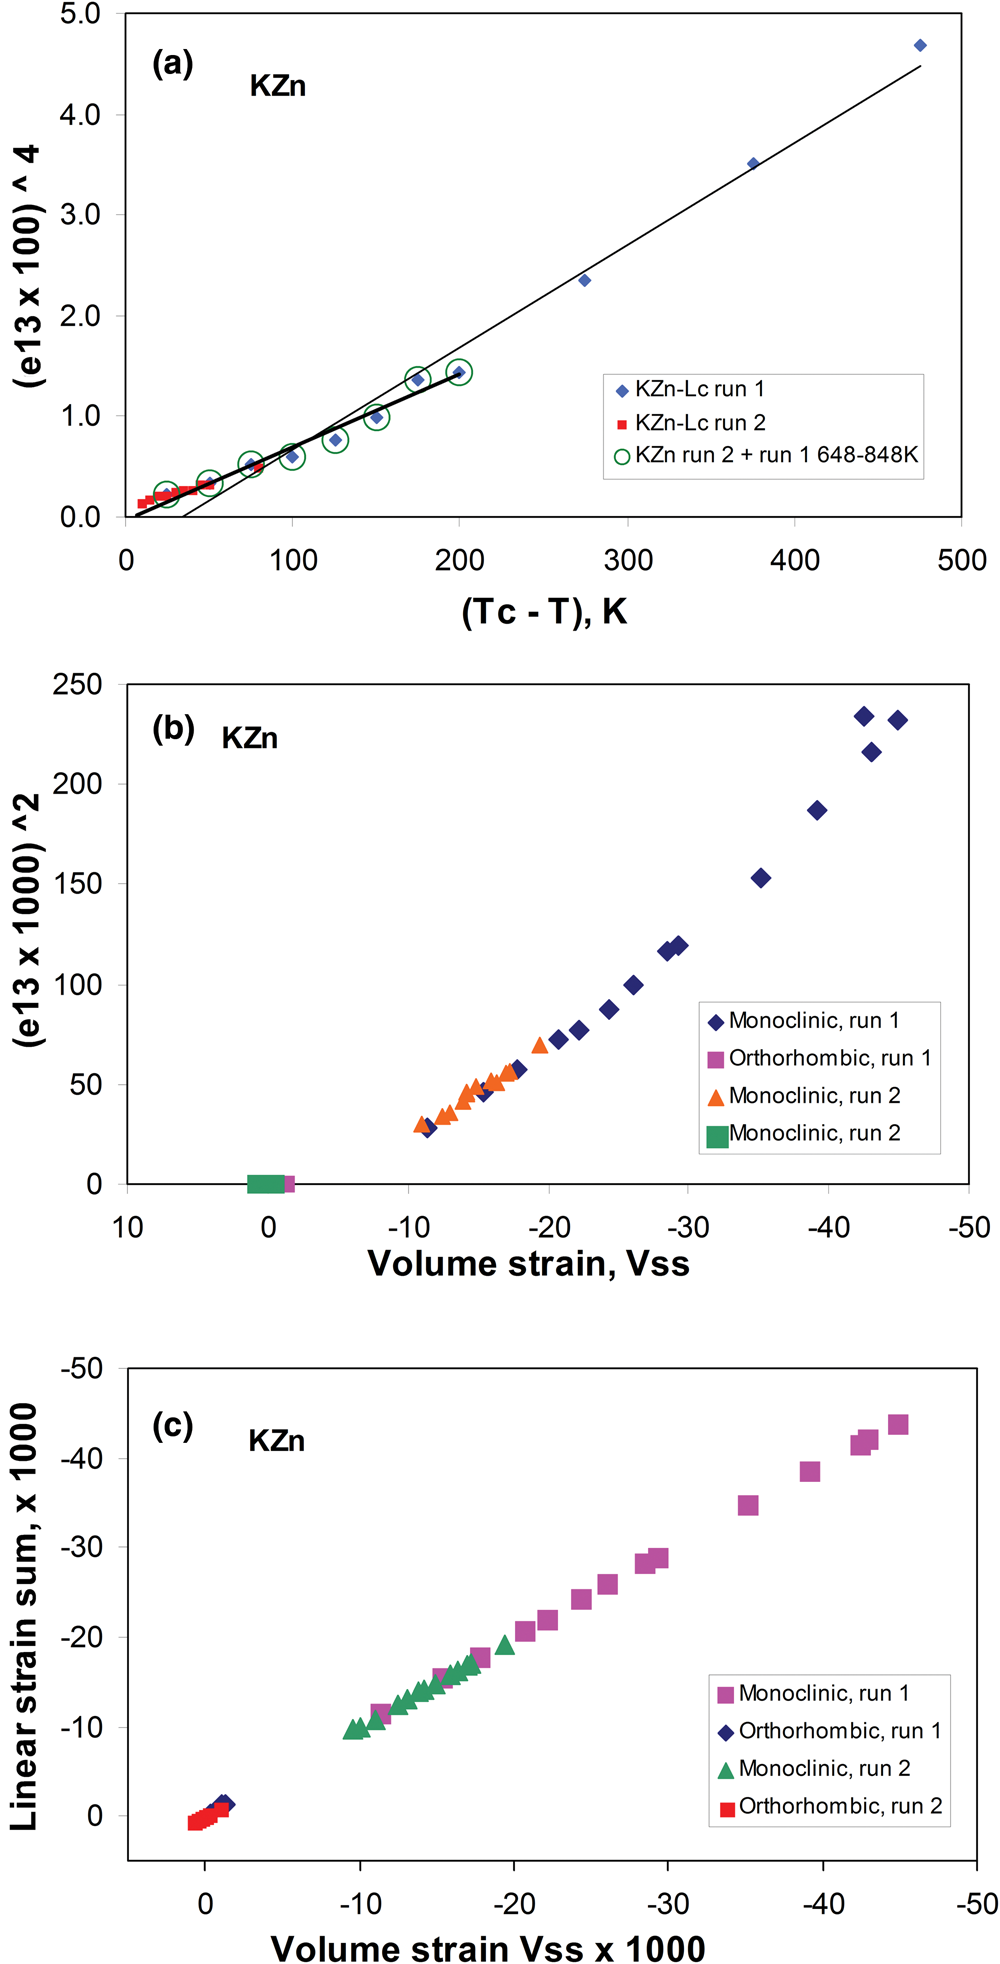
Fig. 8. Plots of spontaneous strain parameters for KZn-Lc, sample KZS4 that can be used to assess relationships between strain components and order parameters. (a) e134 vs. (T c – T); (b) (e13)2 (e13 is proportional to Q) vs. V ss (proportional to Q 2); the line shows the linear fit obtained for Run 2 data; (c) relationship between the symmetry breaking strain (V ss) and the sum of the non-symmetry breaking axes of the strain tensor (e11 + e22 + e33). See text for explanation.
The spontaneous strains for e11 and e33 (i.e. those for the a and c axes) for the monoclinic samples start with negative values (–23‰ and –19‰, respectively) and both trends show only small changes (to less negative values) up to ~500 K, the e11 then starts to change more quickly than e33 with increasing temperature and the two trends cross at ~750 K to give values just below the phase transition of –3 and –5‰, respectively. The e22 strains (b axis) have values close to zero and initially show little change, but then a slight fall above 650 K to ~–4‰. The e13 shear strain shows little significant variation up to ~500 K (i.e. from –15 to –14‰) before decreasing to –5‰ at the transition. The volume strain shows little change up to 400 K (from –45 to –44‰) but then shows a clear, increasing rate of change with increasing temperature to a value of ~ –11‰ at the phase transition; the volume discontinuity between the monoclinic and orthorhombic strains at the transition is very clear at ~850 K in Fig. 6a. The discontinuities for the other strains are smaller but all show positive relationships between the strains for monoclinic and orthorhombic cells. For the orthorhombic data the e11, e22, e33 and V ss strains have very low values, scattering on the positive and negative sides of 0 reflecting experimental error, mainly error from the extrapolated i 0 values. As expected, the e13 strains plot at zero values reflecting the fact that cos90 = 0. It is clear in Fig. 6a that all of the strain parameters for the monoclinic phases show smooth, non-linear responses with increasing temperature.
The small magnitudes of discontinuities in individual strains at the transition point seen in Fig. 6a show that the orthorhombic to monoclinic transition in KZn-Lc is weakly first order. As such it is expected to be in close proximity to tricritical (Q 4 α (T c – T)); approximately linear relationships between eii2 and V ss (α Q 4) vs. temperature (Fig. 7a,b) confirm that this is the case. The symmetry-breaking (e13)2 strain also shows a reasonable linear trend in Fig. 7c but the highest temperature points fall below this linear fit and the overall trend has a concave-down form suggesting a different behaviour for the e13 strain. The plot of e134 vs. temperature is shown in Fig. 7d and shows some curvature though note that the higher temperature data points for Run 1 data and all of the Run 2 data show a good linear trend consistent with a relationship e13 α T 1/4 suggesting tricritical behaviour. This relationship is shown better in Fig. 8a in a plot of e134 vs. (T c – T) where T c is chosen to be the first temperature that the orthorhombic phase appears (848 K). The full data set shows a close to linear trend but the higher temperature points define a linear trend direct towards the orthorhombic phases that would plot at the origin. Thus, if the driving order parameter e13 is proportional to T 1/4 this, in turn, would be consistent with the phase transition being weakly first order, tricritical, in nature (cf. Li et al., Reference Li, Zhang, Bithell, Batsanov, Barton, Saines, Jain, Howard, Carpenter and Cheetham2013).
Figure 8b shows the relationship between e132 and V ss for KZn-Lc is non-linear although the higher temperature points do show a simpler almost-linear trend. Departures from linearity shown in Figs 7d and 8a reflect two possible internal inconsistencies: experimental error or higher order coupling effects. Absolute uncertainties in linear strains are expected to be greater than those for e13 because of the necessity to extrapolate experimental data from the high-temperature orthorhombic phase field in order to estimate values for a 0, b 0 and c 0 in the stability field of the monoclinic structure. In addition, the lower temperature points for the monoclinic phases tend to show very small changes reminiscent of a ‘plateau’ effect and this might explain some of the non-linear trends (see above). A partial test of the robustness of the analysis is provided by the observation that values of V ss are essentially indistinguishable from the sum of e11 + e22 + e33 (Fig. 8c) as required for small strains. This leaves the probability that the spontaneous strains include coupling with higher order terms in Q, as has been observed in the case of alpha–beta quartz that also has a large volume strain of up to ~5% (Carpenter et al., Reference Carpenter, Salje, Graeme-Barber, Wruck, Dove and Knight1998b).
The spontaneous strains for KMg-Lc leucite have been calculated in the same way using the cell parameters from table 1 of Redfern and Henderson (Reference Redfern and Henderson1996); see also the preliminary study of strain parameters for this compound (Henderson, Reference Henderson2021). The e11, e33 and V ss spontaneous strains for that compound (Fig. 6b) are all less negative, and that for e22 is slightly more negative, than those for KZn-Lc leucite; overall the Zn-analogue clearly has a more distorted framework than the Mg form. However, for each parameter the trends are similar for the two leucite compositions. Figures 6a and 6b show distinct discontinuities for each of the strains at the transition for both KZn-Lc and KMg-Lc. These clear discontinuities and the positive ΔV are all consistent with the phase transitions being weakly first-order in character for both of these compounds.
Conclusions
High-temperature powder XRD measurements on the KZn-Lc leucite analogue show that the ambient temperature P21/c monoclinic cation-ordered crystal structure undergoes a phase transition to a Pbca orthorhombic cation-ordered crystal structure over the temperature range 848–863 K.
There is an ~1.2% step increase in the KZn-Lc unit cell volume over the phase transition for this phase. KZn-Lc is isostructural with KMg-Lc, which shows a similar phase transition around 650 K. The positive ΔV and the presence of two-phase regions occurring over the temperature range of the phase transition for both the Zn and Mg analogues are consistent with both transitions being first order and may have a strain-related martensite-like mechanism
The first DSC heating scans on original, as synthesised T-site-ordered leucites are, perhaps, related to loss of any water present and local structural ordering effects; nevertheless, annealed samples give ΔH values for the displacive P21/n to Pbca crystallographic transition for less-well-annealed KZS4 of 3.6 J/g, and for well-annealed KMS2 a value of 4.9 J/g. These values compare with values of ~15 J/g for the I41/a to I $a\bar{3}$ d transition in well crystallised natural leucite (KAlSi2O6). Note that we have used J/g here rather than J/mole so as not to confuse 12 O cell values for the KZn- and KMg-Lc samples with the 6 O cell basis used for natural leucites.
Analysis of the spontaneous strains associated with the transition for KZn-Lc is shown to be similar to those reported for the KMg-Lc leucite analogue (Redfern and Henderson, Reference Redfern and Henderson1996; Henderson, Reference Henderson2021). Both compounds show that the primary ferroelastic strain e13 (or cos(β*)) is proportional to the driving order parameter Q while the V ss strain is coupled to Q 2.
The current work on these compounds has raised evidence of some complexities in the nature of the monoclinic to orthorhombic phase transitions in these T-site ordered KZn- and KMg-Lc P21/c framework structures. Structural characterisation of such low symmetry, multi-site compounds is challenging; the presence of two-phase regions at the transition, and the presence of structural water in the original samples all present problems. To address such problems it would be necessary to prepare large amounts of new, well-crystallised and stoichiometric materials that should be studied by techniques including high-resolution synchrotron X-ray or (preferably) time-of-flight neutron diffraction, multi-nuclear MAS NMR, infrared, and DSC/TGA methods. None of this would be straightforward and a new consortium would be necessary.
Acknowledgements
We thank Dr. Kevin S. Knight ex ISIS at Rutherford Appleton Laboratory for advice on strain analysis and application of Landau theory, Dr. Wei Deng of Sheffield Hallam University for assistance with Differential Thermal Analysis work, Dr. John Waters of the University of Manchester for recent powder XRD studies on dry-synthesised disordered and ordered KMg-Lc, and Prof. Simon Kohn for information on water contents of the hydrothermal leucites studied. Two referees gave very useful comments and made corrections; we particularly thank Michael Carpenter for his generous comments, key clarifications and advice, all of which have helped to greatly improve this paper. Any remaining errors are the responsibility of the authors.
This research received no specific grant from funding agencies in the public, commercial, or not-for-profit sectors. There are no declarations of interest.


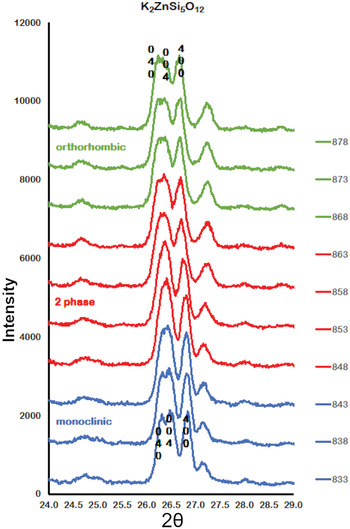
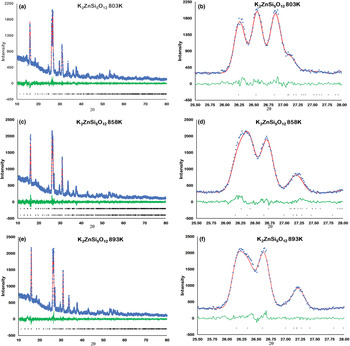


 Open access