


The Department of Materials Science and Engineering (MS&E) at The Pennsylvania State University–University Park (Penn State) has seen an increase in undergraduate enrollment of more than 175% over the past 10 years. During this timespan, the department has gone through some significant changes, including the addition of a new building for the Materials Research Institute as well as a complete renovation of the MS&E Department building. The department completed a review and redesign of the undergraduate curriculum in 2012 that allows students the flexibility to create a personalized materials degree with special emphasis in areas of their choosing.
A significant part of the observed enrollment increase is from students who change their major to materials science and engineering or from university transfers. This change in curriculum reflects a trend among many of the curricula of undergraduate MS&E programs in the United States toward a general and flexible coverage of fundamentals rather than a focus on specific, distinct subfields within materials science, although there are some notable exceptions such as at Missouri University of Science and Technology and Alfred University.
Figure 1 illustrates the increase in the number of students who have entered MS&E since 2008 at Penn State, either as freshmen (first-year students) or by change of major. Both the increase in the number of freshmen majoring in MS&E as well as an increase in transfers from other majors have combined to facilitate a 175% growth during this period. However, the increases do not correspond to an increasing percentage of women enrolling in MS&E or an increasing percentage of students from underrepresented groups. This is consistent with the finding of a 2011 reportReference Beede, Julian, Langdon, McKittrick, Khan and Doms1 from the US Department of Commerce that fewer women earn undergraduate degrees in science, technology, engineering, and math (STEM) than men in the United States, with the low numbers of women being more pronounced in engineering. The report further notes that in the preceding decade, the underrepresentation of women in STEM has remained constant at about 24%, even as the percentage of women in the workforce overall has increased to nearly 50%.
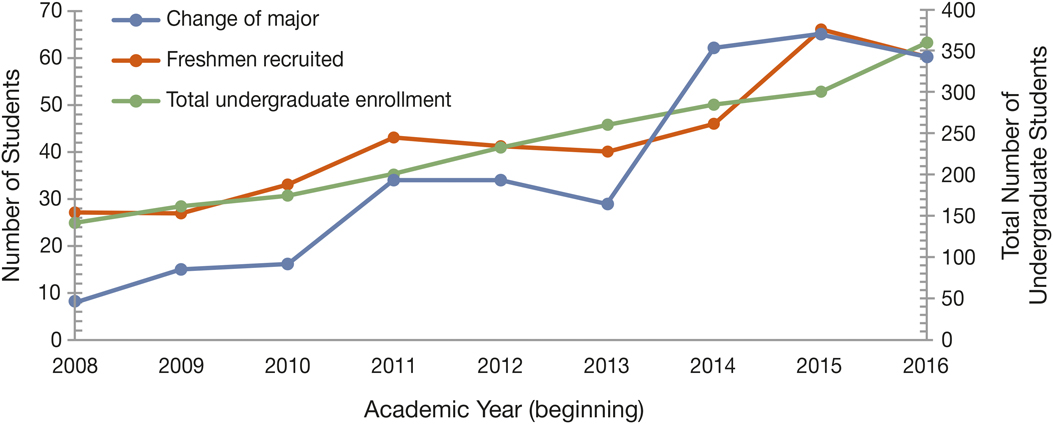
Figure 1. Increase in Penn State MS&E undergraduate enrollment for both freshmen and students changing their major to MS&E. The department observed a total increase in undergraduate enrollment of 175% during this time.
This upsurge in undergraduate enrollment comes at a time of increased undergraduate engineering enrollment nationwide. Elected officials at the state level are discussing tying resources that flow to public institutions of higher education to the number of graduates in STEM disciplines and/or job placement of graduating students.Reference Cohen2 At the US federal level, there has been discussion of tying the rating of universities and colleges to the earnings of their graduates,Reference Cohen2 which are higher for those in STEM disciplines, such as engineering. Worldwide, the gravitation to science and engineering is even more pronounced: 49% of undergraduate university degrees awarded in China in 2012 were in science and engineering, while the percentage in the United States was 33%.Reference Arvizu, Droegemeier, Anderson, Ball, Bassler, Beachy, Bienenstock, Cerf, Chandler, David, Fung, Groves, Jackson, Lepage, Leshner, Lineberger, Mayo, Panchanathan, Peterson, Richmond, Sargent, Souvaine, Zimmer, Zuber, Cordova and Woert3 Total R&D expenditures worldwide doubled between 2003 and 2013,Reference Arvizu, Droegemeier, Anderson, Ball, Bassler, Beachy, Bienenstock, Cerf, Chandler, David, Fung, Groves, Jackson, Lepage, Leshner, Lineberger, Mayo, Panchanathan, Peterson, Richmond, Sargent, Souvaine, Zimmer, Zuber, Cordova and Woert3 which drives demand for graduates with training in science and engineering.
We surveyed the heads and chairs of US MS&E departments and programs with undergraduate programs that are members of the University Materials Council (UMC).4 The majority of the responding programs were public institutions, and 70% of the respondents were designated by the Carnegie Foundation as Research 1 institutions (US universities with the highest level of research activity). The schools cover a range of total university enrollments from less than 5000 students to more than 30,000 students.
Figure 2 shows the percent increase in undergraduate enrollment for a representative subset of the 115 schools that offer a materials undergraduate education, are members of the UMC, and responded to the survey circulated by the authors. The data represent approximately 17% of the 115 institutions that offer a materials engineering education. All programs reported increases, and some reported substantial increases. These include relatively small programs and institutions (Auburn University, Clemson University, University of North Texas, The University of Vermont, University of Wisconsin–Milwaukee), as well as large programs and institutions (Penn State, University of Illinois, University of Minnesota).
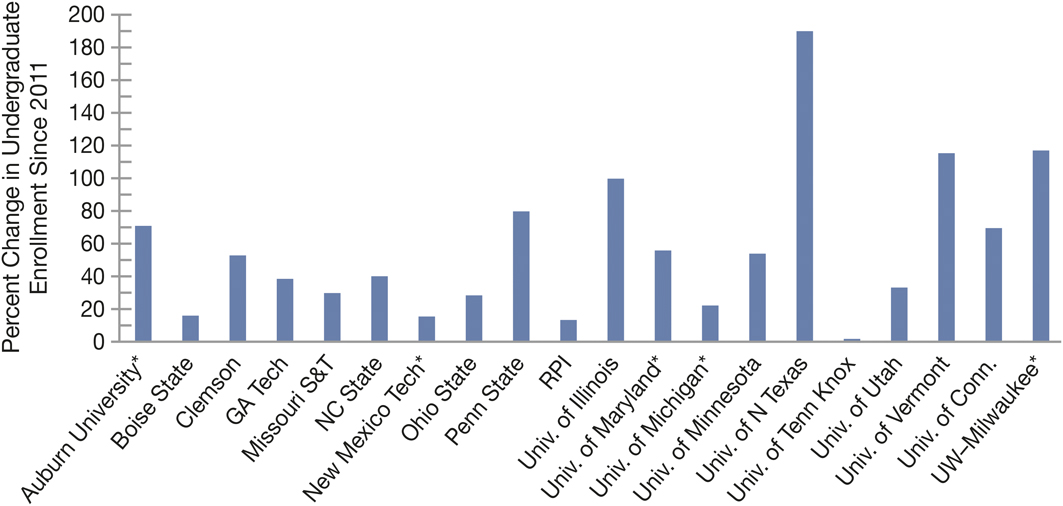
Figure 2. Percent increase in undergraduate enrollment in several MS&E departments in the United States during 2011–2016. *Schools that did not report 2016 enrollments.
Universities and colleges with the largest student populations saw the largest percentage increase during 2011–2016, and those with populations of less than 5000 saw the smallest percentage increase over the same period, as indicated in Figure 3. However, there is no strong dependence on overall size of the institution from the data. In this respect, these data are consistent with data from the American Society for Engineering Education (ASEE)5 of MS&E programs, as a whole, across the United States.
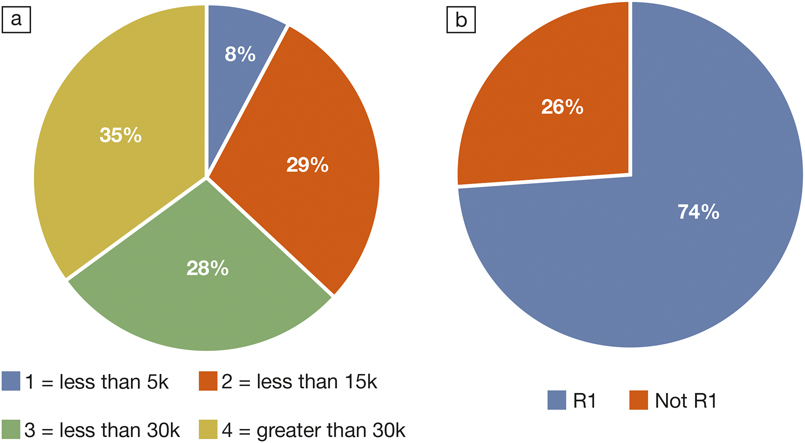
Figure 3. (a) Percentages of the total increase in US enrollment in MS&E programs as a function of university enrollment size during 2011–2016 for the institutions shown in Figure 2. (b) Percent increases in MS&E undergraduate enrollment as a function of university research activity at public institutions. R1, Research 1 institutions.
Universities and colleges are classified using the Carnegie Classification of Higher Education. One of the classification schemes is based on research activity, which is determined from an aggregate of the level of research at the institution as well as research activity per capita. Figure 3b, which only considers data from public institutions, indicates the majority of the increase in undergraduate student population occurs at very research active, or R1, institutions. The 2016 reportReference Arvizu, Droegemeier, Anderson, Ball, Bassler, Beachy, Bienenstock, Cerf, Chandler, David, Fung, Groves, Jackson, Lepage, Leshner, Lineberger, Mayo, Panchanathan, Peterson, Richmond, Sargent, Souvaine, Zimmer, Zuber, Cordova and Woert3 from the National Science Board and the National Science Foundation found that 11% of science and engineering bachelors’ degrees were from baccalaureate colleges, but 14% of future doctorate recipients in science and engineering are from these institutions. To put the data presented in Figure 3 in appropriate context for MS&E, of the 115 institutions that offer an education in materials engineering, 71 are R1 institutions, and 20 of the R1 institutions are private.
The enrollment observations made from this investigation are also reflected in the enrollment trends for engineering, in general, across the United States. Figure 4 indicates the way the increases in MS&E bachelors’ degrees awarded compare to increases in selected other engineering majors using data from ASEE. All the engineering disciplines considered witnessed substantial growth over the same period, with the largest growth occurring for chemical engineering, MS&E, biomedical engineering, and industrial engineering. The smallest growth occurred for civil engineering and electrical engineering. Thus, the increases in enrollment in MS&E schools reflect the overall trend within engineering majors, while MS&E had the second highest gains during that period for all engineering disciplines.
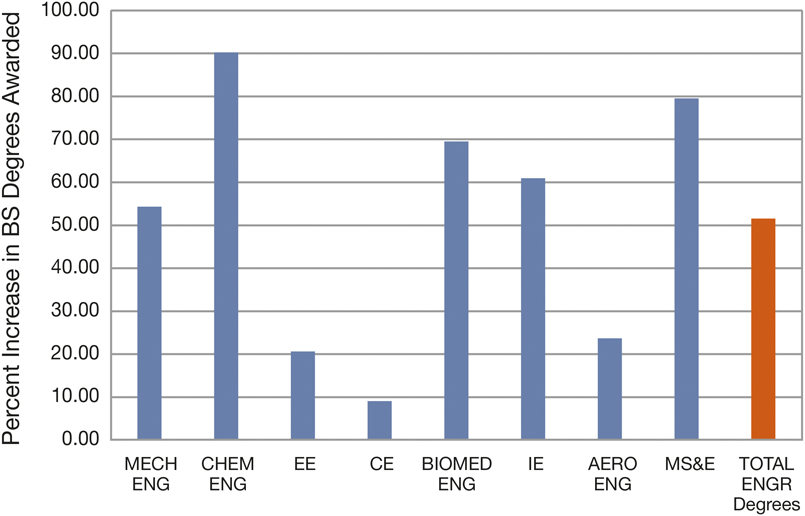
Figure 4. Percent increase in bachelors’ degrees awarded for various engineering disciplines from 2008 to 2016. Data obtained from ASEE (www.asee.org/papers-and-publications/publications/college-profiles). EE, electrical engineering; CE, chemical engineering; IE, industrial engineering; MS&E, materials science and engineering.
The ASEE data presented in Figure 4 indicate that MS&E has seen significant enrollment increases over the past eight years; however, finding an explanation for these observations is complex. Some universities, such as the Massachusetts Institute of Technology and California Polytechnic State University, have deliberate control of the number of entering students to the major. This control could be due to overall university policies or to limited resources. In the case of Penn State, a great deal of the enrollment explosion came when many other oversubscribed engineering disciplines instituted enrollment controls based on GPA. These controls mean that a student must meet a minimum cumulative GPA requirement in order to declare a specific engineering major. A significant increase in change-of-major students leaving the oversubscribed engineering majors for MS&E caused the Penn State MS&E enrollment increase. Some of these students changed majors due to GPA, but others were looking for a smaller major with more opportunities in undergraduate research and internships.
Some universities are foregoing enrollment controls based on GPA, thus providing equal access to all preengineering majors to any discipline. At some of these institutions, the impact of removing enrollment controls has led to a decrease in enrollment in the MS&E program. While the MS&E program at the University of Michigan has seen a decrease in enrollment with the removal of enrollment-controlling GPA, the department’s numbers are still about 20% higher than five years ago. The implication here is that the MS&E Department is losing numbers to other engineering majors when all things are equal. This could be due to the employment trends in other engineering majors (e.g., computer science and computer engineering), where majors with a BS degree are being offered higher starting salaries.
The 2016 reportReference Arvizu, Droegemeier, Anderson, Ball, Bassler, Beachy, Bienenstock, Cerf, Chandler, David, Fung, Groves, Jackson, Lepage, Leshner, Lineberger, Mayo, Panchanathan, Peterson, Richmond, Sargent, Souvaine, Zimmer, Zuber, Cordova and Woert3 from the National Science Board found that between 2008 and 2012, state and local support for R1 public institutions of higher education fell steeply with a compensating increase in the tuition; other reportsReference Hinrichs6–Reference Mitchell, Leachman and Masterson9 have similar findings. Simultaneously, tuition at private R1 institutions increased. The combination caused a rise in student debt. The two largest core expenditures at R1 institutions are research and instruction,Reference Arvizu, Droegemeier, Anderson, Ball, Bassler, Beachy, Bienenstock, Cerf, Chandler, David, Fung, Groves, Jackson, Lepage, Leshner, Lineberger, Mayo, Panchanathan, Peterson, Richmond, Sargent, Souvaine, Zimmer, Zuber, Cordova and Woert3 and between 1987 and 2012, research expenditures for full-time equivalents (FTEs) increased by 90% at public institutions and by 75% at private institutions. A report10 from the National Science Board showed that total state expenditures at major public research institutions increased by 18% during 2000–2010, while FTE enrollment increased by 22%.
A 2016 newspaper articleReference Ross11 noted that according to the US Department of State Bureau of Educational and Cultural Affairs, the overall number of international students enrolled in undergraduate and graduate degree programs, as well as in nondegree granting programs, has increased by approximately 85% between 2005–2006 and 2015–2016. The report further noted that in 2015–2016, 20.8% of all international students were studying engineering at both the undergraduate and graduate levels. At many institutions with large MS&E enrollments, such as Penn State and the University of Illinois at Urbana-Champaign, a substantial fraction of the undergraduate student population (greater than 20%) is made up of international students, a trend that has increased over the last decade.
A third factor that is a likely contributor to growth, but that is more difficult to quantify, is the generalization of materials programs. The total number of materials degree-offering institutions has grown from approximately 104 to 114 from 2000 to 2016. Over this time, there has also been a trend in the larger degree-issuing institutions in which students are given more freedom in steering their materials degree toward multiple materials categories and applications. This freedom to navigate the undergraduate curriculum enables MS&E to be especially accessible to students transferring to MS&E from other disciplines.
A fourth factor to consider is the extensive outreach in which many MS&E programs have engaged over the last two decades. At Penn State, 10–15% of incoming MS&E freshmen over the last five years indicated that they attended an ASM Materials Education Foundation or similar camp while they were in high school.12 All of the Penn State students surveyed indicated that the camps were instrumental in their forming an interest in, and appreciation for, materials science and engineering as a discipline. It is likely that such camps are contributing in a significant way to the growth of the undergraduate student population in the field.
We next consider the implications of the dramatic increases in the number of students pursuing undergraduate degrees in MS&E. The first is the way the change in undergraduate enrollment correlates with graduate degrees awarded in MS&E. While the largest increase was in BS degrees, there was substantial growth in the number of masters’ and PhD degrees awarded over the same period, as indicated in Figure 5. Relative to all engineering degrees awarded in the United States, MS&E witnessed larger percentage increases for all three degrees, with the biggest percentage increases relative to engineering as a whole for BS and PhD degrees. This indicates that graduate programs are absorbing a significant number of the undergraduate students produced in the field.
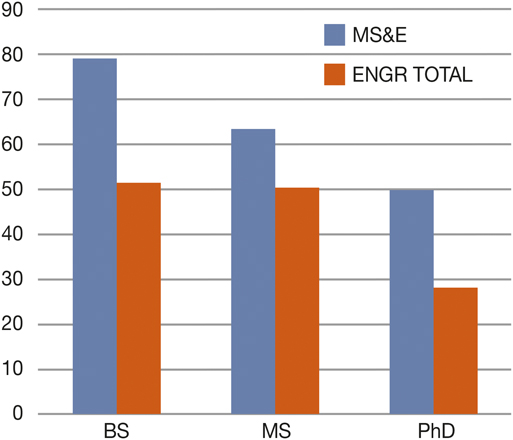
Figure 5. Percent increase in degrees awarded since the academic year 2008–2009. The blue bars represent MS&E and the orange bars represent engineering overall. Data obtained from ASEE (www.asee.org/papers-and-publications/publications/college-profiles).
The next area we consider is the impact of the large enrollment on employment opportunities in industry. A 2014 reportReference Parker13 from Burns & McDonnell concluded that demand for engineers in the United States continues to be strong, driven by the growth of industries such as the energy sector, as well as the retirement of baby boomers (the generation of Americans born between early-to-mid 1940s and 1964). A 2016 report from the World Economic Forum14 projects that drivers of strong employment growth in the broad area of architecture and engineering include materials-specific processes such as 3D printing, additive manufacturing, and advanced materials manufacturing in addition to the overarching themes of resource-efficient sustainable production and robotics. This analysis is consistent with a 2017 report15 by Kelly Services that found the growth areas for jobs in engineering to be automation and robotics, additive manufacturing, and the industrial Internet of Things.
It is instructive to compare the industrial demand for MS&E graduates to the demand for those in other areas of engineering that have also witnessed large enrollment growth. An analysis from the EMSIReference Wright16 showed that the United States has approximately 1.6 million engineering jobs. Of these, 274,000 are in civil engineering, 264,000 are in mechanical engineering, and 229,000 are in industrial engineering. From 2010 to 2014, engineering jobs grew 7% overall, with the newest jobs in the area of mechanical engineering. During a similar time between 2007 and 2014, the article reported that the output of engineering graduates increased 33%. Thus, the large number of mechanical engineers does not appear to be negatively affecting job growth in the field, something that has the potential to be true for MS&E as well. In addition, 19% of all engineers are 55 or older, indicating that the need for new talent will continue to grow across all engineering disciplines. A 2014 reportReference Parker13 by Burns & McDonnell indicated that 30% of the workforce in engineering is made up of electrical and mechanical engineers, and finding good talent in these areas is challenging. This is despite the increased output of mechanical engineers over the last few years.
Several factors may influence the observed trends in undergraduate student enrollments in MS&E across the United States. The first is a decrease in the number of international undergraduate students pursuing the degree. Of the 2013 graduates in engineering, Forbes reported that 80% were men, indicating that the gender imbalance continues. Additionally, 79% were US citizens, and 20% were nonresident noncitizens, according to the National Center for Education Statistics.Reference Wright16 Thus, a restriction on visas and/or having a substantial number of international students decide against attending college in the United States would have a significant negative impact on the number of engineers, including materials engineers, produced in the United States. At Penn State and elsewhere, a significant decrease was indicated in the number of international first-year students attending at the start of the 2017–2018 academic year relative to the last six years, which may be the start of a new trend.
A second factor is the cost of higher education. The latest indicatorsReference Seltzer17 show that state support for higher education is increasing in the United States, although this varies greatly by state. Should state support increase dramatically and tuition rates level off or increase more slowly than in recent years, the number of students focusing on engineering, and MS&E, may increase. If state support for higher education does not increase and/or the cost of pursuing higher education increases dramatically, the overall number of students obtaining undergraduate degrees of any kind, including MS&E, would also be expected to be negatively impacted.
A third factor is that as MS&E departments grapple with the logistics of increased enrollments, it is likely that efforts to recruit new undergraduate students may decline, leading to a corresponding plateau in increasing enrollments.
Lastly, the industrial need for college graduates with training in STEM disciplines and MS&E, in particular, shows no signs of abating. It is likely that for students who are able and willing to obtain an undergraduate degree from a university in the United States, interest in science and engineering will continue to be strong.
Acknowledgments
The authors thank the members of the University Materials Council who generously shared information about their enrollment trends.


