


1. Introduction
Economic activity was severely disrupted in 2020 by the coronavirus pandemic, and governments supported peoples’ incomes and kept businesses alive by means of spending and lending programmes financed by borrowing. This paper describes how governments borrowed in the United States and the United Kingdom. It shows how central banks in practice managed not just short-term interest rates but also yields on government bonds, and how their ability to resist a post-coronavirus surge in inflation has been compromised.
2. The initiation of the government securities purchasing programmes
In order to contain the economic impact of lockdowns, the U.S. and U.K. governments, like most governments around the world, have run huge fiscal deficits. The main feature of government debt management in both countries has been heavy purchases of government securities by their central banks. The purchases began in March after market liquidity became impaired, and their initial motivation was to restore market functioning.
In the United States, an avalanche of sales in March and April overwhelmed the capacity of the primary dealers in government securities to accommodate them. Foreign investors sold $498 billion of Treasury notes and bonds in those 2 months, compared with monthly average sales of $6 billion over the year to February 2020.Footnote 1 The Federal Open Market Committee promptly announced that it would purchase U.S. Treasury securities ‘in the amounts needed to support smooth market functioning and effective transmission of monetary policy to broader financial conditions and the economy’.Footnote 2
In the United Kingdom, the gilt-edged market weakened sharply on 18th March, when the 20-year yield rose from 1.05 per cent to 1.36 per cent, and ceased to function on the 19th after a gilt auction. The Debt Management Office feared that it would be unable to sell as many gilts as it needed to without extraordinary support.Footnote 3 The Bank of England Monetary Policy Committee held an emergency meeting that day and decided on its first quantitative easing operation of 2020: it resolved to buy £200 billion of gilts, and later decided on a further £250 billion, which would take its total gilt holdings to £875 billion. Its stated objective was to ‘improve the functioning of the gilt market and help to counteract a tightening of monetary and financial conditions that would put at risk the MPC’s objectives’.Footnote 4
3. How the programmes evolved
In the United States, the Fed had bought $1.4 trillion of Treasury coupon securities (gross) by the end of April. The purchase rate decreased during April and May, and at the time of writing (January 2021) is about $80 billion a month, plus $40 billion of mortgage-backed securities, in all about 7 per cent of gross domestic product (GDP) (figure 1).Footnote 5 The Fed has undertaken to maintain this purchase rate ‘until substantial further progress has been made toward the Committee’s maximum employment and price stability goals’.Footnote 6
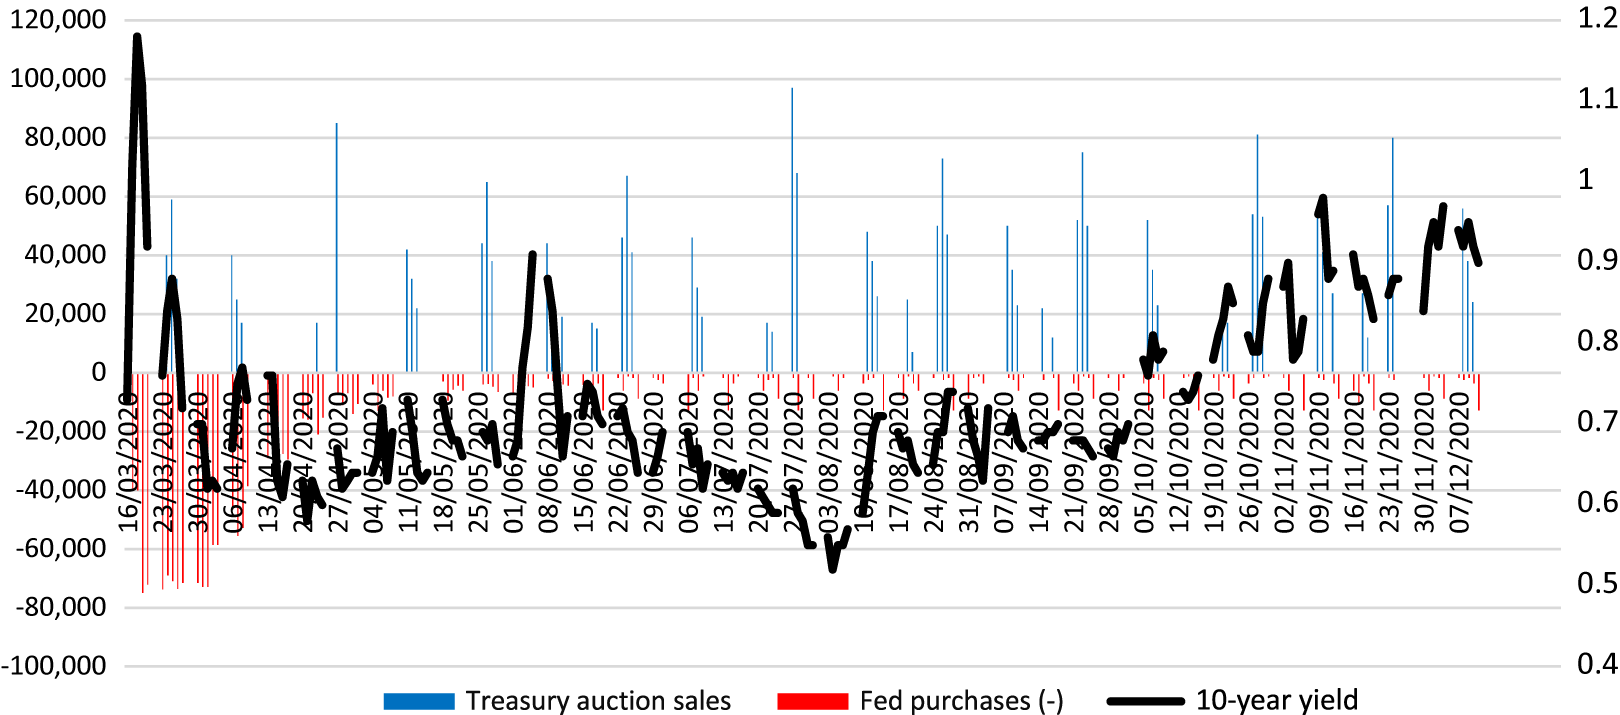
Figure 1. (Colour online) Fed purchases and U.S. Treasury sales of coupon securities ($ million, lhs) and yields (per cent, rhs)
Sources: Fed purchases: https://www.newyorkfed.org/markets/pomo/operations/priorTwoWeeks.html; Treasury auction sales: https://www.treasurydirect.gov/instit/annceresult/press/press.htm; yields: https://www.treasury.gov/resource-center/data-chart-center/interest-rates/Pages/TextView.aspx?data=yield.
Yields fell after the March announcement and continued to fall until August, after which they reversed most of the earlier fall (figure 1). The reversal was probably a reaction to the Fed’s restatement on 27th August of its longer-run inflation goals, in which it said that it would aim for inflation ‘that averages 2 per cent over time’, and that it would compensate for periods of persistently below target inflation by aiming for moderately above-target inflation for a period; it might also have reflected the slower pace of Fed purchases.Footnote 7
In the United Kingdom, the Bank of England had bought £94 billion of gilts (gross) by the end of April. The purchase rate decreased more gradually than in the United States, and at the time of writing is £19 billion a month, or about 11 per cent of GDP per annum.Footnote 8 Yields fell from mid-March to mid-May; after August they were higher but with no clear trend (figure 2).
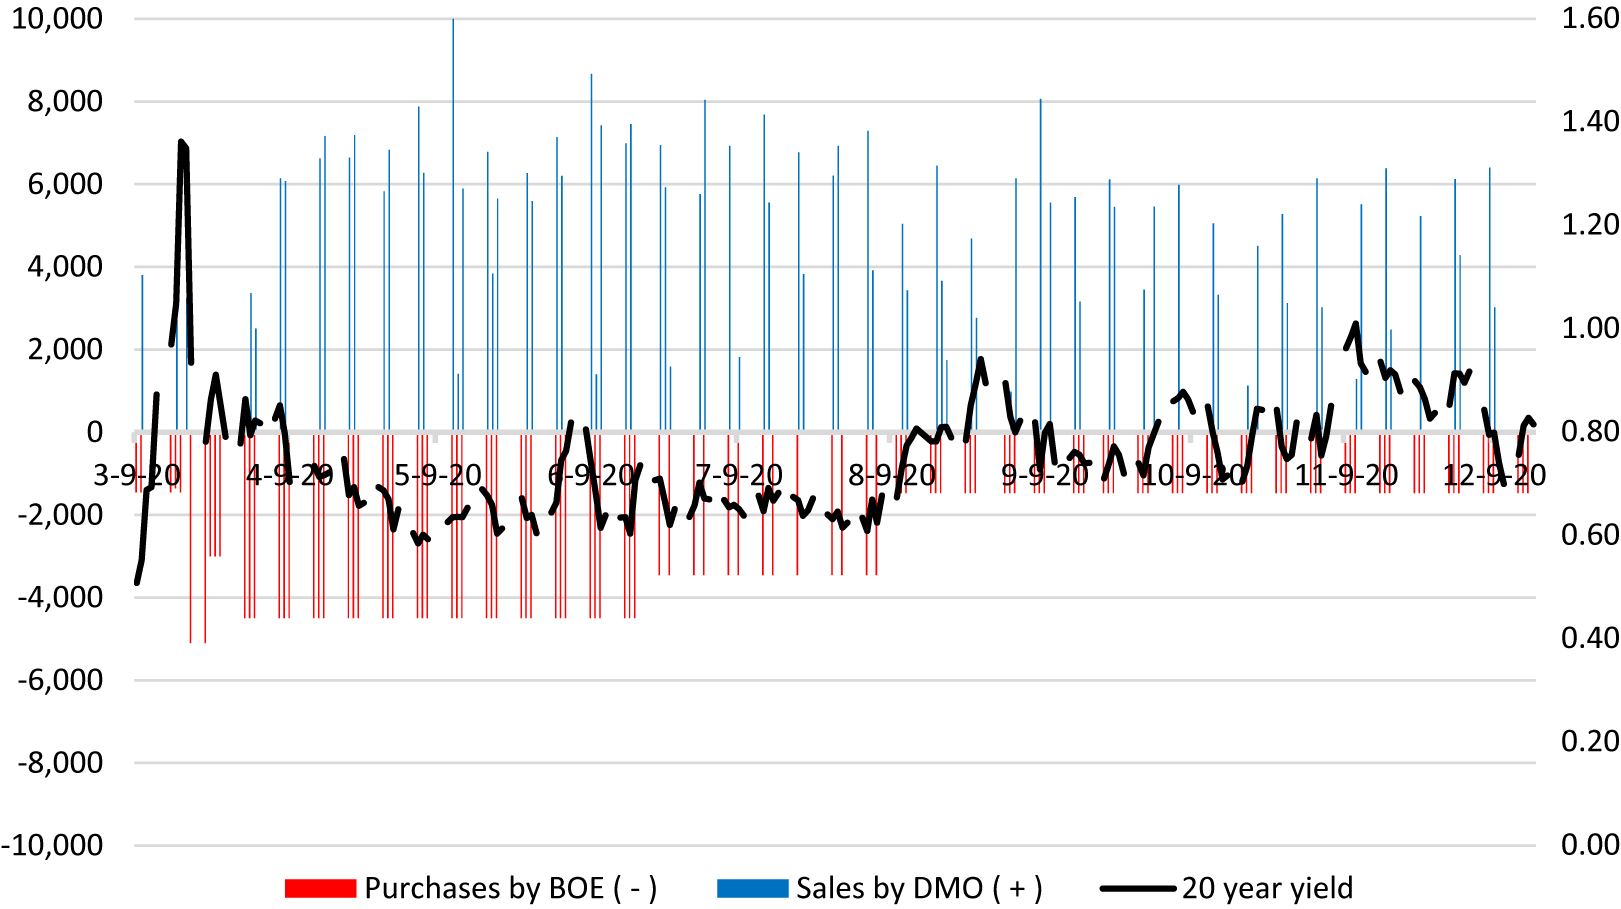
Figure 2. (Colour online) Bank of England gilt purchases and DMO sales (£ million, lhs) and yields (per cent, rhs)
Sources: BOE purchases: https://www.bankofengland.co.uk/markets/bank-of-england-market-operations-guide/results-and-usage-data; DMO sales: https://www.dmo.gov.uk/data/gilt-market/results-of-gilt-operations/; yields https://www.bankofengland.co.uk/statistics/yield-curves.
The patterns of government financing in the two countries were similar (table 1). In neither country were there substantial net sales of government coupon securities to the market; both governments relied largely or exclusively on short-term financing. In both countries, the ratio of short-term interest-bearing public debt (Treasury bills an
Table 1. Central government financing, March–November 2020, USA and UK
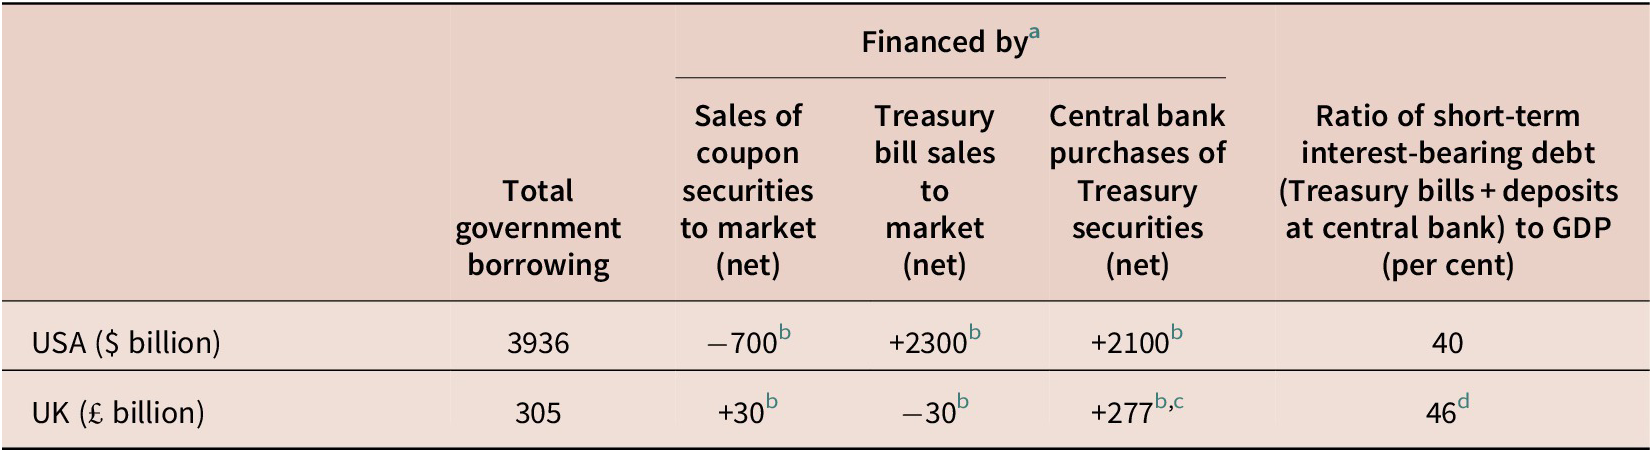
Sources: USA: Government Accountability Office (2020), Federal Reserve table H4–1; UK: Office for National Statistics, Bank of England table D2.3.1; author’s estimates.
a Some financing items have been omitted, but they are not material in aggregate.
b Approximate. Approximations are necessary because some of the data are weekly and some monthly.
c Gilts only.
d After end of current QE program.
d deposits at the central bank) to GDP is in the range 40–50 per cent, compared with 5 per cent in the USA and 3 per cent in the UK at the end of 2006, before the financial crisis.
4. Interpretation
Both central banks referred to ‘market functioning’ in March when they announced their plans to purchase government securities, and it is clear that they were concerned about deteriorating market liquidity, including the risk that governments would not be able to sell bonds at auctions to meet their borrowing needs.Footnote 9 They acted as market-makers of last resort.
In both countries, the amounts purchased went far beyond what might have been needed for market-making purposes. The positions of the primary dealers in U.S. government securities, which were bloated in March, had returned to normal levels by 15th April, but the Fed purchased over $750 billion after then (up to 11th December).Footnote 10 In fact, both governments relied entirely or almost entirely on short-term finance for new borrowing, and both central banks adapted their monetary policies to accommodate about half (Fed) or nearly all (Bank of England) of their government’s financing needs.
Both central banks avoided appearing to fix yields by adopting the reverse auction technique for purchases, in which the quantity to be purchased is pre-announced and the yield determined by the auction process.Footnote 11 It is widely believed that governments can borrow large amounts very cheaply for long periods. In fact, the evidence is as yet weak: as already noted, since March there has been no significant net long-term borrowing from market sources by either the U.S. or the U.K. government.
Both central banks decreased the scale of their purchases, but as already noted the Bank of England is nevertheless running at 11 per cent of GDP. It said in March that it wanted to counteract ‘tightening monetary and financial conditions’: its actions thus amounted to a form of yield curve control, though they have not been announced as such and the control is not very precise. If inflationary expectations were to rise, there would probably be another episode of illiquidity in the gilt market, and the Bank would have to choose between increasing its purchase rate and tolerating a period of market illiquidity, and the accompanying interruption to government debt sales and rise in yields.
Yield curve control was used in both countries during the Second World War. After the war, the release of pent-up demand led to surging inflation and yield curve control had to be abandoned. It was not possible to adjust officially targeted yield levels flexibly enough to keep up with volatile inflationary expectations; and at times when inflationary expectations were rising and the target yield levels were too low, monetary policy was perversely expansionary because the central banks became passive buyers of bonds.Footnote 12 More recently, the Bank of Japan has employed yield curve control, but the rate of inflation has not increased. There are reasons to think that the Japanese experience is unlikely to be repeated. Goodhart and Pradhan argue cogently that the low inflation of the past quarter-century has been facilitated by the combination of favourable demographics—falling dependency ratios in rich countries—and the entry into international trade of China and formerly communist eastern European countries.Footnote 13 These factors are going into reverse: dependency ratios are beginning what will be a long and large increase, and the tide of globalisation is ebbing, Brexit being just one example.
During the pandemic, aggregate supply in the world economy has fallen very sharply while demand has been supported by government spending financed by the creation of short-term liabilities. As vaccination programmes progress and when restrictions are relaxed, pent-up consumer demand will be released, and inventories will be rebuilt. Earlier phases of quantitative easing were not inflationary because they compensated for post-crisis contraction of commercial banking. This time, commercial banking has not contracted and money supply has accelerated. There is an obvious inflation risk.
Central banks typically react to threatened inflation by raising short-term interest rates. Yet because the ratios of short-term government debt to GDP are now high, raising short-term interest rates would automatically increase budget deficits: in both the United States and the United Kingdom, a 1 percentage point increase in interest rates would quickly add 0.4–0.5 percentage points to the budget deficit/GDP ratio, as the Office for Budget Responsibility has noted in the U.K. case.Footnote 14 The outcome of the ensuing conflict between monetary policy and fiscal policy would be uncertain. In the U.S.A. the Fed has a statutory price stability mandate, which gives it a degree of independence, but history shows that it is not immune to political pressure.Footnote 15 In the U.K., the government can overrule the Bank of England’s decisions, or change its price stability remit.
Yield curve control is dangerous when pent-up demand is released, and particularly for central banks which make decisions only eight times a year. Events can easily run away from them. Eleven years of on-and-off quantitative easing have compromised central banks’ ability to resist any resurgence of inflation. If central banks are serious about price stability, they must curtail purchases of government securities and enforce greater market involvement in the financing of government borrowing.Footnote 16
The purpose of making price stability an overriding economic policy objective is to prevent the use of the inflation tax.Footnote 17 If coronavirus relief programmes are not to be financed by the inflation tax, then they will have to be financed by other taxes.
Acknowledgements
This paper was written in close collaboration with Richhild Moessner of CESifo. I am extremely grateful to her, and to Jagjit Chadha and Corrado Macchiarelli for helpful comments. The views expressed are those of the author and should not be taken to reflect those of the National Institute for Economic and Social Research.


