


1. Introduction
Recent years have seen considerable interest in the level of pay in the public sector in the UK, and how it compares to that in the private sector, in particular because public sector pay growth has been constrained as part of the fiscal consolidation since 2010. However, pay in the form of a wage or salary is not the only form of remuneration that employees receive. The promises made by employers in the form of pension rights, or the contributions made by employers to pension schemes, are an important form of remuneration, albeit of a deferred form, and one that varies significantly between the public and private sectors. Importantly, there have been considerable changes in the provision of workplace pensions in recent years, which have affected public and private sector workers in different ways.
In particular, there has been a steady decline in the proportion of private sector workers who are active members of a Defined Benefit (DB) pension scheme. According to the Annual Survey of Hours and Earnings (ASHE), throughout 1997 to 2012 over 80 per cent of public sector employees were enrolled in a workplace pension (almost all in DB schemes). In the private sector, membership fell from 50 per cent in 1997 to 36 per cent in 2012, driven by the fall in the proportion who were active members of a DB scheme, which fell from 38 per cent to 12 per cent (see Appendix figure A1).
The value, as well as membership, of workplace pensions has changed. In particular, there have been successive reforms to public sector pension schemes. The last Labour government increased the age at which most public sector workers can draw an unreduced pension (the ‘Normal Pension Age’ or NPA) from 60 to 65, although this was only for new entrants to the schemes since 2007/8. The Coalition government increased members' pension contributions and changed the measure of inflation used to index pension rights to the Consumer Prices Index (CPI) from the Retail Prices Index (RPI). It also implemented the recommendations of a review of public service pensions carried out by Lord Hutton, which has led to the future accrual being based on career average earnings rather than final salary and alignment of the NPA with the State Pension Age.
The contribution of the analysis in this paper is that we consider how a measure of remuneration including both pay and pensions differs between public and private sector workers and how this differential has changed over time. We account for trends in pension membership, how employee contributions have changed, and the effects of successive reforms to public sector DB pensions. Moreover, we allow for changes in life expectancy, annuity rates and composition of the workforce, which can – and do – affect the estimated generosity of pensions.
This paper builds upon a literature of other work that estimates the value of elements of remuneration other than headline pay. Our work is most closely related to the analysis in Reference Disney, Emmerson and TetlowDisney et al. (2009) and Reference Crawford, Emmerson and TetlowCrawford et al. (2010), who use the British Household Panel Survey (BHPS) to measure the value of workplace pensions. It is also related to the work by Reference Danzer, Dolton and Rosazza-BondibeneDanzer et al. (2016), who estimate how various reforms have affected the value of specific public service pension schemes. Reference Danzer and DoltonDanzer and Dolton (2012) estimate a measure of total reward to working in the private or public sector, incorporating pensions, paid holidays, benefits in kind and health insurance. This paper does not incorporate other differences in non-pension benefits.
The rest of this paper is organised as follows. In Section 2, we describe the methodology and data we employ to value employer contributions to pension schemes. In Section 3, we estimate the value of pensions under different scheme rules and over time and incorporate these estimates into a measure of the differential between remuneration in the public and private sectors. Section 4 concludes.
2. Methodology and data
There are various ways of measuring the value of employer-provided pensions. In this paper, we use the ‘Current Unit Method’, and build upon the implementation of this method by Reference Disney, Emmerson and TetlowDisney et al. (2009) and Reference Crawford, Emmerson and TetlowCrawford et al. (2010). This method values membership of a scheme in the coming year as the increase in the present discounted value (PDV) of the pension income between now and one year's time, less any employee contributions that are paid to be a member of the scheme. This methodology is set out below.
The PDV (Vt) of a (final salary) DB pension if the employee leaves the scheme in a year t, will be the sum of the present value of three parts: a lump sum paid upon retirement, the annual pension income paid between retirement and death and the annual pension paid to any surviving spouse until their death. This is shown in equation 1:

δ is the discount factor, a is the accrual fraction, and β is the lump sum fraction. It is assumed that a surviving spouse is paid at half the rate of that paid to the scheme member. Vt is also affected by final salary (yt), pension tenure (number of years in the pension scheme, nt) and the number of years from t until their NPA (r), from t until death (T) and from t until partner's death (Tp). We then measure the value of pension accrual as the difference between the PDV in year t and t+1, as is shown in equation 2:

We then subtract the amount of employee contributions that the employee has made to the pension to get ‘one-period net pension accrual’. It is important that we account for inflation. In particular, the annual pension income (αntyt) and lump sum (βntyt) need to be measured in constant prices, and therefore pay growth (yt+1–yt) in equation 2 must be real pay growth. In this paper we measure inflation using the CPI.
We want to value Defined Contribution (DC) pensions in a way that is consistent with that used for DB schemes. We take the combined employee and employer contribution rate (c), times their earnings (y t) which is the total contributed to the pension scheme in a given year. This additional contribution receives a real investment return (x) until the point at which an annuity is bought (at rate π), which provides a stream of income until death. Pension accrual is therefore given by equation 3:

Once again, we subtract the employee's own contributions to calculate the ‘one period net pension accrual’ for a DC pension. This will differ from simply taking the employer contribution as a share of their salary only to the extent to which high (low) investment returns and annuity rates, relative to the discount rate, boost (depress) the value of employer and employee contributions to a DC pension.
No single nationally-representative dataset contains all the information needed to estimate the changing value of workplace pensions in the UK over time. We therefore make three important decisions in order to allow us to calculate pension accrual. First, for those in DB pension schemes, we use example scheme rules for the public and private sectors, which are the rules of ‘typical’ schemes in each sector. We use the same rules as Reference Disney, Emmerson and TetlowDisney et al. (2009). These rules are based on findings from National Association of Pension Funds that show there is little heterogeneity (within sectors) in pension scheme rules.
Second, we use the Labour Force Survey (LFS) as our ‘base’ dataset. This means we calculate membership of a pension and their net pension accrual for each employee who reports their earnings in the LFS. In 2012, our sample size is 39,294. We use the LFS data because it is a long running dataset containing measures of education, which is necessary for estimating pay profiles. We use all public sector workers in our analysis, and compare them to all private sector workers after controlling for observed differences in their characteristics (see section 3b). Third, we make a number of other simplifying assumptions (some are technical) which we set out below. For more details, see Appendix table A1 and Section 3 of the working paper version of this paper (Reference Cribb and EmmersonCribb and Emmerson, 2014).
Two assumptions affect the value of pensions for all pension scheme members. The first is the discount rate. We use a discount rate of 3 per cent + CPI (a real discount rate of 3 per cent), consistent with official valuations of unfunded public service pensions (HM Government, 2011). The second is that each individual dies at their life expectancy. Each individual's life expectancy is measured as their age/sex-specific cohort life expectancy made closest to the point at which they are observed in the data, and adjusted for the differential mortality by social class estimated by the ONS in the mid 2000s.
The ‘typical’ DB scheme rules for the public and private sector are set out in Appendix table A1. Given that these schemes involve indexation of pensions in deferral and payment to RPI, we need to make an assumption about the gap between RPI and CPI. We use the estimate produced in Office for Budget Responsibility (2015), that in the long run, CPI is 1.0 percentage points per year lower than RPI. When we estimate the value of new ‘Career Average’ schemes in the public sector, we use the new scheme rules for the NHS Pension scheme (see Reference Danzer and DoltonPensions Policy Institute, 2013).
Since we do not observe pension membership or contributions in the LFS, we impute these from ASHE. In ASHE we calculate the proportion of employees in each year, in sex/age/sector/occupation ‘cells’,Footnote 1 who are an active member of a DB pension, DC pensionFootnote 2 or no workplace pension, and impute pension membership in the LFS such that the same proportion of employees in the LFS in each cell have a DB/DC/no workplace pension. We impute employee contributions by calculating mean employee contribution rates in the same cells in each year for DB members and DC members in ASHE and assigning each imputed member of a pension scheme in the LFS this mean contribution rate depending on their ‘cell’.
We impute pension tenure in DB schemes from the British Household Panel Study (BHPS) from 2001 and 2005, based on 32 cells of sector/sex/5-year age bands). We preserve the distribution of pension tenures using a ‘hotdecking’ procedure described in Reference Cribb and EmmersonCribb and Emmerson (2014). We estimate real pay growth as the estimated median hourly wage growth observed at different ages over the period from 1994 to 2006 in the LFS. Following Reference Crawford, Emmerson and TetlowCrawford et al. (2010), this is done separately by sex, sector and education group. We also assume 2 per cent economy-wide real earnings growth per year.
For DC schemes, we impute employer contributions from ASHE in the same way as is done for employee contributions described above. We assume a real investment return of 2 per cent per yearFootnote 3 and for annuity rates, we take the mean sex-specific (no guarantee) age 65 RPI-linked annuity rates in each year.Footnote 4
3. Results
(a) Value of workplace pensions for public and private sector workers
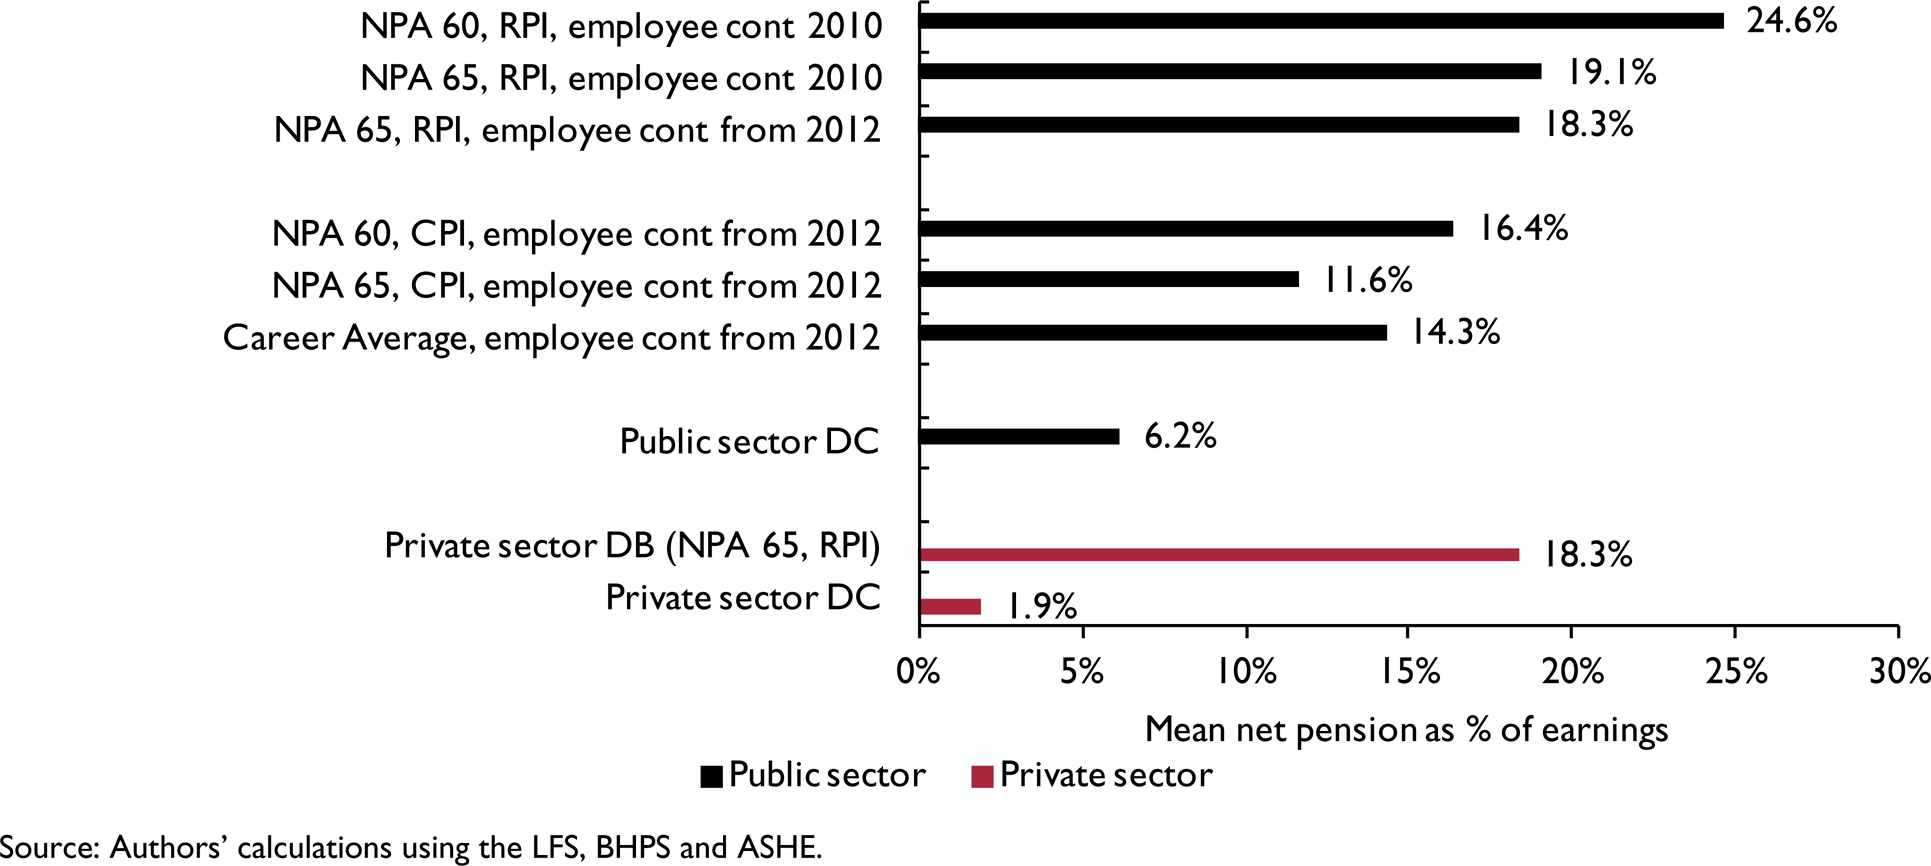
Using the methodology set out in Section 2, we are able to calculate the value of employer-provided pensions under different scheme rules. Figure 1 shows the mean one-period net pension accrual to public sector workers under different rules, estimates for pension accrual for private sector workers in DB schemes, as well as workers in DC schemes in each sector. This is done for 2012.

Figure 1. Mean one-period net pension accrual in 2012 under different example scheme rules
The first row shows that a public sector DB pension scheme with an NPA of 60, indexed to the RPI and with the employee contributions observed in 2010, is estimated to be worth an average of 24.6 per cent of a year's salary. Changing the NPA to 65 reduces the value of a public service pension from 24.6 per cent to 19.1 per cent of salary. There is a slight reduction from moving to the employee contribution rates observed in the data in 2012, as increases to employee contributions were introduced. This is the same value as the average estimated value of private sector DB schemes (which also have an NPA of 65 and are indexed to the RPI).
Moving from RPI to CPI (a lower measure of inflation) indexation reduces pension accrual from 18.3 per cent to 11.6 per cent (both schemes with an NPA of 65). This large impact is due to the compounding impact of uprating the annual pension by 1.0 percentage points less each year (done both in deferral and in payment). Many individuals in 2012 still had an NPA of 60 (those who joined the pension scheme before 2007/8) – for them CPI indexation reduces average pension accrual to 16.4 per cent.
The introduction of Career Average schemes means that, in the long run, mean net pension accrual is estimated to be 14.3 per cent. This is an increase compared to a CPI indexed final salary scheme with an NPA of 65. This is an average, and some will gain from this reform (those with lower pay growth, for whom earnings revaluation of 1.5 per cent + CPI is more generous) and others will lose (those with higher pay growth). Note also, there will be many who, prior to the introduction of Hutton reforms, still had an NPA of 60. For this group, the Hutton reforms reduce the average pension accrual.
The estimates also suggest that while public sector DC schemes are less generous, on average, than public sector DB schemes, they are still more generous than private sector DC schemes. This is primarily because public sector employers, on average, contribute more towards DC pension pots than do private sector employers.
Figure 1 represents a snapshot in time and assumes that each of these schemes is fully in place. However, over time, the generosity of schemes can change. For example, increases in life expectancy increase the value of a DB pension scheme. In addition, some of the reforms to public service pensions are being phased in gradually over time – specifically, the rise in the NPA for many schemes implemented by the last Labour government in 2007/8 only applied to new entrants to these schemes.Footnote 5
Figure 2 examines the changing generosity of employer-provided pensions, showing mean pension accrual across all employees in the public and private sectors. In this analysis, we take the average value, as a share of salary, over all employees in each sector. It therefore includes those workers (often the majority in the private sector) who do not have an employer-provided pension scheme. It shows that there has been a large decline in the average value of workplace pensions to private sector employees, falling from 7 per cent in 1997 to 3 per cent in 2012. This is due to the decline in the provision of DB schemes being only partially replaced with (less generous) DC schemes. For public sector workers, between 1997 and 2007 mean pension accrual rose from 16 per cent to 20 per cent. In absence of any reforms to benefits, in 2012 mean pension accrual for public sector workers would have been 19 per cent (the slight dip due, in part, to the increase in employee contributions observed in 2012).

Figure 2. Estimated mean net pension accrual, by sector, 1997–2012
A key driver of the estimated increase in the generosity of public service pensions over the period from 1997 to 2012 is the increase in the proportion of employees who were a member of these schemes from 81 per cent to 85 per cent (see Appendix figure A1). Changes in the characteristics of scheme members also acted to increase pension accrual. Over the period members of public sector pensions have become more likely to be female, older, better educated and to have had longer pension tenures (see Appendix table A2). All of these factors are associated with greater pension accrual. In addition life expectancy at age 60 of both men and women has increased, increasing pension accrual. These changes are not unique to members of DB pensions in the public sector – similar changes have occurred in the private sector.
Figure 2 allows us to see how various public service pension reforms have affected pension accrual at each point. The introduction of an NPA of 65 for new entrants in 2007/8 led to only a small reduction in generosity, as it only affects a relatively small number of people. Even in 2012, if this were the only reform that had taken place, mean public sector pension accrual would have been only 0.7ppts lower than in absence of this reform.
As was shown in figure 1, the largest impact is the move made by the Coalition government to index public service pensions in deferral and payment to CPI rather than RPI, which was announced in June 2010 and therefore reduces the value of accruals from that point onwards. In 2012, this reform meant that public sector net pension accrual had fallen to just under 13 per cent, 6ppts lower than if the reform had not been introduced, and almost 4ppts lower than the mean pension accrual in 1997.
However, unlike the other reforms we consider, CPI indexation also has the effect of reducing pension accrual in previous years. This is because the pensions accrued in those earlier years will, from 2010 onwards, be indexed less generously. In 1997, the estimated average accrual is reduced from 16 per cent of salary to 13 per cent of salary as a result of the change in indexation. Therefore, the average accrual in each year depends on whether policy at the time is taken (as shown by the solid black line between 1997 and 2009 and then the dotted black line through to 2012) or whether policy as of now is taken (as shown by the solid red line throughout).
In summary, pension accrual is higher, on average, in the public sector than in the private sector. This reflects the fact that more public sector workers are covered by an employer-provided scheme and because the rules of public sector pension schemes tend to be more generous than those in the private sector. The gap between pension accrual levels across the public and private sectors also increased over time between 1997 and 2010 as many private sector DB schemes closed to new entrants. Recent reforms have significantly reduced the generosity of public sector schemes, particularly the shift from RPI to CPI indexation and, for new entrants, the increase in the NPA from age 60 to 65. However, public sector pension schemes remain more generous, on average, than those in the private sector, even after these reforms.
(b) Differential between remuneration of public and private sector workers
Given the large differences between estimated pension accrual in each sector, and the changes over time, we examine what effect the inclusion of employer-provided pensions has on the estimated differential between public and private sector pay. To do this we construct measures of hourly pay including pay in the form of a pension. Hourly pay excluding a pension is simply the weekly earnings divided by usual hours of work per week. To include a pension, we scale this hourly wage rate by the individual's estimated net pension accrual. Therefore if an individual earns £10.00 per hour and has net pension accrual of 15 per cent, his hourly pay including a pension is £11.50 per hour.
To calculate the differential between public and private pay, we use regression analysis, estimating equation (4) by Ordinary Least Squares, separately for each year. We use different measures of remuneration as the dependent variables. This method allows us to control for observed differences in the characteristics of workers in each sector (X).Footnote 6 Having estimated β, we report the percentage differential between public and private remuneration which is: exp(ß)–1.

Table 1 shows the results of this exercise. The first row shows that in 2012, excluding pensions, on average public sector workers are paid 15.1 per cent more per hour than private sector workers, although after controlling for age, sex, education, experience and region, the estimated public sector pay differential is 4.6 per cent (shown in the second row). Unsurprisingly, including the value of pensions increases the estimated differential. Controlling for observed differences in characteristics of the workers, the pay differential would have been 19.4 per cent in 2012 if public service pensions had still been indexed to the RPI. The actual system in place in 2012 is shown in the last column, with a differential of 13.7 per cent, substantially higher than the ‘pay only’ differential.

Figure 3 shows the estimated public pay differentials from 1997 to 2012. The dashed black line shows the differential only counting headline pay. This fell in the late 1990s, rose gradually during the 2000s, before rising more sharply in the aftermath of the recession and fell back in 2012 as the Coalition government implemented a public sector pay squeeze. By 2012, the differential for headline pay was a little lower than it had been in 1997. The solid black line shows that including the estimated value of pensions, but ignoring the shift from RPI to CPI indexation, leads to a much higher value of the estimated differential throughout the period and one that is generally growing over time.

Figure 3. Public sector hourly pay differential including value of workplace pensions, 1997–2012
The dashed red line shows the differential over time, given knowledge of the scheme rules that was available at the time; this assumes that the value of public sector pensions fell in June 2010, when CPI indexation was announced. According to this measure, the differential in remuneration has fallen from 17.3 per cent in 2009 to 13.7 per cent in 2012, almost the same as the 13.5 per cent 1997 and still above the level seen in 2001 and 2002. Finally, the solid red line shows that, because of CPI indexation, the differential between remuneration in the public and private sectors between 1997 and 2010 was now lower than it was previously thought to be.
We also show whether the inclusion of the estimated value of employer-provided pensions has a different effect on the public sector differential across different ages and both sexes. This is shown in table 1. Looking at pay only, in 1997 and 2012, women had a higher public pay differential than men, while people in their twenties have a higher public pay differential than older workers. Including a (CPI-indexed) pension in 2012 and comparing to the ‘pay only’ results, we can see that the increase in differential due to including pension promises is more important for women than for men (the differential increases by 9.7ppts for women compared to 8.3ppts for men). The change in the pay differential accounting for pensions is larger for older workers than for younger workers. This means that the effect of lower discounting for older workers (as they are close to retirement) has a larger impact on the change in the differential than does the fact that fewer young private sector workers are enrolled in a workplace pension than are older private sector workers.
By comparing the fourth and fifth columns of table 1, we can see that the move from RPI to CPI indexed pensions changes the public pay differential for some groups more than others. The differential falls by 5.3ppts for men but 5.8ppts for women, as pensions form a more important part of remuneration for women. The fall for 20–29 year olds is larger (at 6.4ppts) than for 50–59 year olds (4.0ppts) as the compound effect of lower indexation is larger for those further from retirement.
Conclusion
This paper has focused on the changing levels of pension accrual in the public and private sectors over the period from 1997 to 2012 and the effect these trends have had on the differential between public and private sector remuneration. We incorporate changing trends in pension membership, changes in employee contributions and successive reforms to public sector pensions. Moreover, we allow for changes in life expectancy, annuity rates and composition of the workforce, all of which can affect the generosity of pensions. Even when incorporating the effects of recent reforms, on average, public sector pensions are still more generous than in the private sector.
From 1997 to 2009, average net pension accrual in the public sector rose while it fell significantly in the private sector. As a result, the change in the public sector pay differential excluding pensions underestimates the increase in the differential in remuneration over this period. Looking at headline pay only, the public pay differential fell from 7.1 per cent to 3.1 per cent, but including (RPI-linked) pensions, the differential rose from 13.5 per cent in 1997 to 17.3 per cent in 2009.
From 2009 to 2012, the value of pensions in the public sector has been reduced, primarily because of the decision to CPI-index public service pensions in deferral and payment. Combined with increases to employee contributions in 2012, this means that, from 2009 to 2012, the public sector differential including pensions fell from 17.3 per cent to 13.7 per cent, compared to an increase from 3.1 per cent to 4.6 per cent for pay only.


 Open access