


1. Introduction
Automatic document summarization aims to create a summary that captures the important details in a given text. It has become an important research area, with the massive amount of documents available in social media, online forums, and news articles.
There are two approaches to summarization: extractive and abstractive. Extractive summarization yields a summary by selecting parts from the given document. As such, it is guaranteed to generate grammatically correct sentences, however, the resulting summary is constrained to use sentences in the input text. In contrast, abstractive summarization constitutes a potentially more powerful approach, as it captures the semantic of the input and generates sentences to summarize it. However, the challenge in this approach lies in producing faithful summaries that are also natural and grammatically correct.
The two most popular approaches for abstractive summarization are based on supervised learning and reinforcement learning. In supervised learning models, a teacher-forcing algorithm is widely used to maximize the log-likelihood of the ground-truth sequence given the input text, or equivalently minimizes the negative log-likelihood loss (Bengio et al. Reference Bengio, Vinyals, Jaitly and Shazeer2015; Ranzato et al. Reference Ranzato, Chopra, Auli and Zaremba2016):
 \begin{equation} L_{ml} = - \sum ^{\textrm{T}}_{t=1} \log{p}({y^*}_{t}|{y^*}_{1},\ldots,{y^*}_{t-1},X) \end{equation}
where $y^* = \{{y^*}_{1},{y^*}_{2},\ldots,{y^*}_{T}\}$
is the ground-truth sequence for a given input
$y^* = \{{y^*}_{1},{y^*}_{2},\ldots,{y^*}_{T}\}$
is the ground-truth sequence for a given input $X$
.
$X$
.
In reinforcement learning approaches to abstractive summarization, the idea is to learn a policy that optimizes a specific discrete metric rather than the maximum-likelihood loss. However, optimizing a model does not guarantee that the output will have better quality and readability (Liu et al. Reference Liu, Lowe, Serban, Noseworthy, Charlin and Pineau2016; Paulus, Xiong, and Socher Reference Paulus, Xiong and Socher2018). Paulus et al. (Reference Paulus, Xiong and Socher2018) suggested that a maximum-likelihood training objective can be helpful for the policy learning algorithm to generate more natural summaries, given the fact that it calculates the probability of a token ${\hat{y}}_{t}$
based on the previously predicted sequence
${\hat{y}}_{t}$
based on the previously predicted sequence $\{{\hat{y}}_{1},\ldots,{\hat{y}}_{t-1}\}$
and the input sequence
$\{{\hat{y}}_{1},\ldots,{\hat{y}}_{t-1}\}$
and the input sequence $X$
. Hence, they proposed a mixed training objective, to capture human readability while optimizing the evaluation metrics; this idea is adopted in our work as well.
$X$
. Hence, they proposed a mixed training objective, to capture human readability while optimizing the evaluation metrics; this idea is adopted in our work as well.
The most widely used evaluation metric for summarization is Recall-Oriented Understudy for Gisting Evaluation (ROUGE), which compares an automatically generated summary to a human-generated summary by considering the overlapping units, such as n-grams, word sequences, and word pairs, between them (Lin Reference Lin2004). Although ROUGE is a widely used evaluation metric, it is not very suitable for the evaluation of abstractive summarization systems as it relies on superficial lexical overlap between the ground truth and the generated summaries. Furthermore, for languages with complex morphology, such as Turkish, the ROUGE metric is even less suitable. For instance, both of the following Turkish sentences have the meaning of “I want to call the embassy,” with just a single word of overlap:
Büyükelçiliği aramak istiyorum. (“I want to call the embassy.”)
Büyükelçiliğe telefon etmek istiyorum. (“I want to make a phone call to the embassy.”)
While “ara-mak” (call-INFL) is a verb that takes an object in accusative case, “telefon et-mek” (phone-INFL) is a compound verb in Turkish and the equivalent of the accusative object in the first sentence is realized with a noun in dative case (highlighted with underline). Although, these sentences are semantically equivalent, considering the first one as the ground truth and second one as the generated sentence, ROUGE-1, ROUGE-2, and ROUGE-3 scores of these sentences would be 0.25, 0, and 0.25, respectively.
Another metric widely used for summarization evaluation is BLEU, which is a precision-based metric that is mainly used for automatic evaluation of machine translation (Papineni et al. Reference Papineni, Roukos, Ward and Zhu2002). It measures how many n-grams in the generated summary appear in the ground-truth summary, and also uses a brevity penalty to discourage generated summaries that are shorter than the ground-truth summary. Similar to ROUGE, BLEU is also a simple measure that is not fully suited for evaluating summarization quality. Furthermore, with either one of these two metrics, there is an inconsistency between the training objective and the evaluation measure. In other words, while training is done by maximum-likelihood objective, testing is done by BLEU or ROUGE metrics that are based on the number of matching n-grams between the generated summary and the corresponding ground-truth summary. On the other hand, we cannot use these two metrics as the training objective, as they are not differentiable. However, recent studies show that reinforcement learning can use non-differentiable evaluation measures (Bahdanau et al. Reference Bahdanau, Brakel, Xu, Goyal, Lowe, Pineau, Courville and Bengio2016; Rennie et al. Reference Rennie, Marcheret, Mroueh, Ross and Goel2017; Paulus et al. Reference Paulus, Xiong and Socher2018).
Based on the mentioned issues, we focus on two main challenges in abstractive summarization: How to evaluate the results and what is a good training objective. In Beken Fikri, Oflazer, and Yanıkoğlu (Reference Beken Fikri, Oflazer and Yanıkoğlu2021), we proposed alternative evaluation measures; here we also propose a reinforcement learning framework for abstractive summarization that uses these measures.
For evaluation, we propose to use the similarity between the sentence embeddings of the generated summary and the corresponding ground-truth summary, obtained by the BERTurk model using a bi-encoder or cross-encoder architecture. Both models are fine-tuned on the Turkish Semantic Textual Similarity benchmark (STSb-TR) (Beken Fikri et al. Reference Beken Fikri, Oflazer and Yanıkoğlu2021) and Turkish Natural Language Inference (NLI-TR) (Budur et al. Reference Budur, Özçelik, Güngör and Potts2020) datasets, which are translated from the original datasets for English. We then train an abstractive summarization model using a deep reinforcement learning framework, where the proposed similarity metric is used as the reward signal.
To the best of our knowledge, this is the first study to explore large language models fine-tuned with a translated dataset to obtain similarity measures. Similar to BERTScore, these measures are based on Bidirectional Encoder Representations from Transformers (BERT) but differ by evaluating sentence-level similarity rather than token-by-token comparison.
Our paper is structured in the following way: In Section 2, we review recent studies in abstractive summarization systems. Then, we explain our methodology in Section 3. In Section 4, we describe our experiments and report our quantitative results as well as qualitative analysis. In Section 5, we discuss our findings and limitations. Finally, in Section 6, we present our conclusions.
2. Related work
Here we provide a summary of research on abstractive summarization and evaluation metrics. This section is divided into three subsections, each focusing on different aspects of the field.
2.1. Supervised learning based approaches
State-of-the-art abstractive summarization models are based on neural sequence-to-sequence models (Sutskever, Vinyals, and Le Reference Sutskever, Vinyals and Le2014). Initial work by Rush et al. (Reference Rush, Harvard, Chopra and Weston2015) introduced neural sequence-to-sequence abstractive sentence summarization model with an attention-based encoder and a feed-forward neural network language model decoder. Chopra, Auli, and Rush (Reference Chopra, Auli and Rush2016) presented another abstractive summarization model with a convolutional attention-based encoder and a recurrent neural network (RNN) decoder. Nallapati et al. (Reference Nallapati, Zhou, dos Santos, Gülçehre and Xiang2016) further explored RNNs for both encoder and decoder, with a novel switching generator pointer approach to address out-of-vocabulary words. In a later work, multi-sentence abstractive text summarization was addressed by See, Liu, and Manning (Reference See, Liu and Manning2017) through a hybrid pointer generator network and a coverage mechanism (Tu et al. Reference Tu, Lu, Liu, Liu and Li2016). Subsequent work by Gehrmann, Deng, and Rush (Reference Gehrmann, Deng and Rush2018) was built upon the pointer generator summarization model by introducing content selection for relevant document portions and a bottom-up copy attention mechanism.
Recent advances in pre-trained language models have significantly enhanced text summarization as well. Liu and Lapata (Reference Liu and Lapata2019) introduced BERTSum exploring the use of BERT in text summarization framework, using both extractive and abstractive approaches. Meanwhile, Dong et al. (Reference Dong, Yang, Wang, Wei, Liu, Wang, Gao, Zhou and Hon2019) introduced the Unified Pre-trained Language Model with unidirectional, bidirectional, and sequence-to-sequence language modeling objectives. In a prominent work, Raffel et al. (Reference Raffel, Shazeer, Roberts, Lee, Narang, Matena, Zhou, Li and Liu2020) presented the text-to-text-transfer-transformer (T5) pre-trained on the new open-source dataset called the Colossal Clean Crawled Corpus (C4) they introduced. In T5, every text processing problem is considered in a text-to-text framework, and a single model can be trained with the same loss function and decoding process on different NLP tasks. Additionally, Lewis et al. (Reference Lewis, Liu, Goyal, Ghazvininejad, Mohamed, Levy, Stoyanov and Zettlemoyer2020) proposed BART, a denoising autoencoder for pre-training sequence-to-sequence models. Pre-training occurs in two steps: First, an arbitrary noising function is used to corrupt the text. Then, BART is trained to reconstruct the original text. The authors observed improved summarization results. Zhang et al. (Reference Zhang, Zhao, Saleh and Liu2020a) introduced PEGASUS, a transformer-based encoder-decoder abstractive summarization model with gap-sentence generation. Furthermore, Qi et al. (Reference Qi, Yan, Gong, Liu, Duan, Chen, Zhang and Zhou2020) presented ProphetNet, a sequence-to-sequence pre-training model based on transformer (Vaswani et al. Reference Vaswani, Shazeer, Parmar, Uszkoreit, Jones, Gomez, Kaiser and Polosukhin2017), with future n-gram prediction and n-stream self-attention mechanism. Several recent works proposed abstractive summarization methods built upon existing large language models (LLMs) (e.g. GSum Dou et al. Reference Dou, Liu, Hayashi, Jiang and Neubig2021, SimCLS Liu and Liu Reference Liu and Liu2021, SeqCo Xu et al. Reference Xu, Zhang, Wu and Wei2022, and BRIO Liu et al. Reference Liu, Liu, Radev and Neubig2022).
Unlike English, abstractive summarization studies using LLMs in Turkish remain relatively underexplored. A recent noteworthy study in this direction was conducted by Baykara and Güngör (Reference Baykara and Güngör2022a) who introduced a new Turkish summarization benchmark dataset named TR-News. The authors experimented with BERTSum and pointer generator networks by incorporating linguistically-oriented tokenization techniques. Another significant contribution conducted a comprehensive analysis of BERT models, mBART (Liu et al. Reference Liu, Gu, Goyal, Li, Edunov, Ghazvininejad, Lewis and Zettlemoyer2020), and multilingual text-to-text-transfer-transformer (mT5) model (Xue et al. Reference Xue, Constant, Roberts, Kale, Al-Rfou, Siddhant, Barua and Raffel2021) on the Turkish text summarization and title generation tasks (Baykara and Güngör Reference Baykara and Güngör2022b). They evaluated their models on the TR-News and MultiLingual SUMmarization (MLSum) (Scialom et al. Reference Scialom, Dray, Lamprier, Piwowarski and Staiano2020) Turkish datasets, focusing on ROUGE scores and presenting baseline results. Notably, the authors observed improved performance across the combined TR-News and MLSum Turkish datasets. In the scope of our study, we opted for the utilization of the mT5 model, renowned for its exceptional performance as showcased on the MLSum Turkish dataset (Baykara and Güngör Reference Baykara and Güngör2022b).
More recently, reinforcement learning-based approaches have gained more interest in abstractive summarization, as discussed in the next section.
2.2. Reinforcement learning approaches
Paulus et al. (Reference Paulus, Xiong and Socher2018) introduced a neural summarization model in which ROUGE scores were optimized as a reward. The authors adopted self-critical policy gradient training algorithm (Rennie et al. Reference Rennie, Marcheret, Mroueh, Ross and Goel2017) and applied a mixed training objective function. Their method showed enhanced readability of generated summaries and suitability for longer output sequences. Policy-based reinforcement learning has been widely adopted for text summarization tasks with various rewards (e.g. Chen and Bansal Reference Chen and Bansal2018; Sharma et al. Reference Sharma, Huang, Hu and Wang2019) and explored with mixed training objectives (e.g. Pasunuru and Bansal Reference Pasunuru and Bansal2018; Kryściński et al. Reference Kryściński, Paulus, Xiong and Socher2018; Zhang and Bansal Reference Zhang and Bansal2019; Scialom et al. Reference Scialom, Lamprier, Piwowarski and Staiano2019). In further studies, Böhm et al. (Reference Böhm, Gao, Meyer, Shapira, Dagan and Gurevych2019) introduced a reward function learned from human ratings, resulting in improved summarization quality and outperforming state-of-the-art systems. Similarly, Stiennon et al. (Reference Stiennon, Ouyang, Wu, Ziegler, Lowe, Voss, Radford, Amodei and Christiano2020) enhanced summary quality by training models to predict human-preferred summaries, utilizing this predictive model as a reward function for reinforcement learning-based policy fine-tuning. Meanwhile, Zhang et al. (Reference Zhang, Zhao, Saleh and Liu2020c) developed a framework to evaluate the factual correctness of a generated summary using an external information extraction system that compares it against the human reference summary. They jointly optimized factual correctness, textual overlap, and language model objectives via reinforcement learning. In another work, Laban et al. (Reference Laban, Hsi, Canny and Hearst2020) proposed an unsupervised abstractive summarization model that generates summaries directly from source documents by optimizing coverage, fluency, and brevity using reinforcement learning (RL)-based rewards. Yadav et al. (Reference Yadav, Gupta, Abacha and Demner-Fushman2021) introduced two novel question-aware semantic rewards for abstractive question summarization: (1) question-type identification and (2) question-focus recognition. They integrated these rewards into an encoder-decoder-based ProphetNet transformer model (Qi et al. Reference Qi, Yan, Gong, Liu, Duan, Chen, Zhang and Zhou2020) by utilizing the mixed training objective proposed by Paulus et al. (Reference Paulus, Xiong and Socher2018). Recent studies employed reinforcement learning to generate multiple summaries with varying lengths for a given text (Hyun et al. Reference Hyun, Wang, Park, Xie and Yu2022) and to optimize factual consistency of generated summaries (Roit et al. Reference Roit, Ferret, Shani, Aharoni, Cideron, Dadashi, Geist, Girgin, Hussenot, Keller, Momchev, Ramos Garea, Stanczyk, Vieillard, Bachem, Elidan, Hassidim, Pietquin and Szpektor2023).
Similar to the prevalence of supervised learning approaches in English, RL studies for abstractive summarization are abundant. However, in the context of Turkish, such studies are notably scarce. The reinforcement learning framework proposed in this paper draws parallels with Yadav et al. (Reference Yadav, Gupta, Abacha and Demner-Fushman2021) as we fine-tune BERT-based models to obtain our reward signal. Our goal is to enhance the alignment of predicted summaries with the corresponding ground-truth summaries through a mixed training objective.
While abstractive summarization has seen a steep progress in recent years, research on how to evaluate the quality of generated summaries lagged behind. In the next section, we discuss research in evaluating the quality of generated summaries.
2.3. Evaluation metrics
A number of studies have been conducted to assess the factual correctness of the generated summaries. One notable approach, based on the idea that the source document should entail the information in a summary, was explored by Falke et al. (Reference Falke, Ribeiro, Utama, Dagan and Gurevych2019). Their research focused on using textual entailment to identify factual inaccuracies in generated summaries. They attempted to reduce factual errors by considering the re-ranking of alternative summaries using models trained on Natural Language Inference (NLI) datasets. However, their findings demonstrated that standard NLI models struggled to assess factual correctness. In a similar vein, Kryściński et al. (Reference Kryściński, McCann, Xiong and Socher2020) developed a model-based approach for evaluating factual consistency in generated summaries at the document-sentence level. Meanwhile, Zhao, Cohen, and Webber (Reference Zhao, Cohen and Webber2020) addressed the problem of unsupported information in generated summaries known as “factual hallucination.” To assess faithfulness, Durmuş, He and Diab (Reference Durmuş, He and Diab2020) and Wang, Cho, and Lewis (Reference Wang, Cho and Lewis2020) proposed question-answering-based frameworks.
Another relevant line of research emerged, focusing on using deep embeddings to compare generated and ground-truth texts, first in the context of machine translation. For instance, YiSi (Lo Reference Lo2019) used an embedding model or cross-lingual embedding model to evaluate lexical semantic similarity using cosine embeddings. Zhang et al. (Reference Zhang, Zhao, Saleh and Liu2020b) presented BERTScore, a metric calculating the similarity between generated and reference translations. This similarity is assessed using the power of BERT by summing cosine similarities between token embeddings. Several works proposed neural evaluation metrics by leveraging pre-trained language models (e.g. MoverScore Zhao et al. Reference Zhao, Peyrard, Liu, Gao, Meyer and Eger2019, BLEURT Sellam, Das, and Parikh Reference Sellam, Das and Parikh2020, COMET Rei et al. Reference Rei, Stewart, Farinha and Lavie2020, Prism Thompson and Post Reference Thompson and Post2020, and BARTScore Yuan, Neubig, and Liu Reference Yuan, Neubig and Liu2021). In a more recent work, Zhao, Strube, and Eger (Reference Zhao, Strube and Eger2023) introduced DiscoScore that uses BERT to model discourse coherence from different perspectives. Meanwhile, Eddine, Shang, and Vazirgiannis (Reference Eddine, Shang and Vazirgiannis2023) presented DATScore as an extension of BARTScore (Yuan et al. Reference Yuan, Neubig and Liu2021) and data augmentation techniques.
In this study, we propose to use a BERT model with a cross-encoder or bi-encoder architecture to measure the similarity between two summaries, by training it on a translated sentence similarity dataset.
3. Methodology
We present our methodology by first describing semantic textual similarity (Section 3.1) and natural language inference (Section 3.2) tasks used in our work and the proposed approaches. We also summarize major datasets in these two areas, along with recent works on translation of these datasets into Turkish. We then describe the proposed evaluation method, which is based on fine-tuning pre-trained language models (cross-encoders and bi-encoders) to learn to predict semantic similarity between two pieces of text (Section 3.3). Finally, we describe our abstractive summarization approach via policy gradient reinforcement learning, using the proposed semantic similarity measure as a reward (Section 3.4).
It is important to highlight that our selection of models and datasets is rooted in established benchmarks for the English language. Furthermore, drawing inspiration from the pioneering work of Reimers and Gurevych (Reference Reimers and Gurevych2019), we opt for models—BERTurk, mBERT, and XLM-R—that reflect a range of language-specific and cross-lingual capabilities.
3.1. Semantic textual similarity
Semantic textual similarity aims to determine how semantically similar two pieces of text are. It has many applications in areas such as machine translation, summarization, text generation, question answering, dialog, and speech systems and has become a popular topic with the competitions organized by SemEval since 2012.
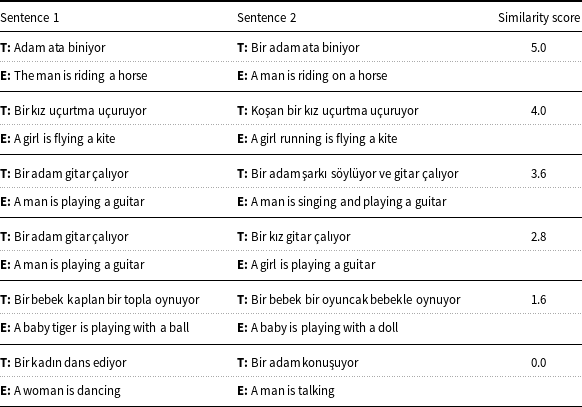
In a recent study, we translated the English Semantic Textual Similarity benchmark dataset (STSb) (Cer et al. Reference Cer, Diab, Agirre, Lopez-Gazpio and Specia2017) into Turkish using the Google Cloud Translation API (Google Cloud 2021). The translations in the new dataset, called STSb-TR, were found to be of high quality (Beken Fikri et al. Reference Beken Fikri, Oflazer and Yanıkoğlu2021). The STSb dataset consists of a selection of the English datasets used in SemEval STS studies between 2012 and 2017. There are 8628 sentence pairs in total (5749 train, 1500 dev, 1379 test). Scores range from 0 (no semantic similarity) to 5 (semantically equivalent) on a continuous scale. Table 1 shows some examples from the STSb dataset and their translations.
Sample translations from the Semantic Textual Similarity benchmark dataset along with the corresponding English sentences. The similarity score between two Turkish sentences are set to the similarity between the corresponding English sentences (Beken Fikri et al. Reference Beken Fikri, Oflazer and Yanıkoğlu2021) (Section 3.1)
In this study, we used the translated dataset to learn the semantic similarity scores of two summaries by fine-tuning state-of-the-art pre-trained language models.
3.2. Natural language inference
Natural language inference is the study of determining whether there is an entailment, contradiction, or neutral relationship between the given premise and the hypothesis sentences. There are two major datasets in literature for natural language inference in English: the Stanford Natural Language Inference (SNLI) (Bowman et al. Reference Bowman, Angeli, Potts and Manning2015) and the MultiGenre Natural Language Inference (MultiNLI) (Williams, Nangia, and Bowman Reference Williams, Nangia and Bowman2018). The SNLI dataset has around 570k sentence pairs while the MultiNLI dataset contains around 433k sentence pairs. The MultiNLI dataset is similar to SNLI in format, but it contains a wider range of text genres.
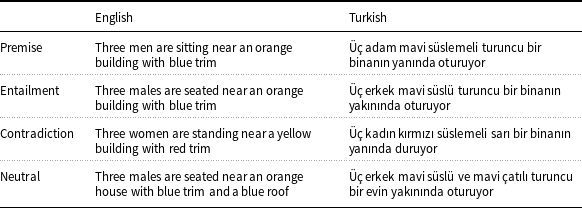
Recently, SNLI and MultiNLI datasets have been translated into Turkish, called NLI-TR (Budur et al. Reference Budur, Özçelik, Güngör and Potts2020). Examples shown in Table 2 illustrate the relationships that are represented in the datasets, by presenting Turkish sentence pairs with their matching original English sentences.
Example sentences illustrating the Natural Language Inference task (Budur et al. Reference Budur, Özçelik, Güngör and Potts2020) (Section 3.2)
Natural language inference is a closely related task to measuring semantic textual similarity and has been used as a pre-training step in the English STS studies, for example Reimers and Gurevych (2019, 2020). The NLI-TR dataset, which is specifically designed for Natural Language Inference tasks in Turkish, serves as a valuable resource for pre-training our models. By leveraging this dataset, we enhance the ability of our models to capture contextual and semantic information unique to the Turkish language. This pre-training step, combined with fine-tuning the STSb-TR dataset, results in improved similarity models that offer a more accurate representation of text summarization evaluation.
3.3. Predicting text similarity using fine-tuned large language models
We fine-tune pre-trained large language models, namely BERTurk, mBERT, and XLM-R, to predict the semantic similarity between two pieces of text. The trainings are done over two related tasks, using the relevant datasets translated from English: (1) The STSb-TR dataset, which is the translated version of the English STSb dataset (Beken Fikri et al. Reference Beken Fikri, Oflazer and Yanıkoğlu2021). (2) The NLI-TR dataset, which consists of translated versions of the SNLI and MultiNLI datasets, facilitates research on natural language inference in Turkish across various text genres (Budur et al. Reference Budur, Özçelik, Güngör and Potts2020). The models are either only fine-tuned on the STSb-TR dataset or were first fine-tuned on the NLI-TR dataset and then on STSb-TR dataset.
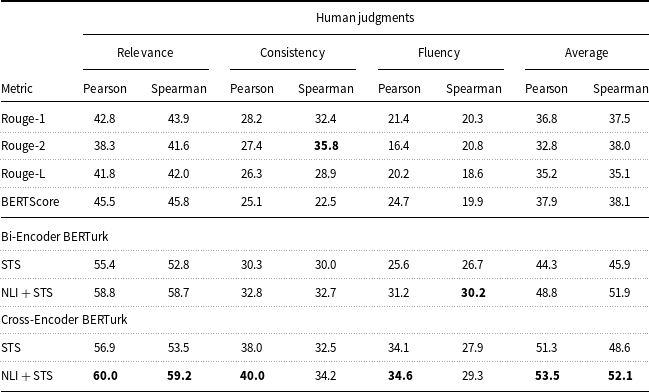
The two main architectures that are fine-tuned to predict sentence pair scoring tasks are cross-encoders and bi-encoders, illustrated in Fig. 1. In the cross-encoder approach, two sentences are passed simultaneously to the transformer network, which directly computes their semantic similarity score between 0 and 1. We used the cross-encoder architecture described by Reimers and Gurevych (Reference Reimers and Gurevych2019), which is trained with the binary cross-entropy loss:
 \begin{equation} BCE ={(y\log (\hat{y}) + (1 - y)\log (1 - \hat{y}))} \end{equation}
where $y$
is the ground-truth label and
$y$
is the ground-truth label and $\hat{y}$
is the predicted label (Table 3).
$\hat{y}$
is the predicted label (Table 3).
Cross-encoder and bi-encoder model architectures (Reimers and Gurevych Reference Reimers and Gurevych2019).
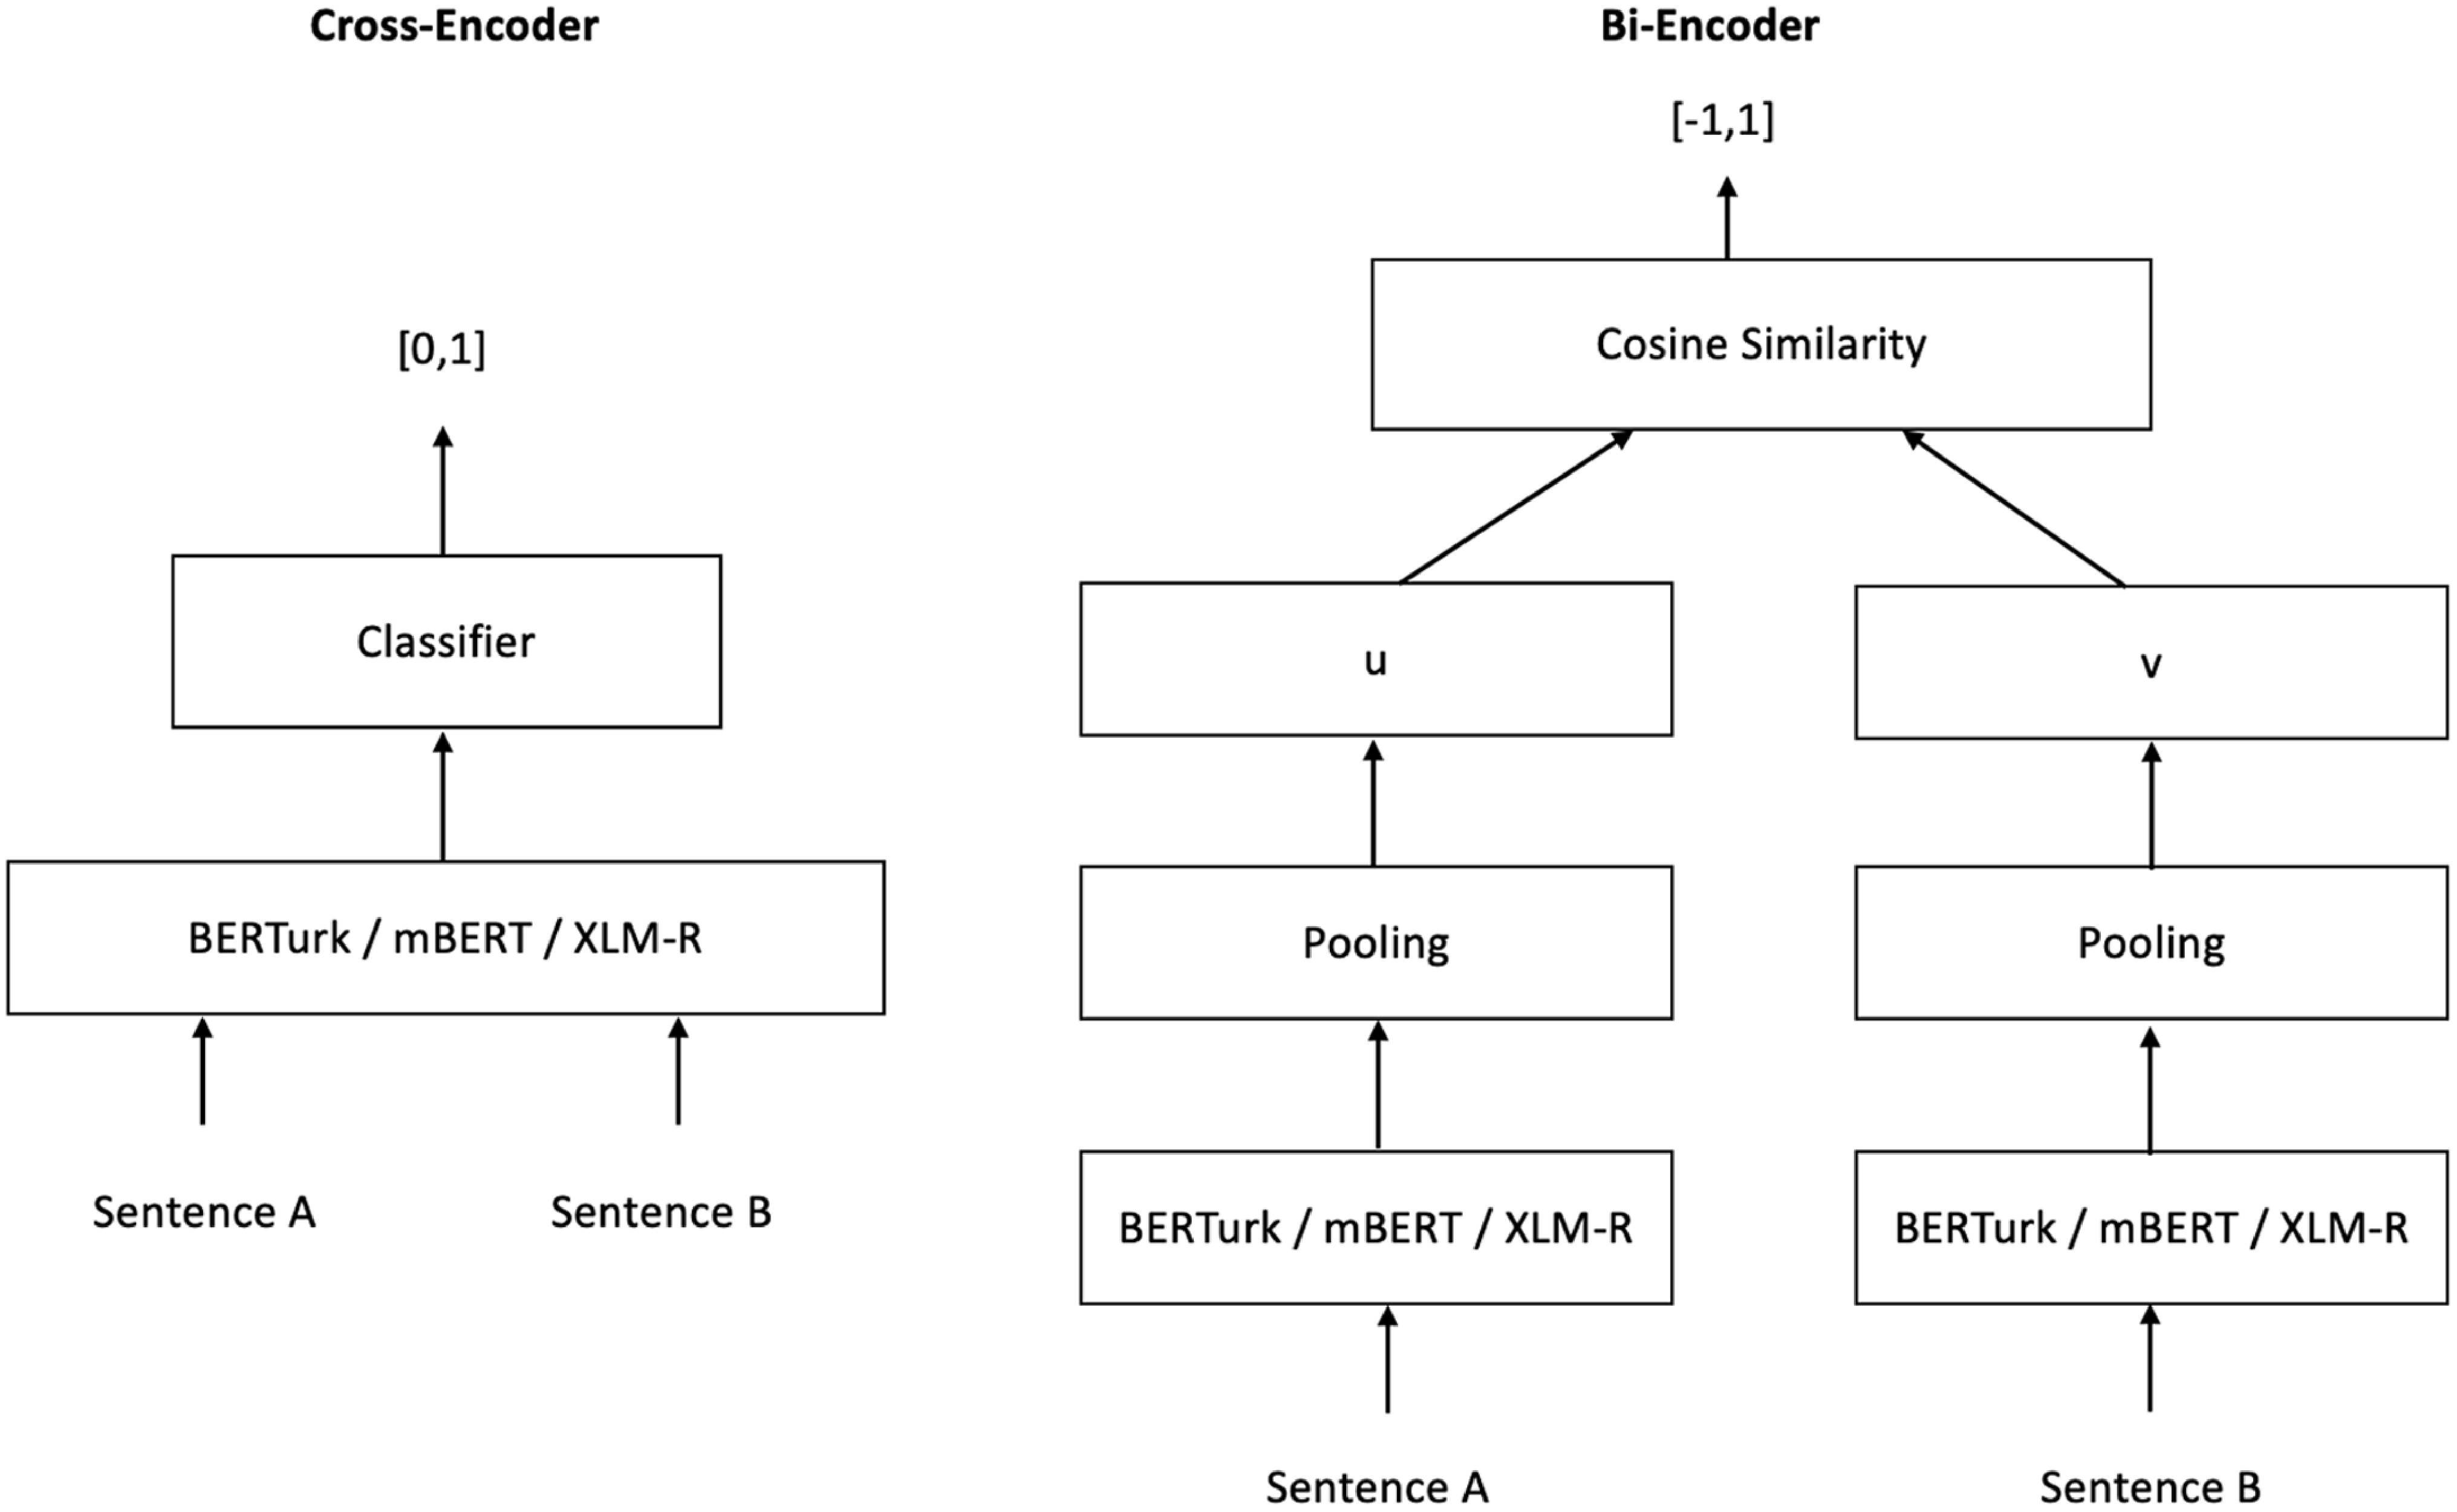
The bi-encoder BERT, also called Sentence-BERT, is proposed by Reimers and Gurevych (Reference Reimers and Gurevych2019). It is a modification of the pre-trained BERT network that enables to derivation of semantically meaningful fixed-size sentence embeddings. The training loss varies depending on the dataset used to train the model: the classification objective was employed during training on the NLI dataset, while the regression objective was used during the training on the STSb dataset (Reimers and Gurevych Reference Reimers and Gurevych2019).
In the regression objective, the cosine similarity between two sentence embeddings is employed with the mean square error loss:
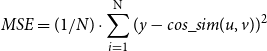 \begin{equation} MSE = (1/N) \cdot \sum ^{\textrm{N}}_{i=1}(y - cos\_sim(u,v))^2 \end{equation}
where $y$
is the ground-truth label and
$y$
is the ground-truth label and $cos\_sim(u,v)$
is the predicted label that represents the cosine similarity of sentence embeddings
$cos\_sim(u,v)$
is the predicted label that represents the cosine similarity of sentence embeddings $u$
and
$u$
and $v$
.
$v$
.
In the classification objective, the model optimizes the cross-entropy loss between the true labels and the predictions obtained with softmax, where the logits $z$
for the
$z$
for the $n$
-dimensional sentence embeddings
$n$
-dimensional sentence embeddings $u$
and
$u$
and $v$
of the input texts are concatenated with element-wise difference and multiplied by a trainable weight
$v$
of the input texts are concatenated with element-wise difference and multiplied by a trainable weight $W_t \in \mathbb{R}^{k \times 3n}$
:
$W_t \in \mathbb{R}^{k \times 3n}$
:
 \begin{equation} \begin{aligned} &z = W_t\times [u,v,|u-v|] \\ &CE = - \sum ^{\textrm{k}}_{l=1}({y} \cdot \log{(\text{softmax}(z))}) \end{aligned} \end{equation}
The fine-tuned models, in two alternative architectures (cross-encoder and bi-encoder), are then evaluated for how well they perform in semantic similarity predictions, in the context of abstractive summarization (see Table 4).
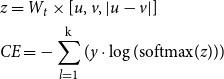
Correlations between the semantic textual similarities predicted by the fine-tuned models in varying architecture and train sets, and the corresponding ground-truth similarity scores in the Semantic Textual Similarity benchmark test set. Pearson and Spearman correlations are reported as $\rho \times 100$
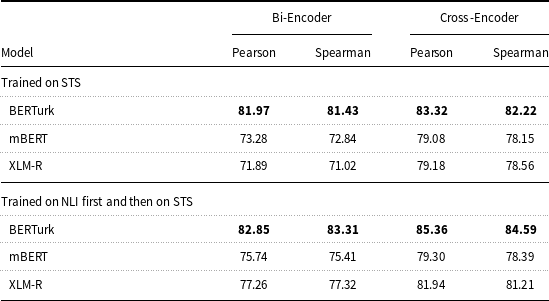
Correlations between ROUGE, BERTScore, and proposed evaluation methods and the human judgments (Section 4.1.3). Pearson and Spearman correlations are reported as $\rho \times 100$
3.4. Policy gradient reinforcement with similarity rewards
As the second major contribution of this work, we have trained an abstractive summarization model using the reinforcement learning framework, where the proposed similarity metric is used as the reward signal. In this model, we fine-tuned the mT5 model, which is a multilingual variant of the text-to-text-transfer-transformer (T5) (Raffel et al. Reference Raffel, Shazeer, Roberts, Lee, Narang, Matena, Zhou, Li and Liu2020), that was pre-trained for 101 languages, including Turkish, using a new Common Crawl-based dataset (Xue et al. Reference Xue, Constant, Roberts, Kale, Al-Rfou, Siddhant, Barua and Raffel2021). The mT5 model decoder acts as an agent that interacts with the environment to take actions (predicting the next word in the sequence) based on the learned policy and observes as reward the semantic similarity of the generated and ground-truth summary.
The model is trained with the self-critical policy gradient training algorithm (Rennie et al. Reference Rennie, Marcheret, Mroueh, Ross and Goel2017) that was proposed for image captioning. This algorithm enhances the REINFORCE algorithm (Williams Reference Williams1992), by introducing a learned baseline to enhance training stability. The baseline approximates the expected reward generated by the model itself. This approach enables models to improve their policies by comparing their performance to their self-generated sequences, addressing exposure bias issues, and enhancing overall training efficiency. Paulus et al. (Reference Paulus, Xiong and Socher2018) used the self-critical policy gradient training algorithm for abstractive summarization.
In this study, following a similar approach to Paulus et al. (Reference Paulus, Xiong and Socher2018), we generate two separate summary sequences at each training step: a sampled sequence and a baseline sequence. The sampled sequence $y^{s}$
is obtained by sampling the words
$y^{s}$
is obtained by sampling the words $y_{t}^{s}$
from the probability distribution
$y_{t}^{s}$
from the probability distribution $p(y_{t}^s|y_{1}^s,\ldots,y_{t-1}^s,X)$
. The baseline sequence
$p(y_{t}^s|y_{1}^s,\ldots,y_{t-1}^s,X)$
. The baseline sequence $y^{b}$
is obtained by greedy decoding, that is by selecting the word with the highest posterior probability at each time step. We use the proposed semantic similarity (
$y^{b}$
is obtained by greedy decoding, that is by selecting the word with the highest posterior probability at each time step. We use the proposed semantic similarity ( $SemSim(y^*,\hat{y})$
) between a generated sequence
$SemSim(y^*,\hat{y})$
) between a generated sequence $\hat{y}$
and the ground-truth
$\hat{y}$
and the ground-truth $y^*$
as our reward function. Since the generated sequences have varying lengths, we normalize the log probabilities by dividing them with the sequence lengths. So,
$y^*$
as our reward function. Since the generated sequences have varying lengths, we normalize the log probabilities by dividing them with the sequence lengths. So, $L_{rl}$
is defined as follows:
$L_{rl}$
is defined as follows:
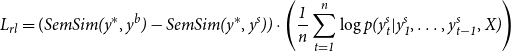 \begin{equation} L_{rl} = (\it{SemSim}(y^*,y^{b}) - \it{SemSim}(y^*,y^{s})) \cdot \left(\frac{1}{n} \sum _{t=1}^{n} \log p(y_{t}^s|y_{1}^s,\ldots,y_{t-1}^s,X)\right) \end{equation}
In Equation (5), minimizing $L_{rl}$
is equivalent to maximizing the conditional likelihood of the sampled sequence
$L_{rl}$
is equivalent to maximizing the conditional likelihood of the sampled sequence $y^{s}$
when it receives a higher reward than the baseline sequence
$y^{s}$
when it receives a higher reward than the baseline sequence $y^{b}$
. This optimization process encourages the model to generate sequences that are more likely to receive higher rewards compared to a baseline sequence.
$y^{b}$
. This optimization process encourages the model to generate sequences that are more likely to receive higher rewards compared to a baseline sequence.
Self-critical policy gradient training process with bi-encoder/cross-encoder similarity rewards.
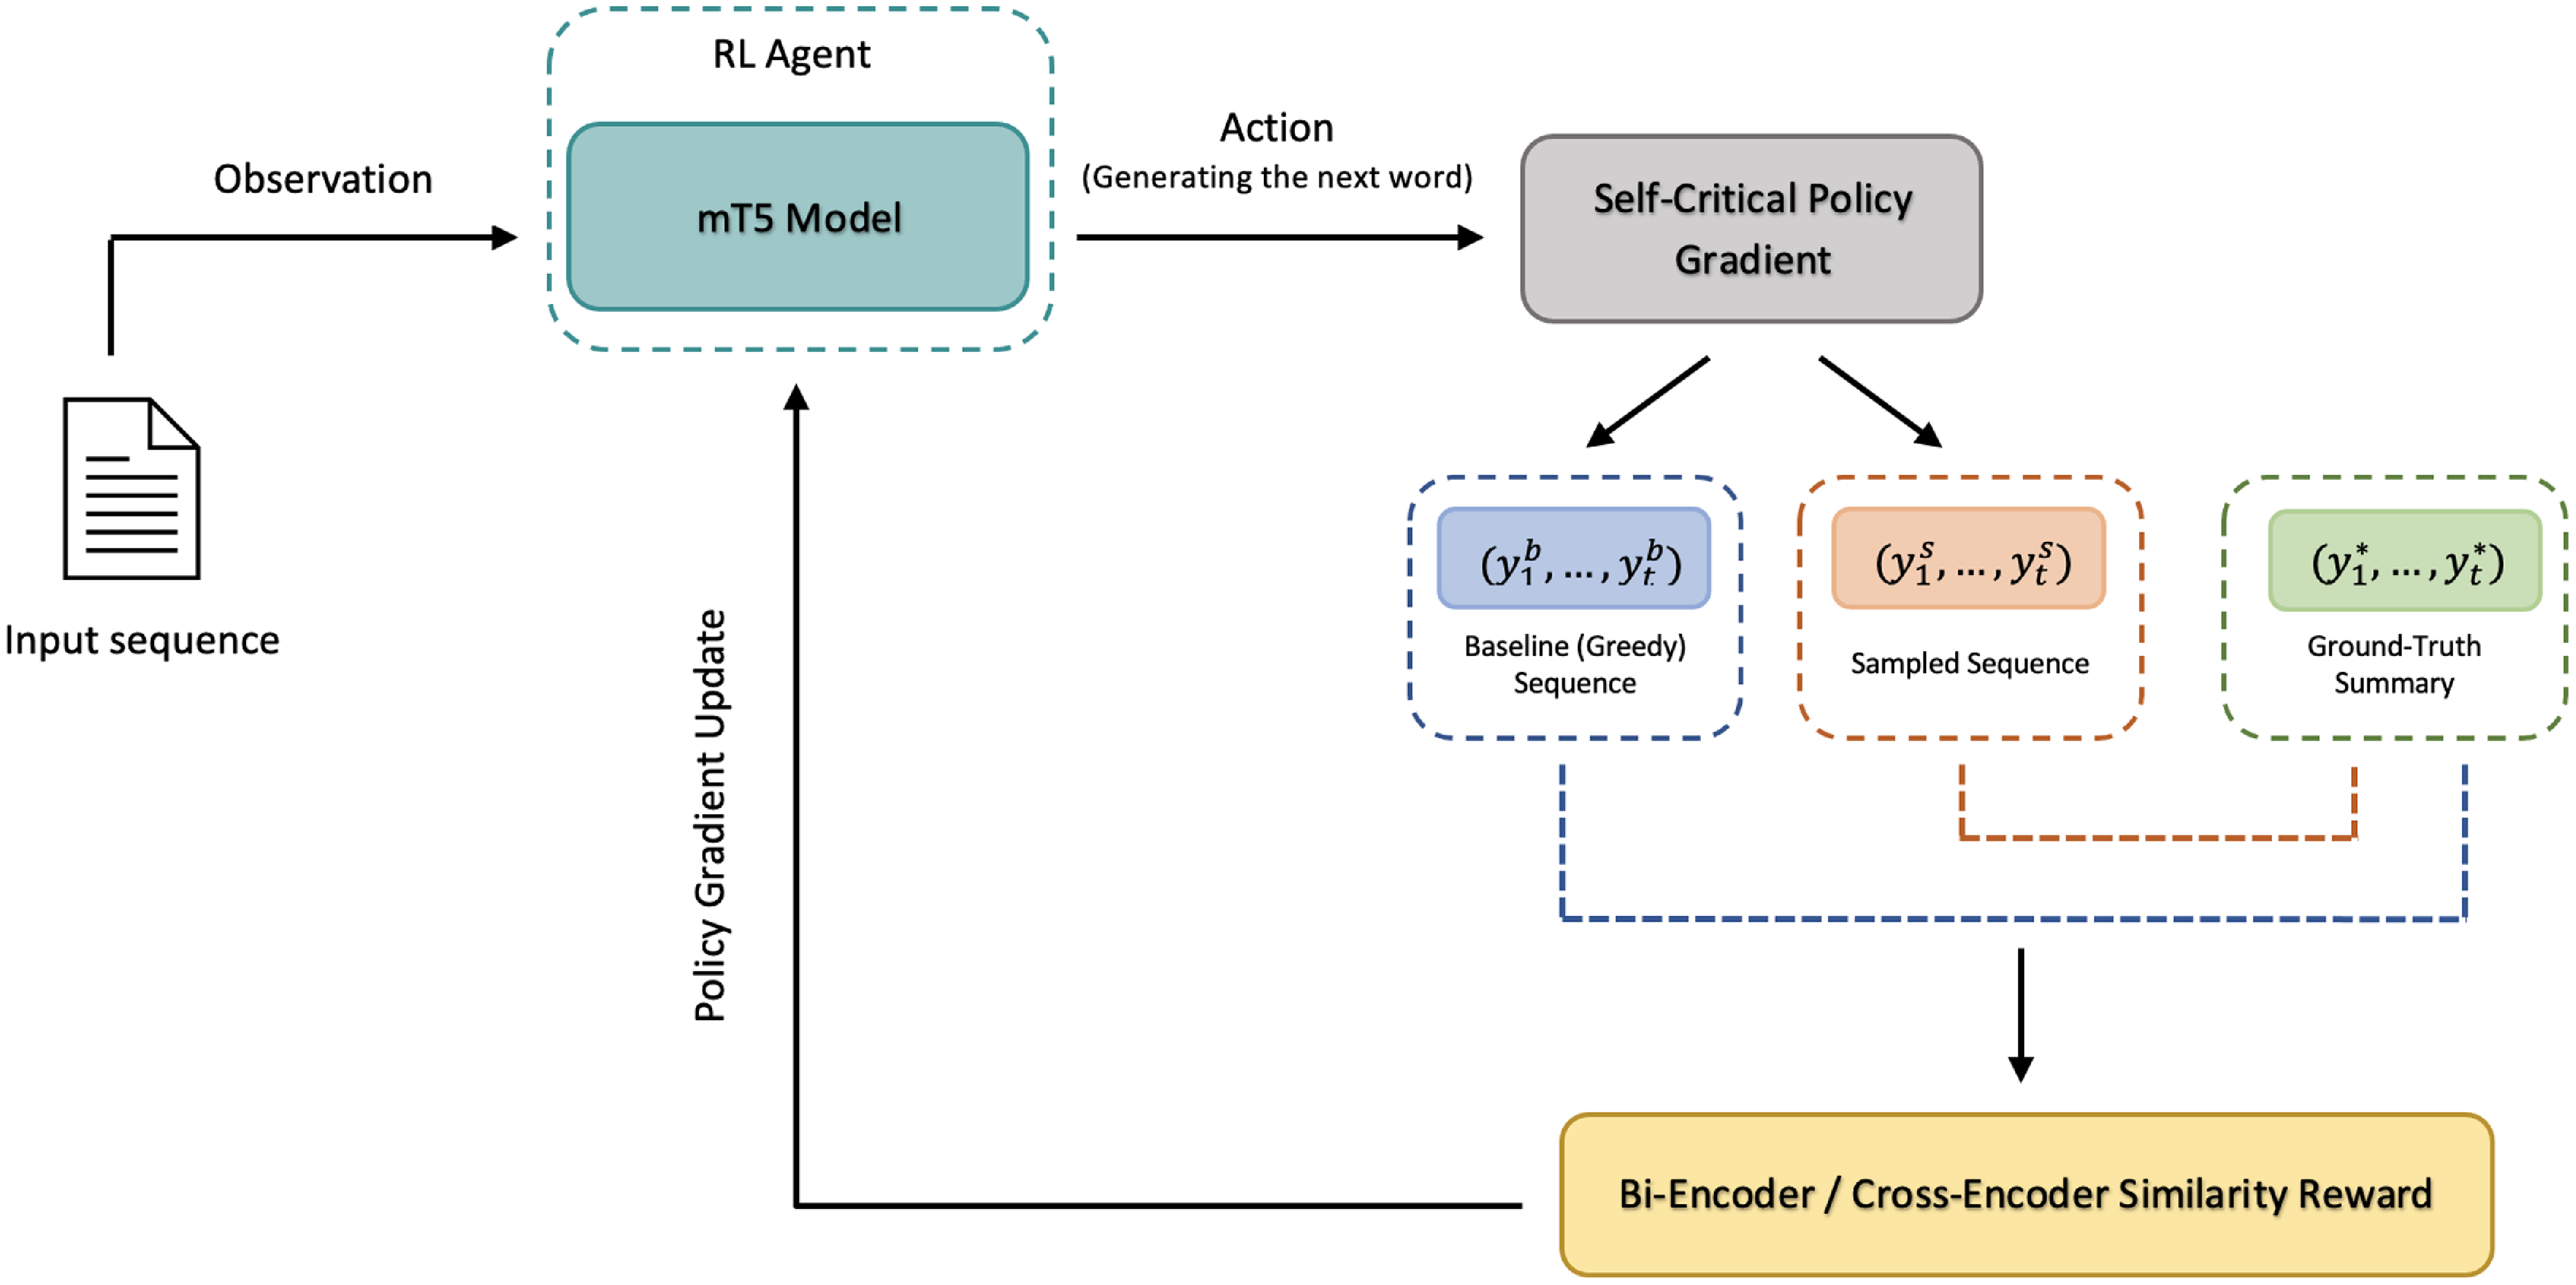
The reinforcement learning process, using the bi-encoder and cross-encoder similarity rewards, is visualized in Fig. 2. The training is actually done in two stages: It starts with minimizing only the maximum-likelihood loss given in Equation (1). The second stage of the training consists of fine-tuning with a mixed training objective, which is a combination of maximum-likelihood training objective and the reinforcement training objective, as described in (Paulus et al. Reference Paulus, Xiong and Socher2018):
 \begin{equation} {L_{mixed} = \gamma L_{rl} + (1-\gamma )L_{ml}} \end{equation}
where $L_{rl}$
is the reinforcement learning loss defined in Equation (5),
$L_{rl}$
is the reinforcement learning loss defined in Equation (5), $L_{ml}$
is the maximum-likelihood loss defined in Equation (1), and
$L_{ml}$
is the maximum-likelihood loss defined in Equation (1), and $\gamma$
is a scaling factor. Training only with
$\gamma$
is a scaling factor. Training only with $L_{rl}$
to optimize a specific metric may not guarantee the quality and readability of the generated sequence; hence, we have used a mixed training objective to optimize a specific measure with reinforcement training objective
$L_{rl}$
to optimize a specific metric may not guarantee the quality and readability of the generated sequence; hence, we have used a mixed training objective to optimize a specific measure with reinforcement training objective $L_{rl}$
as well as to increase quality and readability of the output with maximum-likelihood training objective
$L_{rl}$
as well as to increase quality and readability of the output with maximum-likelihood training objective $L_{ml}$
.
$L_{ml}$
.
4. Experiments and quantitative results
We evaluate the effectiveness of the proposed similarity measures and abstractive summarization model, along with the pre-trained language models and datasets used in our experimental framework.
4.1. Evaluation of fine-tuned models for predicting semantic similarity
As explained in Section 3.3, we fine-tune different pre-trained language models for predicting the semantic similarity between two summaries. Here we describe the pre-trained models (Section 4.1.1) used in our evaluations, along with the results of two evaluations. In the first one, we evaluate the fine-tuned models in terms of the correlations of their predicted similarity scores and semantic similarities obtained in STSb-TR dataset (Section 4.1.2). In the second evaluation, we present comparison of human evaluations with the proposed and alternative evaluation measures (Section 4.1.3). Details of the Turkish summarization dataset are given in Section 4.2.1.
4.1.1. Pre-trained language models
We experimented with the pre-trained language models BERTurk, mBERT, and XLM-R for semantic similarity using both bi-encoder and cross-encoder architectures. For summarization, we used the mT5 model (Xue et al. Reference Xue, Constant, Roberts, Kale, Al-Rfou, Siddhant, Barua and Raffel2021).
BERTurk and mBERT. BERT is a deep learning model based on pre-training bidirectional representations from unlabeled text using a masked language model pre-training objective. In contrast to unidirectional language models for pre-training, masked language model pre-training objective allows the representation to combine the left and right contexts (Devlin et al. Reference Devlin, Chang, Lee and Toutanova2019). In this study, we used BERTurk (Hugging Face 2021b), which is a BERT model for Turkish (Schweter Reference Schweter2020), and mBERT (Hugging Face 2021a) is a multilingual BERT pre-trained on the top 104 languages with the largest Wikipedia corpus (Pires, Schlinger, and Garrette Reference Pires, Schlinger and Garrette2019).
XLM-R. XLM-RoBERTa model (Hugging Face 2021c) has been pre-trained on a large filtered CommonCrawl data containing 100 languages using a multilingual masked language modeling goal (Conneau et al. Reference Conneau, Khandelwal, Goyal, Chaudhary, Wenzek, Guzmán, Grave, Ott, Zettlemoyer and Stoyanov2020). In this study, we used the model to compute sentence embeddings similar to BERT models. We also integrated it into the siamese network used in Sentence-BERT.
mT5. mT5 (Xue et al. Reference Xue, Constant, Roberts, Kale, Al-Rfou, Siddhant, Barua and Raffel2021) is a variant of the text-to-text-transfer-transformer (T5) model (Raffel et al. Reference Raffel, Shazeer, Roberts, Lee, Narang, Matena, Zhou, Li and Liu2020) that was pre-trained for 101 languages on a new Common Crawl-based dataset. It has the same model architecture as T5 and its pre-training objective includes T5’s self-supervised training, but not T5’s supervised training. So, it has to be fine-tuned before applying to any downstream task like text summarization.
4.1.2. Evaluation of fine-tuned models for semantic similarity
Following the work of Reimers and Gurevych (Reference Reimers and Gurevych2019), we fine-tuned our models on the NLI-TR dataset with a 3-way softmax-classifier for one epoch with the bi-encoder, and four epochs with the cross encoder. We used a batch size of 16, an Adam optimizer with learning rate of 2e-5, and a linear learning rate warm-up over 10% of the training data. In our bi-encoder training settings, we used the default mean pooling. Then, we fine-tuned each model on the STSb-TR dataset with 4 epochs and 10 random seeds as suggested by Reimers and Gurevych (Reference Reimers and Gurevych2018, Reference Reimers and Gurevych2019). Only the XLM-R bi-encoder model was trained with 20 random seeds on STSb-TR to have at least 5 successful models.
The fine-tuned models are evaluated by calculating the Pearson and Spearman correlations between their predicted similarity scores and the gold similarity scores that are published in the original English STSb dataset (Cer et al. Reference Cer, Diab, Agirre, Lopez-Gazpio and Specia2017). The results, presented in Table 3, show that the similarity scores predicted by our models are highly correlated with the ground truth, with the highest correlation being achieved by the BERTurk model trained with both datasets and a cross-encoder architecture (4th row of results). This shows that the proposed similarity measure, especially the BERTurk cross-encoder model, is a good option for measuring sentence similarity.
Another observation is that training the models first on the NLI-TR dataset increases the performance of the model in assessing semantic similarities. This is particularly noticeable for the XLM-R models. The BERTurk model gives very good results when trained directly on the STSb-TR dataset, but it shows even higher performance when trained on the NLI-TR dataset first. These results show the benefits of multi-task learning, in line with the literature.
In the rest of the paper, we evaluate the four best-performing models (BERTurk cross-encoder and bi-encoder models trained on STS or NLI + STS) as evaluation measures and use the two best-performing models (BERTurk cross-encoder and bi-encoder models trained on NLI + STS) for training abstractive summarization models.
4.1.3. Comparison of the proposed similarity measures with human evaluations
In addition to evaluating semantic similarities using a sentence similarity dataset (Section 4.1.2), we also evaluate their performance in evaluating generated summaries. For this, we compare the correlations of the predicted similarities with human evaluations and compare them to the correlations of ROUGE and BERTScore, for comparison.
For this evaluation, we use generated summaries by the pre-trained mT5 model (Gündeş Reference Gündeş2021) for 50 randomly selected articles from the MLSUM Turkish dataset (see Section 4.2.1). The generated summaries were evaluated by native Turkish annotators on a scale of 1 (very bad) to 5 (very good), in terms of relevance (selection of important content from the source), consistency (the factual alignment between the summary and the summarized source), and fluency (the quality of individual sentences) and evaluate each criterion separately.
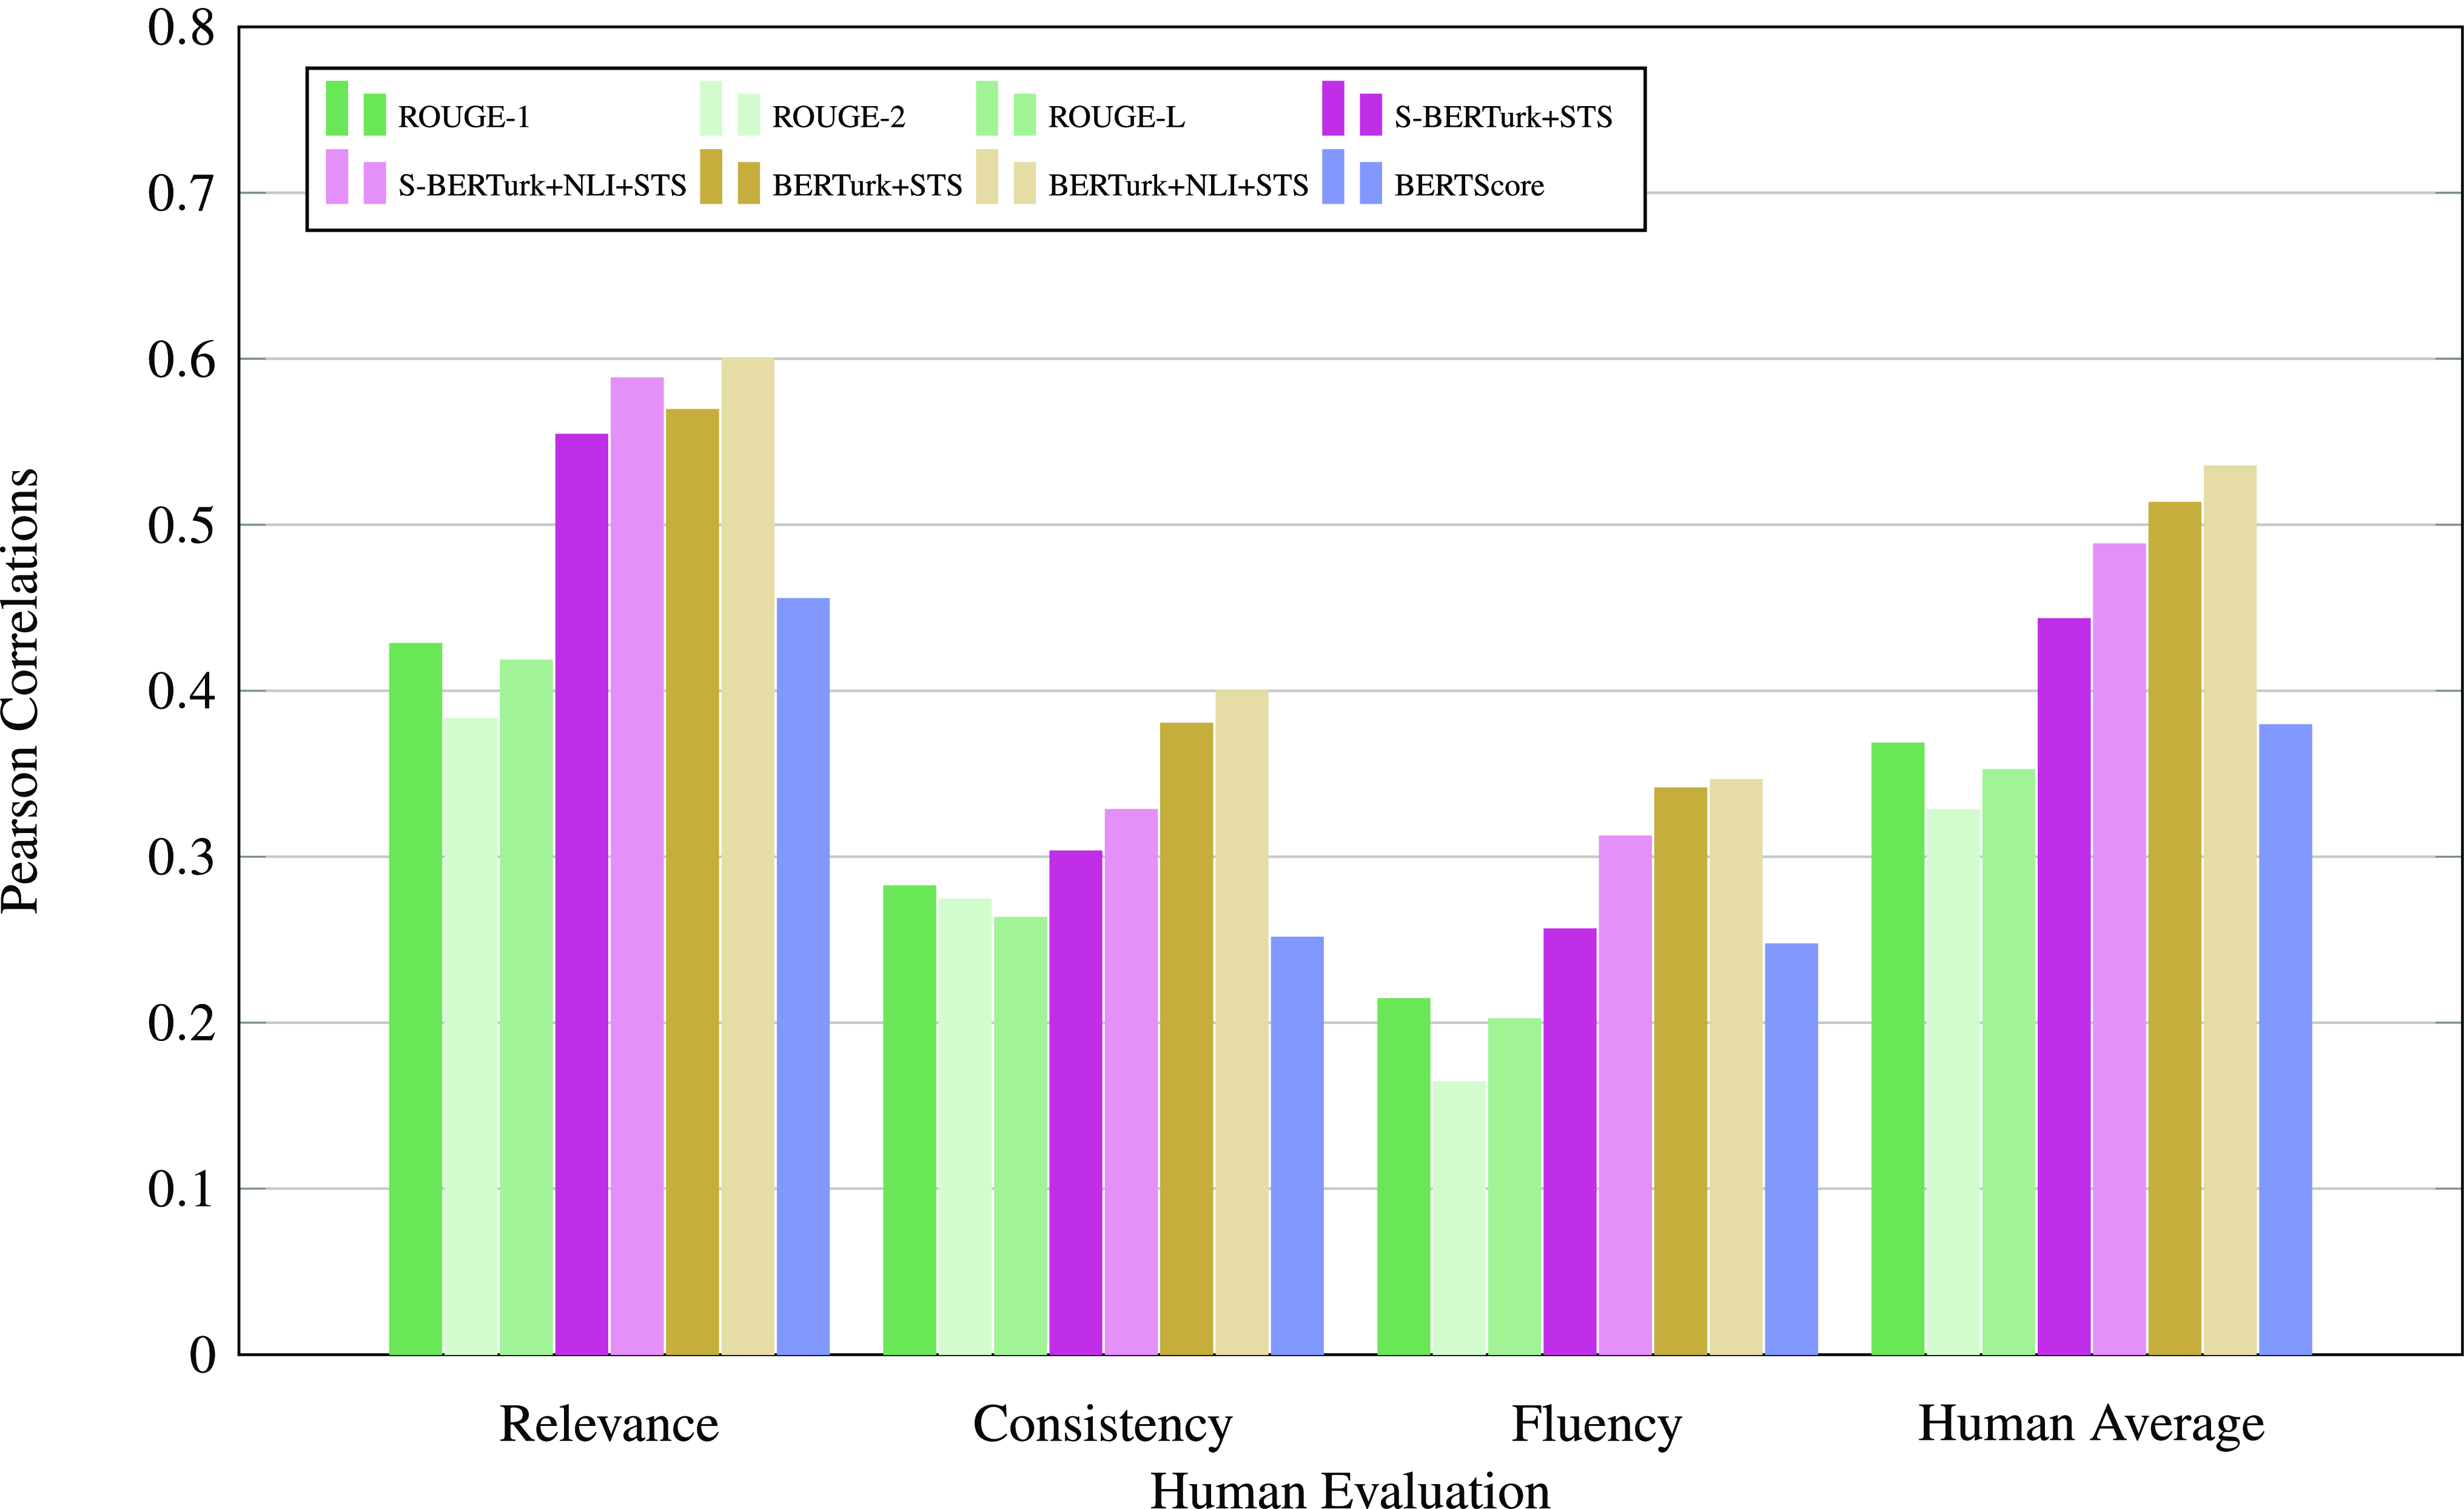
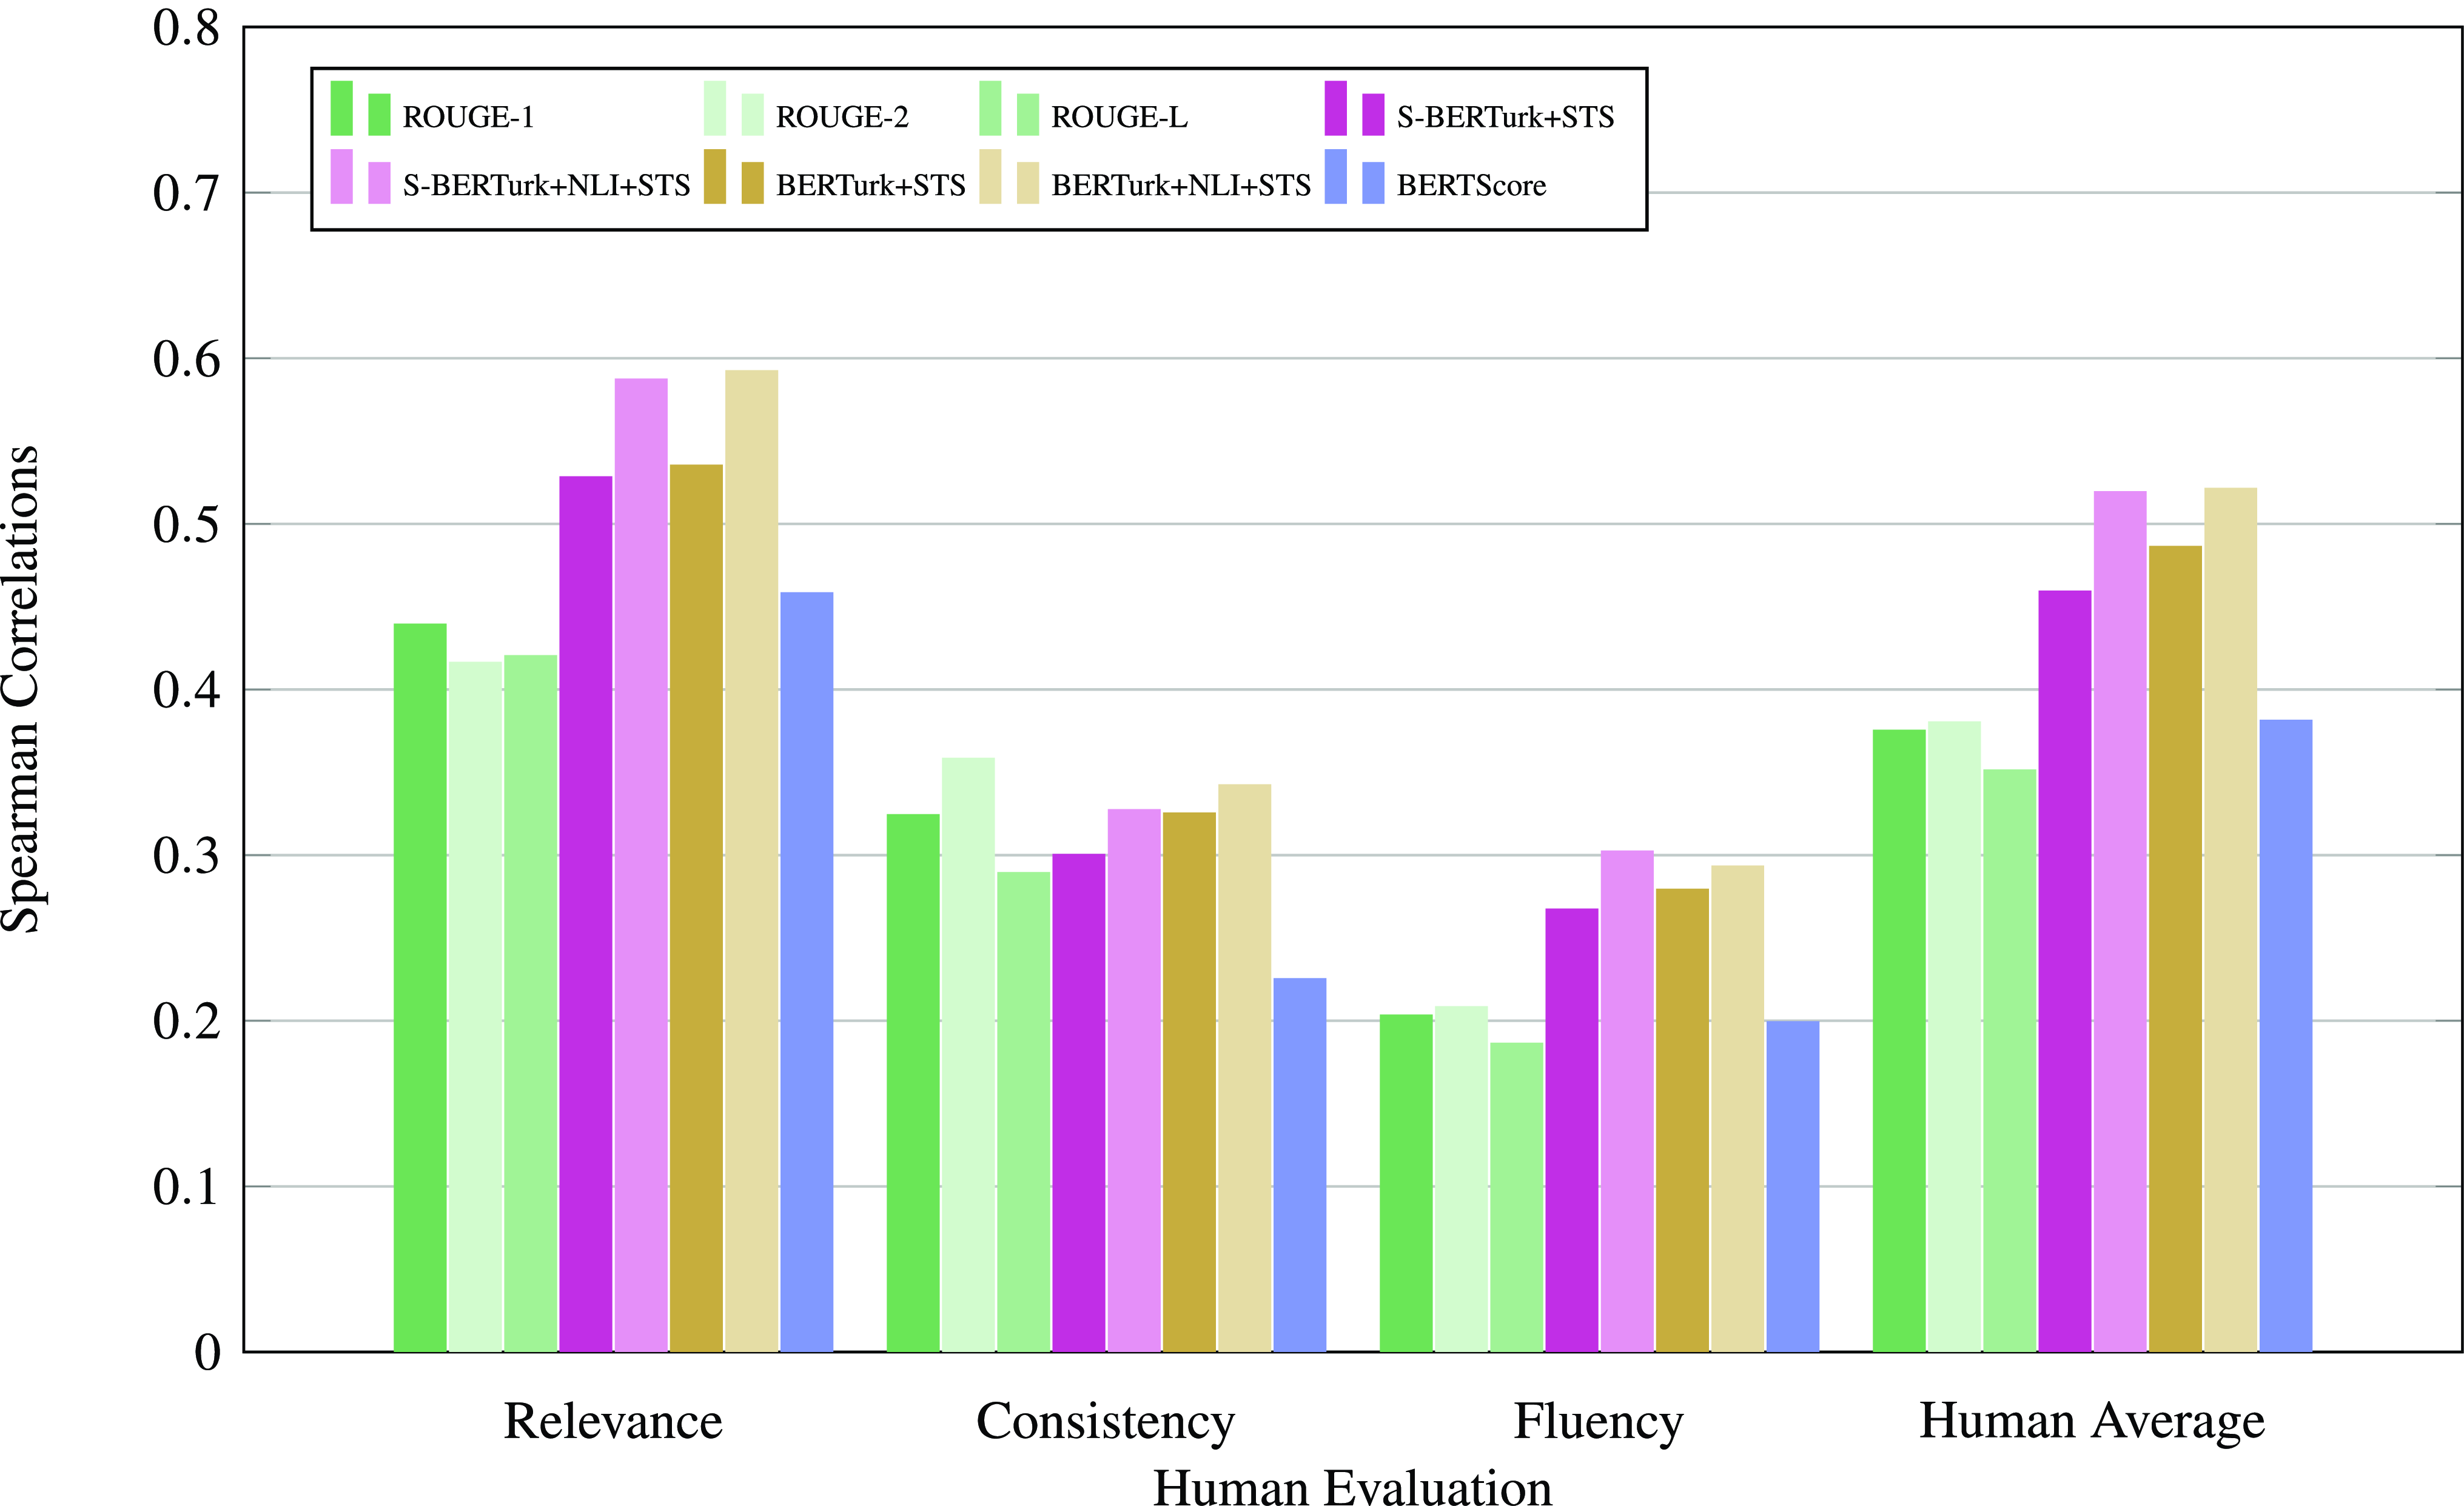
We then compared alternative semantic similarity-based evaluation methods, namely ROUGE scores, BERTscore, and the proposed evaluations, and computed their correlations with human judgments about the quality of the summarization. The results shown in Table 4 show that semantic similarity-based evaluation correlates with human judgments better than ROUGE and BERTScore evaluations. Furthermore, cross-encoder-based similarity measures showed higher correlations with human evaluations compared to bi-encoder-based similarity measures, as also observed in previous work (Beken Fikri et al. Reference Beken Fikri, Oflazer and Yanıkoğlu2021).
All the correlations were significant ( $p\lt .05$
) except for the correlations between Fluency and bi-encoder BERTurk model trained on STS, BERTScore, ROUGE-L as well as correlations between BERTScore and consistency. The Pearson and Spearman correlations are also visualized in Figs. 3 and 4, respectively.
$p\lt .05$
) except for the correlations between Fluency and bi-encoder BERTurk model trained on STS, BERTScore, ROUGE-L as well as correlations between BERTScore and consistency. The Pearson and Spearman correlations are also visualized in Figs. 3 and 4, respectively.
Pearson correlations of the evaluations with human judgments.
Spearman correlations of the evaluations with human judgments.
The details of the summary annotation process are as follows. The annotators’ (3 university students, 1 Ph.D. student, and 1 professor) age ranged between 23 and 66 (avg. 32,8). The participants were paid a small amount for successful completion of the evaluations. They were given one text and the corresponding summary at a time. Three examples were given in the instructions to illustrate how to rate the summaries. Each participant attended only once and there were no time limit in the evaluation process. The analysis of the annotations showed that average relevance was $3.5\pm 0.8$
, average consistency was
$3.5\pm 0.8$
, average consistency was $4.5\pm 0.8$
, and average fluency was
$4.5\pm 0.8$
, and average fluency was $4.3\pm 0.8$
. Inter-annotator agreement in terms of Krippendorff’s alpha scores (Krippendorff Reference Krippendorff2011) for fluency, consistency, and relevance were 0.33, 0.34, and 0.35, respectively, which shows that there is a fair agreement. Each of the three criteria (relevance, fluency, and consistency) has 50 evaluations.
$4.3\pm 0.8$
. Inter-annotator agreement in terms of Krippendorff’s alpha scores (Krippendorff Reference Krippendorff2011) for fluency, consistency, and relevance were 0.33, 0.34, and 0.35, respectively, which shows that there is a fair agreement. Each of the three criteria (relevance, fluency, and consistency) has 50 evaluations.
4.2. Evaluation of the proposed summarization models
In this section, we compare the performance of the summarization models that are fine-tuned using the maximum-likelihood estimation (MLE)-only or the reinforcement learning (RL) paradigm with the proposed similarity measures as the reward signal. The evaluation consists of two parts. In the first part, we give different evaluation results (ROUGE, BERTScore, or proposed) for summaries generated by different models (Section 4.2.3). In the second one, we give human assessment of summary quality (Section 4.2.4).
4.2.1. Summary dataset
We use the MLSUM Turkish dataset for training and testing our summarization models. MLSUM is the first large-scale MultiLingual SUMmarization dataset that contains 1.5M+ article/summary pairs including Turkish (Scialom et al. Reference Scialom, Dray, Lamprier, Piwowarski and Staiano2020). The dataset was created using the same methods as the CNN/DailyMail dataset (Nallapati et al. Reference Nallapati, Zhou, dos Santos, Gülçehre and Xiang2016). They used news articles as the text source and their highlights/descriptions as the summary (Scialom et al. Reference Scialom, Dray, Lamprier, Piwowarski and Staiano2020).
The MLSUM Turkish subset was built by crawling the articles on Turkish website (Internet Haber) between 2010 and 2019. All articles under 50 words and summaries under 10 words were eliminated. The data was split into train, validation, and test sets, with respect to the publishing dates. The data from 2010 to 2018 was used for training, data between January and April 2019 was used for validation, and data up to December 2019 was used for test (Scialom et al. Reference Scialom, Dray, Lamprier, Piwowarski and Staiano2020). There are 249,277 train, 11,565 validation, and 12,775 test samples in the dataset.
4.2.2. Summarization models
In our summarization models, we used mT5 (Xue et al. Reference Xue, Constant, Roberts, Kale, Al-Rfou, Siddhant, Barua and Raffel2021), which is a variant of T5 model (Raffel et al. Reference Raffel, Shazeer, Roberts, Lee, Narang, Matena, Zhou, Li and Liu2020). This model was then fine-tuned on MLSUM Turkish dataset for abstractive summarization.
The details of the training process are as follows. We started fine-tuning the mT5, by minimizing the maximum-likelihood loss for 15 epochs, using a batch size of 8, accumulation steps of 4, and learning rate of 10e-5 with Adafactor optimization and cosine annealing learning rate decay schedule (Loshchilov and Hutter Reference Loshchilov and Hutter2016). The maximum news length was set to 512 and maximum summary length was determined as 120. We initialized our reinforcement learning models with the fine-tuned models that best performed on the validation set in terms of bi-encoder and cross-encoder similarity scores (Beken Fikri Reference Beken Fikri2023). We continued training one more epoch with the mixed objective learning function (Equation (6)) for cross-encoder and bi-encoder similarity rewards separately. The scaling factor $\gamma$
was set to 0.95. We also continued training each initial model one more epoch with only maximum-likelihood loss, to obtain comparable results. Further training was not possible due to time and computational resources.
$\gamma$
was set to 0.95. We also continued training each initial model one more epoch with only maximum-likelihood loss, to obtain comparable results. Further training was not possible due to time and computational resources.
In the continued MLE-only and reinforcement learning models, maximum news length and maximum summary length were set to 256 and 60, respectively, and batch size was 4 due to memory constraints. It should be noted that the same maximum summary length is used for target summaries in both training and testing. We utilized the scripts provided by Yadav et al. (Reference Yadav, Gupta, Abacha and Demner-Fushman2021) and adapted them for our work.
4.2.3. Evaluation of summarization models with different metrics
We evaluated the summaries generated by the fine-tuned mT5 models (Section 4.2.2) for input articles from the MLSUM Turkish test set. Specifically, we compare the semantic similarity, ROUGE, and BERTScore evaluation results for summarization models trained with MLE and MLE + RL with bi-encoder and cross-encoder semantic similarity rewards, as well as ROUGE-L rewards. The results shown in Table 5 indicate the average performance of the mT5 summarization models on the MLSUM test set. The given results vary significantly across the different metrics. This is expected, since each metric measures different aspects of the similarity between the ground-truth summary and the generated summary. The lowest scores are obtained with ROUGE, while the highest scores are obtained with BERTScore. However, the scores are not directly comparable among themselves and a high BERTScore does not necessarily imply that the generated summaries are of higher quality. One limitation of BERTScore is that it primarily focuses on token-level similarity, which may result in overestimated scores.
Results of the mT5 summarization models trained on MLSUM dataset. We reported the average results for MLE-only (that best performed on validation set in terms of bi-encoder and cross-encoder similarity results) and RL training objectives on the MLSUM test set (Section 4.2). All values are scaled to 100
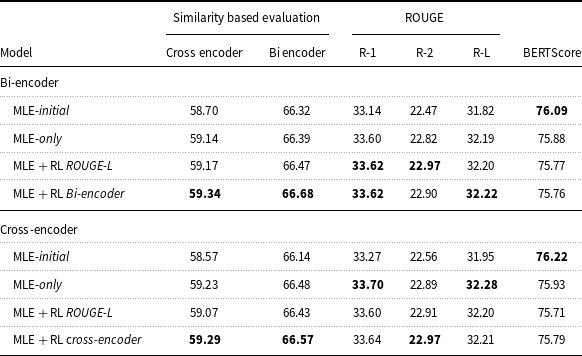
For the case of the proposed evaluation models (similarity-based evaluation), we see that training the summarization model with the RL paradigm gives the best results for both the bi-encoder or cross-encoder models (rows 4 and 8 of the results), compared to MLE-only or RL with ROUGE-L score as the reward metric. This is not the case for ROUGE or BERTScore. We thus see that improving the evaluation measure yields an improvement in overall quality of the summaries, as we already showed that the bi-encoder and cross-encoder similarity scores are better aligned with human judgments (Section 4.1.3).
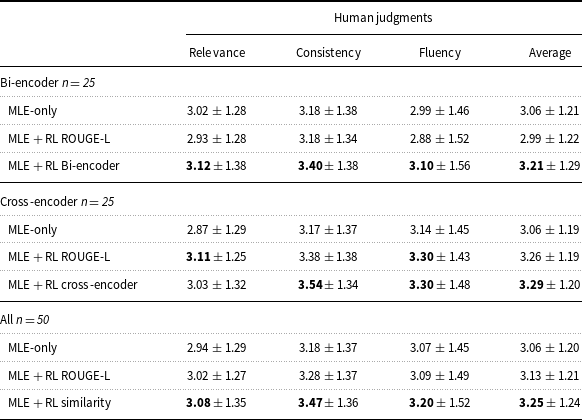
4.2.4. Human evaluations for the summarization models
In addition to the quantitative analysis of the summarization models using well-known ROUGE, BERTScore, and our proposed measures, we analyzed the effectiveness of our proposed framework qualitatively as well. For this, we collected human evaluations of generated summaries in three dimensions to better assess the model outcomes. To collect human evaluations, we first identified the list of generated summaries, which were different in all fine-tuned models and from the actual summaries. Then, we randomly sampled 25 documents for bi-encoder models and 25 documents for cross-encoder models (50 documents in total) as human evaluation sets.
In the evaluation process, the participants were given the news article and three generated summaries from the MLE-only, MLE + RL model with ROUGE-L reward and the bi-encoder or cross-encoder reward. They were asked to rate each predicted summary on a scale of 1 (very bad) to 5 (very good) in terms of relevance (selection of important content from the source), consistency (the factual alignment between the summary and the summarized source), and fluency (the quality of individual sentences) and evaluate each criterion separately. The ground-truth summary was not provided during the evaluation of these three generated summaries. Overall, the participants evaluated 150 summaries and they were paid TRY500 for non-degenerate completion of the evaluations. Five native Turkish speakers participated in our study (2 undergraduate, 1 university graduate, and 2 graduate students) ages between 21 and 29 (avg. 24). Inter-annotator agreement in terms of Krippendorff’s alpha scores (Krippendorff Reference Krippendorff2011) for relevance, fluency, and consistency were 0.17, 0.18, and 0.22, respectively, showing that there is a slight to fair agreement. Each of the three criteria (relevance, fluency, and consistency) has 150 evaluations.
The results of the human evaluations are presented in Table 6. We first observe that the RL model with the bi-encoder similarity reward outperformed the MLE-only model and the RL model with the ROUGE-L reward in all dimensions (relevance, consistency, fluency) and on average. Similarly, the RL model with cross-encoder similarity reward outperformed the MLE-only model and RL model with ROUGE-L reward in all but one dimension. Finally, the overall comparison (last 3 rows of Table 6) shows that the models trained with similarity rewards performed better than the MLE-only model, in all the evaluation criteria.
Human evaluations for the summarization models (higher the better). Results are shown for the bi-encoder and cross-encoder models separately and together (all). n is the sample size (Section 4.2.4)
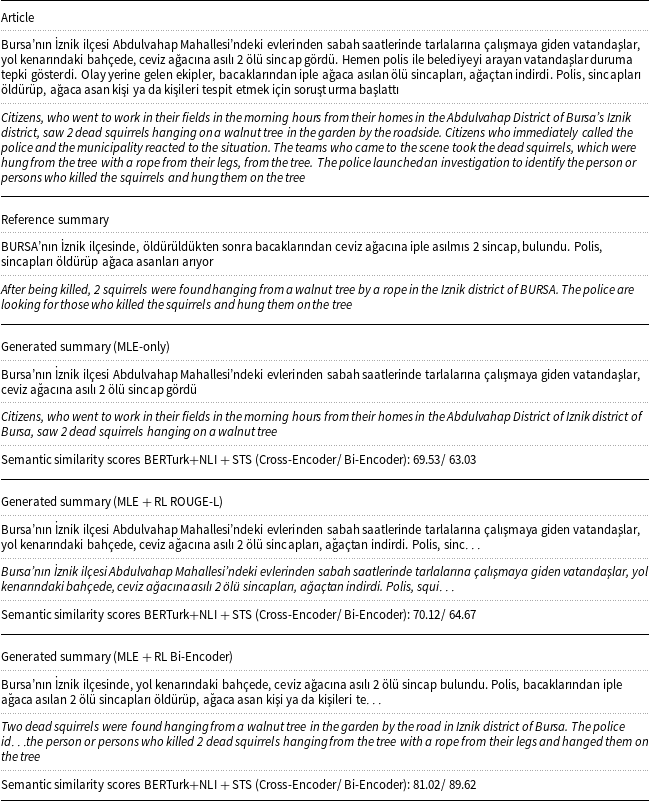
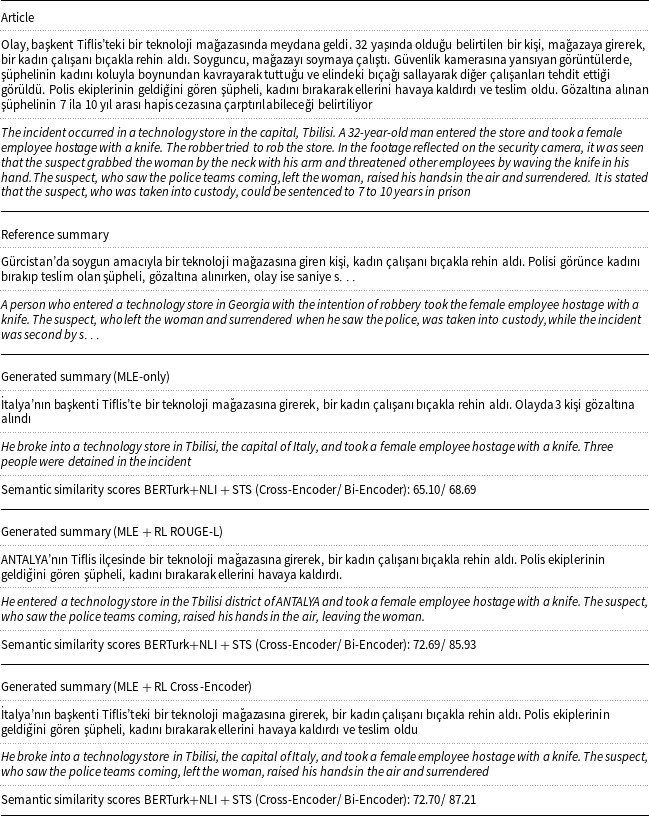
In Tables 7 and8, sample articles from MLSUM Turkish test set with the reference and generated summaries are given along with the corresponding translations. In the examples, we see that the summaries generated by RL models with bi-encoder and cross-encoder similarity rewards are more similar to the reference summaries, compared to the summaries generated by ROUGE-L reward and MLE-only models, in terms of semantic similarity scores. It should be noted that the reference or generated summaries could be truncated as we restricted the maximum summary length in our experiments.
Sample article with the reference and generated summaries from MLE-only model and MLE + RL models with ROUGE-L and bi-encoder similarity rewards, respectively
Sample article with the reference and generated summaries from MLE-only model and MLE + RL models with ROUGE-L and cross-encoder similarity rewards, respectively
5. Discussion
5.1. Findings and contributions
Our work introduced novel BERT-based semantic similarity evaluation measures to assess the quality of abstractive summaries. We showed that the proposed similarity models have higher correlations with human evaluations, compared to ROUGE scores and BERTScore. By observing that our proposed evaluation measures have high correlations with human preferences, we used the similarity measures as rewards in a reinforcement learning framework. This unique approach offers a novel way to guide the model toward generating summaries that better align with human preferences and offer semantic coherence. We show the effectiveness of our strategy through the outcomes of ablation experiments. Our results show that training by optimizing semantic similarity scores instead of ROUGE scores or MLE-only training yields better summarization results, in terms of both semantic similarity scores and human evaluations.
We have shown that for low-resource languages such as Turkish, the translated STSb dataset works well for fine-tuning BERT models for predicting semantic similarity. In addition, the two-step fine-tuning, first on the natural language inference task using the NLI-TR dataset and then with STSb-TR, has shown to be more successful compared to only using the most related dataset (STSb-TR). This is in line with other results in literature, where multi-task learning helps with generalization. The introduction of the NLI-TR dataset, with its extensive training samples, added a significant volume of diverse linguistic patterns and contextual information to our model. Furthermore, the NLI-TR dataset is designed to capture entailment and contradiction relationships between sentences. This dataset-specific feature corresponds to the nature of semantic similarity tasks, where measuring the degree of similarity often involves analyzing the contextual alignment and relatedness between sentences. Hence, the improvement we observed in semantic similarity model outcomes can be attributed to the transfer of knowledge acquired during NLI-TR fine-tuning to the STSb dataset.
5.2. Limitations
BERT-based similarity models have been shown to be effective in various natural language processing tasks; however, they may struggle with detecting minor differences between compared sentences. In our study, BERT models were fine-tuned on semantic textual similarity benchmark dataset, which has sentence pairs along with their human annotated similarity scores, including sentence pairs with small lexical differences but high semantic similarity. However, the dataset size is also rather small, with a limited scope and biased toward specific topics, genres, or domains. We applied a pre-training step on the NLI-TR dataset successfully for training our semantic similarity models, to remedy this size limitation to some extent.
In our summarization experiments, we used the mT5 model, which is a multilingual variant of the T5 architecture. However, unlike its predecessor, mT5 lacks the benefit of supervised pre-training, needing fine-tuning before it can be efficiently applied to downstream tasks. This fine-tuning process, involving reinforcement learning, requires a significant amount of computational time and resources, often requiring an extensive duration. The substantial time required for fine-tuning limited the ability to investigate a wide range of hyper-parameter settings.
We acknowledge certain limitations in our study related to the human evaluations. Our human evaluations were conducted in two phases: (1) Correlating human judgments with our proposed similarity models, and (2) comparing MLE-only and RL models with both ROUGE and our similarity rewards. While the first phase involved evaluating 50 article/summary pairs, the second phase required participants to assess 150 summaries across 50 articles, resulting in a higher cognitive workload. One of the main limitations was the level of subjectivity involved in the human evaluations. Together with the cognitive load, the subjectivity was more prominent in the second phase, resulting in lower inter-annotator agreement. We provided a larger compensation to participants to assure their motivation and involvement, within budgetary constraints.
Automatic summarization systems are relatively novel but have the potential to be used widely and increase productivity. On the other hand, the dataset used is a news dataset, which could be biased in many ways, such as the represented viewpoints. The model trained on this data might pick up on these biases in its generated summaries.
6. Summary and conclusion
In this work, we focused on two main issues in abstractive summarization: how to evaluate the results and what is a good training objective. We presented semantic similarity-based summarization evaluation measures and a reinforcement learning framework with the semantic similarity rewards.
We proposed evaluation measures using similarity scores obtained by fine-tuning the BERTurk model using cross-encoder and bi-encoder model architectures on NLI-TR (Budur et al. Reference Budur, Özçelik, Güngör and Potts2020) and STSb-TR (Beken Fikri et al. Reference Beken Fikri, Oflazer and Yanıkoğlu2021) datasets. We showed that the proposed evaluation measures have better correlations with human evaluations compared to ROUGE scores, according to both Pearson and Spearman correlations. We further showed that using bi-encoder and cross-encoder similarities as rewards improved the model results in terms of the proposed evaluation measures, as well as BERTScore and ROUGE scores. Our qualitative analyses demonstrated that the proposed models can generate summaries that are more similar to the ground truth, as compared to MLE-only models and RL models with ROUGE rewards.
It is worth mentioning that our rewards are not model-dependent in our reinforcement learning framework and can be explored in other downstream sequence-to-sequence tasks like paraphrase generation, text simplification, and semantic search. Also, the suggested framework can be applied to other languages following the described methodology.
Acknowledgments
None.
Competing interests
The authors declare none.


 Open access