


1. Introduction
There is an increasing number of hateful messages in social media that target specific communities or individuals with real-life consequences (Byman Reference Byman2021). In order to maintain a positive and inclusive environment, it is essential to identify and address hate speech. However, this task becomes increasingly difficult as the number of users continues to grow, making manual detection nearly impossible.
Machine learning and deep learning are state-of-the-art solutions for automatic hate speech detection using natural language processing (Schmidt and Wiegand Reference Schmidt and Wiegand2017). The performance of these models can be sometimes inadequate since they depend highly on data distribution, weight initialization, and backbone classifiers. The outputs of various methods can be combined to improve the success of predictions, namely ensemble learning (Gomes et al. Reference Gomes, Barddal, Enembreck and Bifet2017).
Hate speech can exist in different styles, including the intention and writing style of the author. The ambiguity of the difference between hate, offensive, and normal speech is a key factor in understanding hate speech correctly (Kumaresan and Vidanage Reference Kumaresan and Vidanage2019). Furthermore, the existence of a target group is one of the foundations of hate speech. According to Mondal, Silva, and Benevenuto (Reference Mondal, Silva and Benevenuto2017), there are different types of hate speech based on the target individuals or groups. Topics and writing styles can be important aspects of defining and understanding the target of hate speech.
1.1 Motivation
Hate speech detection is a challenging task, as human annotators may not even agree with each other on whether a given text contains hate speech or not. Indeed, utilizing crowdsourcing with a larger number of people for the annotation of a hate speech dataset can lead to more reliable results (Founta et al. Reference Founta, Djouvas, Chatzakou, Leontiadis, Blackburn, Stringhini, Vakali, Sirivianos and Kourtellis2018). Expecting a single model to detect hate speech accurately can also be challenging.
In hate speech detection, we aim to make our models focus on different aspects of the dataset and contribute to the final result. Utilizing different aspects of hate speech exposed by different hateful groups with ensemble learning can improve the performance of hate speech detection, as well as modifying these aspects as needed (e.g. adding or removing an ensemble member as data changes). As an example of different aspects of hate speech detection, an ensemble can be constructed by focusing on different topics or target groups of hate speech in a given dataset.
We employ various methods for extracting different aspects of hate speech and constructing our ensembles. Conventional ensemble learning methods are bagging and fold ensembles (Dietterich Reference Dietterich2000) that divide a given data into multiple splits without considering any particular data aspects. Using different topics or target groups in hate speech can be an alternative method that considers hate speech while splitting the data. For this purpose, we cluster train data by filtering topic keywords or applying the Gaussian Mixture Model (Reynolds Reference Reynolds2009). We also construct our ensembles by dividing users according to their influential scores, since different writing styles provided by different degrees of influence can infer varying aspects of hate speech.
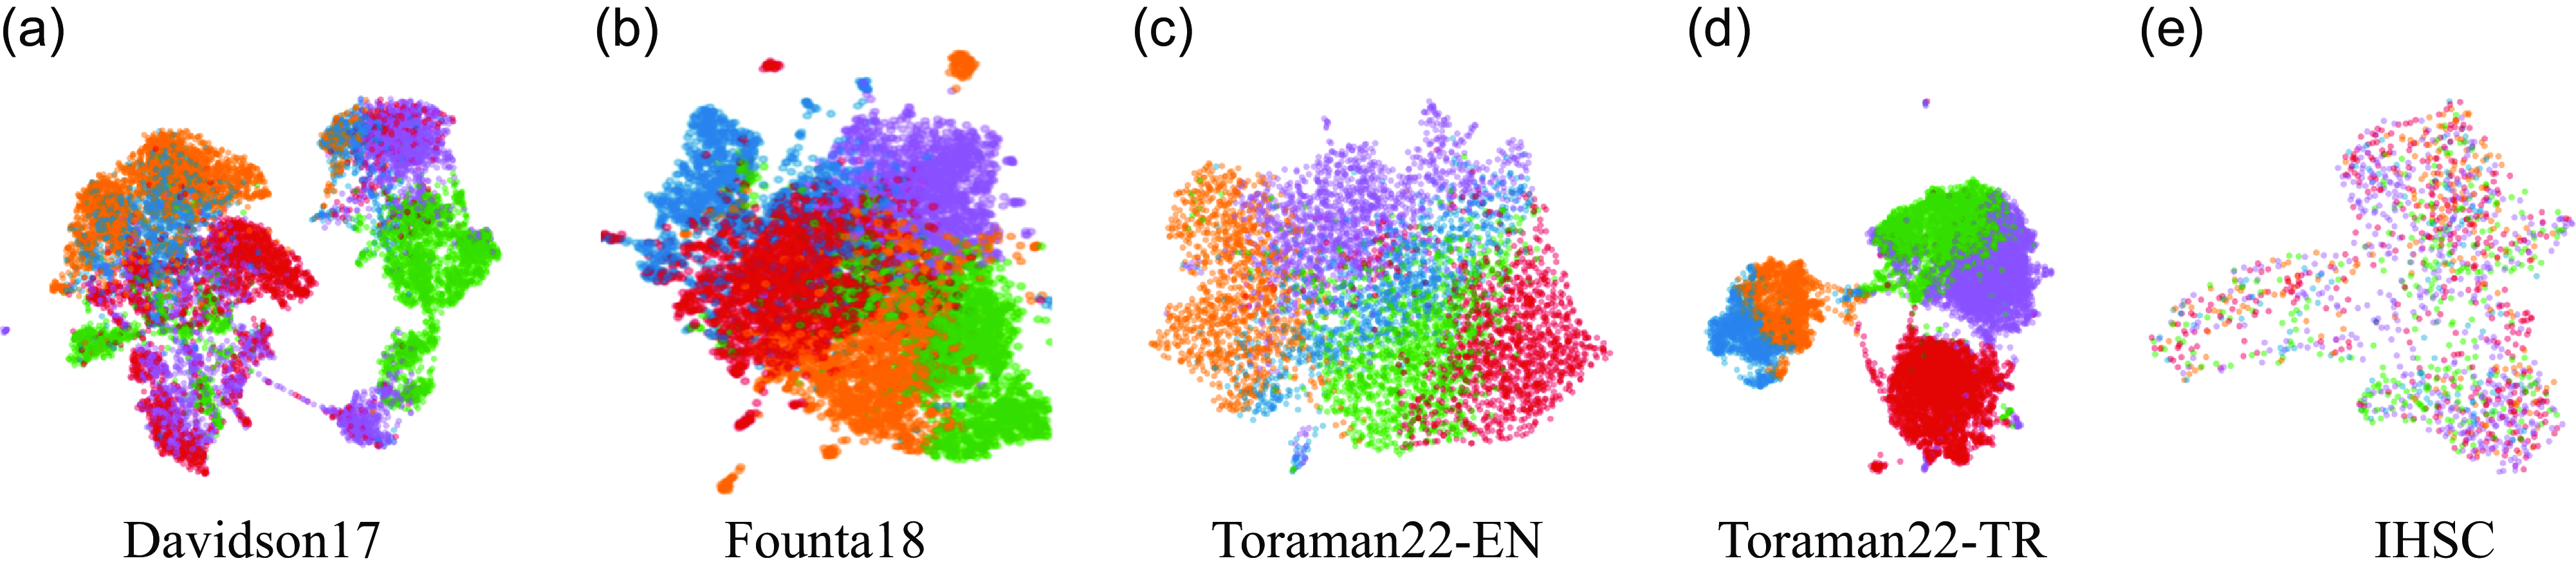
In Fig. 1, we illustrate this idea by clustering the training instances of five publicly available tweet datasets in English (Davidson et al. Reference Davidson, Warmsley, Macy and Weber2017; Founta et al. Reference Founta, Djouvas, Chatzakou, Leontiadis, Blackburn, Stringhini, Vakali, Sirivianos and Kourtellis2018; Toraman et al. Reference Toraman, Sahinuç and Yilmaz2022a) and other languages (Sanguinetti et al. Reference Sanguinetti, Poletto, Bosco, Patti and Stranisci2018; Toraman et al. Reference Toraman, Sahinuç and Yilmaz2022a) in the literature. The clusters in the figure are obtained by the Gaussian Mixture Model, showing similar parts of the datasets. We use these clusters as ensemble members or base models to represent different aspects of hate speech datasets, thereby improving the performance of hate speech detection with ensemble learning.
Ensemble members obtained by the Gaussian Mixture Model in five datasets. The hate speech datasets from (a) to (c) are in English (Davidson et al. Reference Davidson, Warmsley, Macy and Weber2017; Founta et al. Reference Founta, Djouvas, Chatzakou, Leontiadis, Blackburn, Stringhini, Vakali, Sirivianos and Kourtellis2018; Toraman, Sahinuç, and Yilmaz Reference Toraman, Sahinuç and Yilmaz2022a), (d) in Turkish (Toraman et al. Reference Toraman, Sahinuç and Yilmaz2022a), and (e) in Italian (Sanguinetti et al. Reference Sanguinetti, Poletto, Bosco, Patti and Stranisci2018). The colors represent different parts of the hate speech datasets. UMAP (McInnes and Healy Reference McInnes and Healy2018) is used for dimension reduction. Best viewed in color. Gaussian Mixture Model is applied for clustering with several five clusters. The embedding vectors are derived using a Transformer-based deep learning model fine-tuned on hate speech detection datasets.
1.2 Research questions
There are three main research questions in this study.
• RQ-1 Does ensemble learning have benefits compared to a single classifier in terms of the performance of hate speech detection? To answer RQ-1, we compare our ensemble methods with three different single classifiers that do not employ ensemble learning at all.
• RQ-2 Can we leverage different aspects of hate speech such as topics and authors to improve the performance of ensemble learning for hate speech detection? To answer RQ-2, we conduct a comprehensive experiment to compare six ensemble methods based on different aspects of hate speech with five baselines.
• RQ-3 Is the performance of hate speech ensembles language-independent? To answer RQ-3, we conduct all experiments in three different languages (English, Italian, and Turkish).
1.3 Contributions
Our study mainly focuses on constructing an ensemble of classifiers that would reflect different aspects of hate speech in social media. The task is to improve the performance of hate speech detection by ensemble learning. The input data is social media texts, specifically tweets. The contributions of this study are as follows.
• We propose to extract different aspects of hate speech that are exposed by different hateful groups for ensemble learning. To do so, we focus on the diversity of the topics and authors of tweets.
• We publish the source code for the reproducibility of ensemble members and also lexicon resources used in the experiments at https://github.com/metunlp/hate-ensemble
• We conduct detailed experiments on multiple languages (i.e. English, Italian, and Turkish) to analyze the performance of ensemble learning for hate speech detection. The results show that the performance of hate speech detection can be improved by capturing different aspects of hate speech.
1.4 Bias statement
Following Kirk et al. (Reference Kirk, Birhane, Vidgen and Derczynski2022), this study discusses examples of harmful content (hate speech stereotypes). The authors do not support using harmful language or any of the harmful representations quoted in the study. Since we do not annotate tweets in this study, we rely on the definitions of hate speech that are followed in the existing datasets used in this study (Davidson et al. Reference Davidson, Warmsley, Macy and Weber2017; Founta et al. Reference Founta, Djouvas, Chatzakou, Leontiadis, Blackburn, Stringhini, Vakali, Sirivianos and Kourtellis2018; Sanguinetti et al. Reference Sanguinetti, Poletto, Bosco, Patti and Stranisci2018; Toraman et al. Reference Toraman, Sahinuç and Yilmaz2022a).
1.5 Outline
The rest of the study is organized as follows. In the following section, we briefly summarize related work for ensemble learning and hate speech detection. We explain ensemble construction methods for hate speech detection in Section 3. We then present the experiments in Section 4, and a detailed discussion of the experimental results in Section 5. We conclude the study in the last section.
2. Related work
2.1 Ensemble learning
Ensemble learning aims to generate a set of classifiers (i.e. ensemble members or base models), and then merge their outputs to obtain the final prediction (Dietterich Reference Dietterich2000). There are various ensemble strategies (Ganaie et al. Reference Ganaie, Hu, Malik, Tanveer and Suganthan2022), including conventional classifier ensembles (Opitz and Maclin Reference Opitz and Maclin1999) such as Bagging (Breiman Reference Breiman1996) and Boosting (Schapire Reference Schapire1990). Other methods include negative correlation learning (Liu and Yao Reference Liu and Yao1999), ensemble pruning (Toraman and Can Reference Toraman and Can2012), and explicit/implicit methods such as Dropconnect (Wan et al. Reference Wan, Zeiler, Zhang, LeCun and Fergus2013) and Dropout (Srivastava et al. Reference Srivastava, Hinton, Krizhevsky, Sutskever and Salakhutdinov2014).
There are different techniques for ensemble construction. Stacking aims to construct multiple classifiers with different model types. On the other hand, other ensemble approaches employ the same model by learning different data subsets, for example Bagging (Breiman Reference Breiman1996) employs a decision tree algorithm on different data subsets. In this study, we follow the latter approach, that is using the same model (i.e. homogeneous ensemble generation) but learning different data subsets, to exploit different characteristics of hate speech datasets.
The output of ensemble members is merged in fusion strategies, for example unweighted model averaging, majority voting, and super learner (Laan, Polley, and Hubbard Reference Laan, Polley and Hubbard2007). In this study, we employ unweighted model averaging as our fusion strategy, and Transformer-based language models (Devlin et al. Reference Devlin, Chang, Lee and Toutanova2019; Sanh et al. Reference Sanh, Debut, Chaumond and Wolf2019) as backbone classifier.
2.2 Text classification and hate speech detection
Automated hate speech detection is widely studied in the natural language processing community (Schmidt and Wiegand Reference Schmidt and Wiegand2017). Text content is useful for extracting linguistic and syntactical features with the bag-of-words (Nobata et al. Reference Nobata, Tetreault, Thomas, Mehdad and Chang2016; Waseem Reference Waseem2016; Burnap and Williams Reference Burnap and Williams2016; Davidson et al. Reference Davidson, Warmsley, Macy and Weber2017). User-based features, including meta-attributes and user profiles, can be good signals to detect hate speech (Waseem Reference Waseem2016; Chatzakou et al. Reference Chatzakou, Kourtellis, Blackburn, Cristofaro, Stringhini and Vakali2017; Unsvåg and Gambäck Reference Unsvåg and Gambäck2018). Zhang et al. (Reference Zhang, Wojatzki, Horsmann and Zesch2019) study feature engineering, specifically by adding lexico-semantic features and showing the improvements by various architectures such as CNNs, LSTMs, and SVM-based classifiers. Word embeddings (Pennington, Socher, and Manning Reference Pennington, Socher and Manning2014; Nobata et al. Reference Nobata, Tetreault, Thomas, Mehdad and Chang2016; Mou, Ye, and Lee Reference Mou, Ye and Lee2020) and deep neural networks (Hochreiter and Schmidhuber Reference Hochreiter and Schmidhuber1997; Kim Reference Kim2014) are also employed to represent text semantics. Recently, BERT (Devlin et al. Reference Devlin, Chang, Lee and Toutanova2019) and similar encoder models based on Transformer (Vaswani et al. Reference Vaswani, Shazeer, Parmar, Uszkoreit, Jones, Gomez, Kaiser and Polosukhin2017) outperform previous methods for hate speech detection (Liu et al. Reference Liu, Ott, Goyal, Du, Joshi, Chen, Levy, Lewis, Zettlemoyer and Stoyanov2019; Tekiroğlu, Chung, and Guerini Reference Tekiroğlu, Chung and Guerini2020; Kennedy et al. Reference Kennedy, Jin, Mostafazadeh Davani, Dehghani and Ren2020; Caselli et al. Reference Caselli, Basile, Mitrović and Granitzer2021; Mathew et al. Reference Mathew, Saha, Yimam, Biemann, Goyal and Mukherjee2021; Röttger et al. Reference Röttger, Vidgen, Nguyen, Waseem, Margetts and Pierrehumbert2021; Toraman et al. Reference Toraman, Sahinuç and Yilmaz2022a).
Multi-task learning is leveraged by integrating hate speech detection with emotion detection to reflect the potential correlations between hate speech and certain negative emotion states (Min et al. Reference Min, Lin, Li, Zhao, Lu, Yang and Xu2023). Supervised contrastive learning is utilized for capturing span-level information for hate speech detection (Lu et al. Reference Lu, Lin, Zhang, Li, Zhang, Zong, Ma and Xu2023). The role of social stereotypes in hate speech detection is examined by the impact of social stereotypes on annotation and classification algorithms (Davani et al. Reference Davani, Atari, Kennedy and Dehghani2023).
Furthermore, there are other efforts such as extracting hate spans from hateful tweets using Transformer-based language models (Khan, Ma, and Vosoughi Reference Khan, Ma and Vosoughi2021; Zhou et al. Reference Zhou, Caines, Pete and Hutchings2022), and dedicated shared tasks such as Toxic Spans Detection (Pavlopoulos et al. Reference Pavlopoulos, Sorensen, Laugier and Androutsopoulos2021; Ranasinghe and Zampieri Reference Ranasinghe and Zampieri2021).
Instead of detecting hateful text segments, PAN21 is a shared task that profiles hate speech spreaders (Bevendorff et al. Reference Bevendorff, Chulvi, Sarracén, Kestemont, Manjavacas, Markov, Mayerl, Potthast, Rangel, Rosso, Stamatatos, Stein, Wiegmann, Wolska and Zangerle2021). The dataset in this task consists of multiple tweets of the user. The participants have solutions to detect the overall tendency for spreading hate speech including Convolutional Neural Networks (CNN) (Siino et al. Reference Siino, Di Nuovo, Tinnirello and La Cascia2021). In this paper, we detect the existence of hate speech instead of hate speech spreaders. Yet, we utilize some author features such as the number of followers and followees in our ensemble methods.
2.3 Ensemble learning for hate speech detection
Ensemble learning is applied for hate speech detection. There are efforts to combine text features an ensemble of different classifiers with a voting scheme (Anusha and Shashirekha Reference Anusha and Shashirekha2020; Hegde, Anusha, and Shashirekha Reference Hegde, Anusha and Shashirekha2021; Mutanga et al. Reference Mutanga, Naicker and Olugbara2022). Alsafari, Sadaoui, and Mouhoub (Reference Alsafari, Sadaoui and Mouhoub2020) create the ensemble of CNN and BiLSTM classifiers with contextual and non-contextual word-embedding models. Zimmerman, Kruschwitz, and Fox (Reference Zimmerman, Kruschwitz and Fox2018) examine the ensemble of three CNN-based models whose weights are initialized randomly and trained on the same dataset. Tula et al. (Reference Tula, Potluri, Ms, Doddapaneni, Sahu, Sukumaran and Patwa2021) utilize an ensemble of different models such as distilmBERT (Sanh et al. Reference Sanh, Debut, Chaumond and Wolf2019) and ULMFiT (Howard and Ruder Reference Howard and Ruder2018), and loss functions. Agarwal and Chowdary (Reference Agarwal and Chowdary2021) propose an ensemble learning-based adaptive model that works towards overcoming the strong user bias present in the dataset.
Recent advances in language models provided by the Transformer architecture (Vaswani et al. Reference Vaswani, Shazeer, Parmar, Uszkoreit, Jones, Gomez, Kaiser and Polosukhin2017) are also utilized with ensemble learning. Turban and Kruschwitz (Reference Turban and Kruschwitz2022) find that Transformer models are well-suited for ensemble learning by data augmentation techniques. Moreover, some participants in the Hate Speech Detection (HaSpeeDe) shared task at EVALITA (Sanguinetti et al. Reference Sanguinetti, Comandini, Nuovo, Frenda, Stranisci, Bosco, Caselli, Patti and Russo2020) use ensemble techniques such as fine-tuning different Transformer-based language models on the same dataset, and then create an ensemble of these models to improve their results. Similarly, there are efforts to utilize an ensemble of different Transformer-based language models for Arabic hate speech detection (Mubarak, Al-Khalifa, and Al-Thubaity Reference Mubarak, Al-Khalifa and Al-Thubaity2022; Magnossão de Paula et al. Reference Magnossão de Paula, Rosso, Bensalem and Zaghouani2022).
There are several other shared tasks such as HASOC 2021 (Mandl et al. Reference Mandl, Modha, Shahi, Madhu, Satapara, Majumder, Schäfer, Ranasinghe, Zampieri, Nandini and Jaiswal2021) and OffensEval 2019 (Zampieri et al. Reference Zampieri, Malmasi, Nakov, Rosenthal, Farra and Kumar2019) and most of the participants propose methods based on ensemble learning. Contrary to our study, ensemble methods in such studies propose combining different classifiers and model architectures (Nikolov and Radivchev Reference Nikolov and Radivchev2019; Kumar, Roy, and Saumya Reference Kumar, Roy and Saumya2021).
Our main difference from the studies that utilize ensemble learning for hate speech detection is that we construct our ensembles by using different aspects of hate speech, such as topics and users. Our focus is not on the classification algorithm or voting scheme of ensemble learning but on the way of constructing ensemble members or base models by data splitting. That is, we investigate the effect of different aspects of the datasets by keeping the model architecture the same and modifying the approach of training and ensemble construction. One can employ different classification models for each split of the dataset, however, the improvement by ensemble construction might be affected by the choice of models. Moreover, we conduct detailed experiments to understand the performance of the proposed ensemble methods for hate speech detection in multiple languages.
3. Ensemble methods for hate speech detection
In this section, we first explain our main approach for constructing ensembles with different aspects of hate speech. We then explain six methods to generate ensemble members.
Our main approach is illustrated in Fig. 2. We divide a given data into five folds as in cross-validation, as shown in Fig. 2a. Each unique (non-overlapping) data split is 20% of the whole data and is used for testing or evaluating the performance of the ensemble methods. The remaining 80% of the data is used for both training and validation.
Illustration of our main approach for ensemble learning. (a) 5-fold cross-validation is applied to obtain non-overlapping test sets (20% of data). (b) The remaining 80% of the data is used for train and validation. As an example, the Gaussian Mixture Model is applied to obtain five different parts or aspects of data, represented by different colors. (c) Five ensemble members or base models are trained by using a single part of the data, represented by black color. The remaining four parts are used for validation. (d) In the Combination method, ensemble members are trained by four parts merged, represented by black color. The remaining part is used for validation.
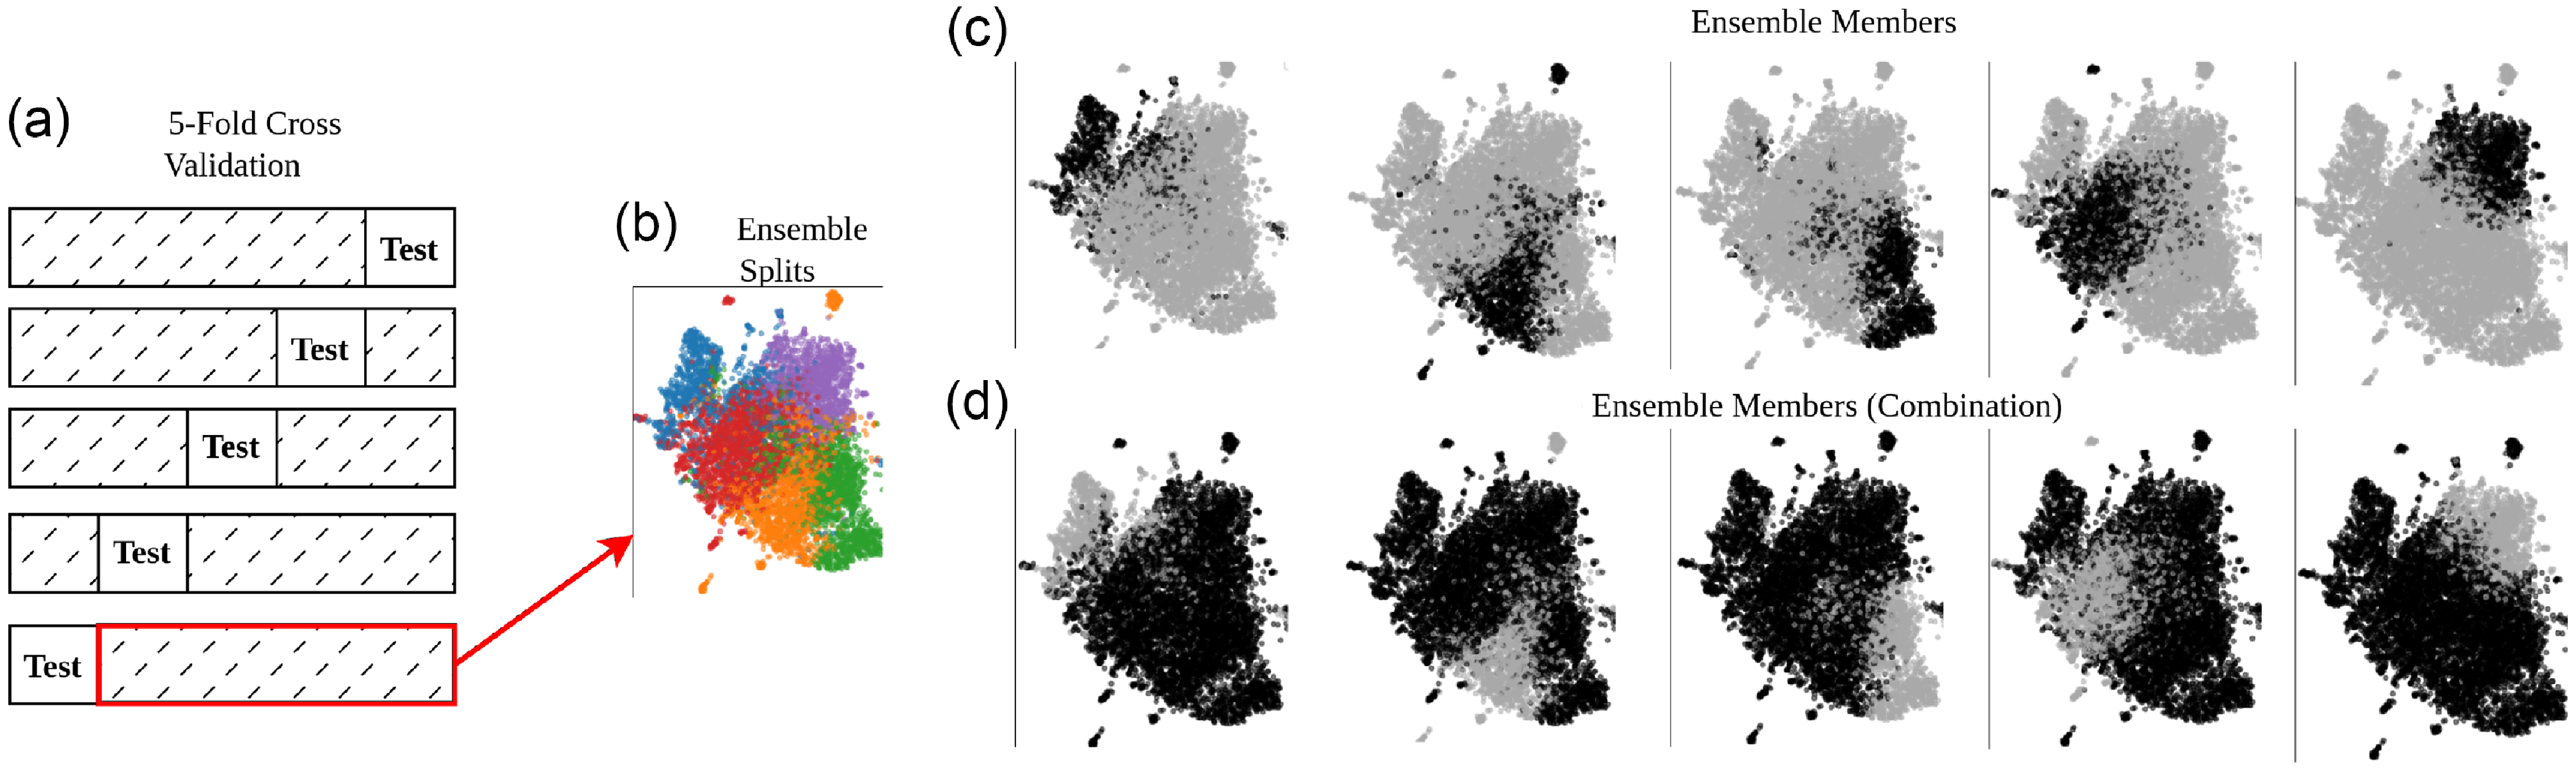
Different ensemble methods, which are explained in the following subsections, are applied on the 80% part, as represented in Fig. 2b. In the figure, we apply the Gaussian Mixture Model to split the data into fiveFootnote a coherent subsets, represented by different colors. We argue that these data splits can represent different aspects of hate speech. Therefore, we use each cluster as a train set and the remaining portion as a validation set, as represented by black and gray colors, respectively in Fig. 2c. Furthermore, due to the limited size of train splits, we introduce the Combination method that merges different data splits or aspects of hate speech. Fig. 2d depicts the members of a combination ensemble by merging multiple data splits into a single train data.
3.1 Random ensemble
As a baseline ensemble approach, we apply the bagging method (Breiman Reference Breiman1996), which randomly divides the original train set into 80% of the train and 20% of the validation set. The same process is repeated five times to obtain five ensemble members. We use the split ratio of 80-20 to have consistent training size with the main approach illustrated in Fig. 2. The best model is selected based on the validation loss for each member. We call this approach Random Ensemble since the instances in data splits are obtained randomly. The random ensemble is similar to the Combination methods in terms of train size.
3.2 Fold ensemble
Another baseline approach is the fold ensemble. In this method, the training set is stratified and divided into five folds. That is, each fold contains 20% of the train data, and there is no overlap among the fold splits. To construct an ensemble member, four of five data splits are merged (80% of the train data). This process is repeated five times with different four splits (i.e. three of five data splits). The remaining 20% of data is used for validation. In contrast to Random Ensemble, we ensure that the ratio of the classes is preserved, and each ensemble member has a different train set with 75% of overlap with other ensemble members. The fold ensemble is similar to the Combination method in terms of train size.
3.3 Topic ensemble
Random and fold ensembles do not necessarily represent different aspects of hate speech. In topic ensemble, the train set is divided according to specific hate topics such as race and gender. We rely on existing topic labels in the datasets. If topic labels do not exist, we filter the dataset by topic keywordsFootnote b to obtain topic sets. That is, tweets are assigned to a particular topic label by the existence of a topic keyword. An instance can be assigned to multiple topics.
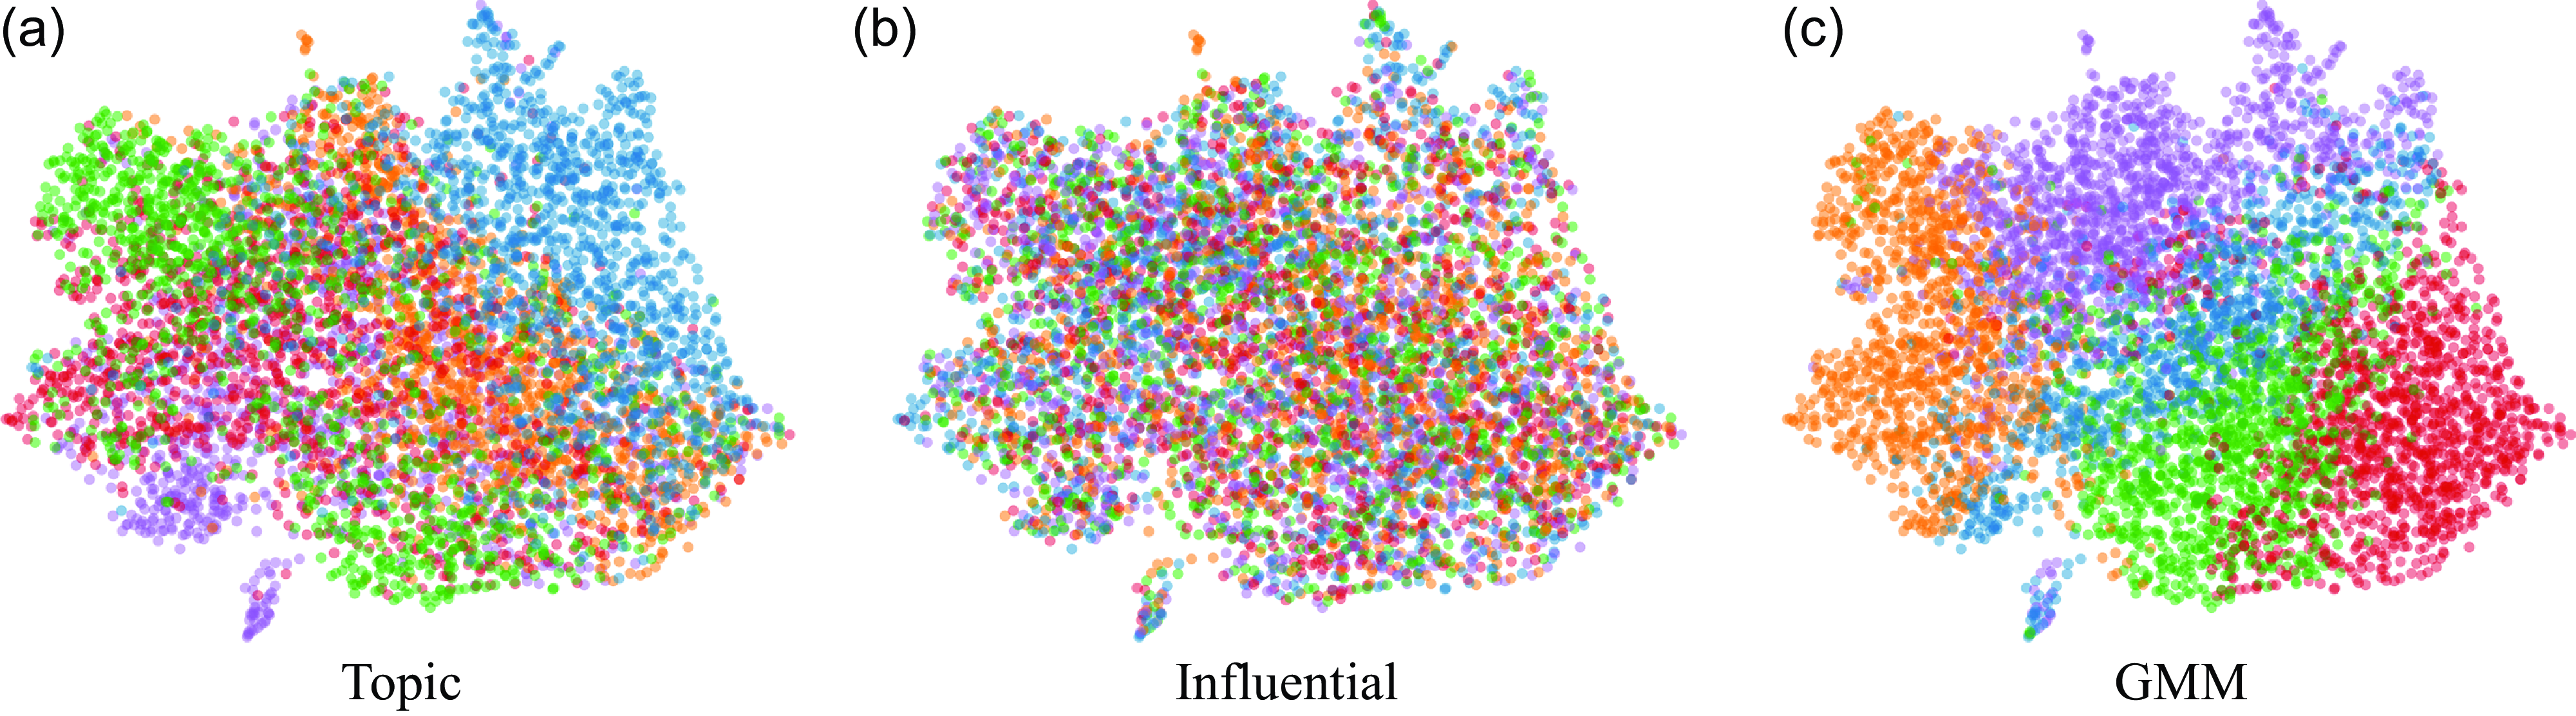
An example of topic splitting is illustrated in Fig. 3a. In this figure, we divide a dataset used in our experiments to show an example of how topic splits are represented in UMAP embedding space (McInnes and Healy Reference McInnes and Healy2018) using DistilBERT embeddings (Sanh et al. Reference Sanh, Debut, Chaumond and Wolf2019). Although the instances belonging to particular topics are mainly clustered in the embeddings space, we observe no strict distinction among different topics, represented by different colors in the figure. This observation might show that there can be overlapping parts across topics (e.g. gender-based discussions in religions), and the Topic ensemble method can extract different aspects of hate speech exposed in different topics. Since topics are content features, we refer to the Topic ensemble method as a content-based ensemble method. Validation and test splits are generated as in the main approach illustrated in Fig. 2.
Data splits for different ensemble methods (Topic, Influential, and GMM) in the Toraman22-EN dataset by using UMAP representation (McInnes and Healy Reference McInnes and Healy2018). Best viewed in color.
3.4 Influential ensemble
The user’s writing style can be an important factor in hate speech detection. We assume that users interacting with more people tend to have different writing styles (Martin, Sintsova, and Pu Reference Martin, Sintsova and Pu2014). Such influential users can have different writing styles due to their popularity. Based on the tweet author’s influential score, we divide the training set into five splits with an equal number of samples in each. We use the influential score, similar to (Toraman et al. Reference Toraman, Sahinuç, Yilmaz and Akkaya2022b), as $ \log{(n_{follower}/n_{followee})}$
where
$ \log{(n_{follower}/n_{followee})}$
where $ n_{follower}$
and
$ n_{follower}$
and $ n_{followee}$
are the numbers of followers and followees, respectively. The tweets that are shared by the users are then used in training.
$ n_{followee}$
are the numbers of followers and followees, respectively. The tweets that are shared by the users are then used in training.
An example of influential splitting is illustrated in Figure 3b. We observe significant overlapping parts across different influential splits, represented by different colors in the figure. This observation might suggest that the difference in writing styles of different influential groups is not based on the context of tweets, and the Influential Ensemble method can extract different writing styles of tweet authors who have different user features, particularly being influential in this case. We refer to the Influential ensemble method as a user-based ensemble method. Validation and test splits are generated as in the main approach illustrated in Fig. 2.
3.5 GMM ensemble
Topic ensemble relies on topic labels or keywords. To extract different topics of hate speech in an unsupervised way without labels and keywords, we use Gaussian Mixture Modeling (GMM) (Reynolds Reference Reynolds2009) that clusters the training set as a mixture of five Gaussian distributions. We choose Gaussian Mixture Modeling as the clustering method in this study for the following reasons. GMM can describe a complex set with a mixture of Gaussian distributions, which can fit the task of text clustering with pre-trained embeddings (Aharoni and Goldberg Reference Aharoni and Goldberg2020). Moreover, we use pre-trained embeddings as feature vectors, and GMM outperforms other clustering methods, such as the k-means clustering (Lloyd Reference Lloyd1982), when pre-trained embeddings are employed for representing topics in text (Sia, Dalmia, and Mielke Reference Sia, Dalmia and Mielke2020).
We use GMM to assign a sample to the most probable distribution to apply hard assignments. The GMM is initialized randomly using a fixed seed. An example of GMM splitting is illustrated in Fig. 3c. We observe a clear distinction of clusters or data splits, represented by different colors in the figure. The GMM ensemble can be useful for understanding the performance of hate ensembles when the contents in data splits are closely similar to each other. Since GMM is a probabilistic model that assumes that the instances are obtained from a mix of Gaussian distributions based on the input contents, we refer to the GMM ensemble method as a content-based ensemble method.
3.6 Combination ensemble
In contrast to using data folds as individual ensemble members, we use each fold as a validation set and combine the remaining data as a training set in the Combination method (i.e. 80% of data is for training and 20% of data is for validation), as represented in Fig. 2d. When the Combination method is not applied, training is based on a unique 20% of data, since there are five folds and we select a different fold each time for training. However, the Combination method has overlapping instances among five ensemble members since it merges four folds each time. The motivation is to increase the number of instances to be used in the training of each ensemble member while combining different aspects of hate speech.
We apply the Combination method to the Topic, Influential, and GMM methods. Note that the baseline methods, Random and Fold, have already 80% of data in the train. In other words, the normal versions of the Topic, Influential, and GMM methods have smaller training sizes than the baselines, which may cause a disadvantage in training. However, they can still challenge baselines as observed in the Experiments section.
4. Experiments
In this section, we first explain the datasets used in the experiments. We then report the experimental design and results.
4.1 Datasets
There are five datasets used in the experiments. Davidson17 (Davidson et al. Reference Davidson, Warmsley, Macy and Weber2017) and Founta18 (Founta et al. Reference Founta, Djouvas, Chatzakou, Leontiadis, Blackburn, Stringhini, Vakali, Sirivianos and Kourtellis2018) are two widely used datasets for the task of hate speech detection. Toraman22-EN (Toraman et al. Reference Toraman, Sahinuç and Yilmaz2022a) is a recent large-scale dataset with topic information, which is an important factor in creating ensemble members in this study. In order to generalize the results to multiple languages, we also use the datasets in Italian (IHSC) (Sanguinetti et al. Reference Sanguinetti, Poletto, Bosco, Patti and Stranisci2018) and Turkish (Toraman22-TR) (Toraman et al. Reference Toraman, Sahinuç and Yilmaz2022a). The reason for selecting these languages is that our ensemble approach requires topic and user information, which are partly provided in these datasets. There are also other datasets for hate speech detection such as SOLID (Rosenthal et al. Reference Rosenthal, Atanasova, Karadzhov, Zampieri and Nakov2021) with 9 million samples annotated in a self-supervised fashion. However, in this study, we rely on manually annotated datasets.
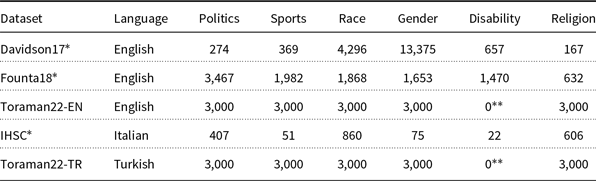
We query Twitter API to get additional features for the tweet authors in Founta18, Toraman22, and IHSC such as the number of followers and accounts being followed, to utilize them in Influential Ensemble. Moreover, since only the Toraman22 datasets provide topic labels, we filter the other datasets to obtain the instances related to topics. The final distribution of class labels and topics used in the experiments are given for all datasets in Tables 1 and 2, respectively. The details of how we obtain the dataset versions used in the experiments are given in the following subsections for each dataset.
Class distributions of the datasets used in the experiments
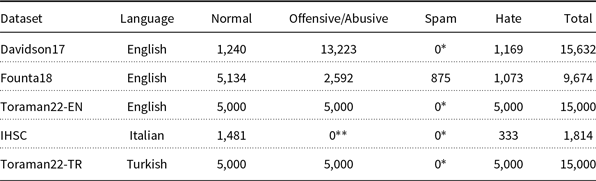
* The dataset includes no sample in the Spam class.
** The IHSC dataset includes no sample in the Offensive or Abusive class.
Topic distributions of the datasets used in the experiments
* Some instances have multiple topic labels.
** The dataset includes no sample in the Disability topic.
4.1.1 Davidson17
The Davidson17 dataset has 24,784 English tweets (Davidson et al. Reference Davidson, Warmsley, Macy and Weber2017). The dataset is annotated with three labels: Neutral, Offensive, and Hateful. For Topic Ensemble, topic labels are not provided, so we manually filter tweets by topic keywords. Out of 24,784 tweets, 15,632 were obtained for six topics. 3,352 of these samples pertain to more than one topic. While training, we use such samples in multiple topics. For Influential Ensemble, tweet IDs and user IDs are unavailable, preventing us from extracting user features and influential scores. The Influential ensemble is, therefore, not reported for the Davidson17 dataset in the experiments.
4.1.2 Founta18
The Founta18 dataset has 99,799 English tweets (Founta et al. Reference Founta, Djouvas, Chatzakou, Leontiadis, Blackburn, Stringhini, Vakali, Sirivianos and Kourtellis2018), given as tweet IDs. We query them in the Twitter API to retrieve data, and 51,216 instances are obtained due to deleted users or tweets. The dataset is annotated with four labels: Normal, Abusive, Spam, and Hateful. For Topic Ensemble, topic labels are not provided, so we manually filter tweets by topic keywords. Out of 51,216 tweets, 9,674 were obtained for six topics. 1,295 of these samples pertain to more than one topic. While training, we use such samples in multiple topics.
4.1.3 Toraman22-EN
The Toraman22-EN dataset has 100,000 English tweets (Toraman et al. Reference Toraman, Sahinuç and Yilmaz2022a). The dataset is annotated with three labels: Normal, Offensive, and Hateful. For the Topic Ensemble, five topic labels are already provided in the dataset. We sample 3,000 tweets from each topic while preserving the balance of classes, resulting in 15,000 tweets to get a data size similar to the other datasets. For Influential Ensemble, we query user features by tweet IDs in the Twitter API.
4.1.4 IHSC
The Italian Hate Speech Corpus (IHSC) has 6,928 Italian tweets (Sanguinetti et al. Reference Sanguinetti, Poletto, Bosco, Patti and Stranisci2018), published as a set of tweet IDs. The dataset is annotated with two labels: Normal and Hateful. We query them in the Twitter API to retrieve data and fetch 5,090 instances due to deleted users and tweets. For Topic Ensemble, topic labels are not provided, so we manually filter tweets by topic keywords. Out of 5,090 tweets, 1,814 were obtained for six topics. 202 of these samples pertain to more than one topic. While training, we use such samples in multiple topics.
4.1.5 Toraman22-TR
The Toraman22-TR dataset has 100,000 Turkish tweets (Toraman et al. Reference Toraman, Sahinuç and Yilmaz2022a). The dataset is annotated with three labels: Normal, Offensive, and Hateful. For the Topic Ensemble, five topic labels are already provided in the dataset. We sample 3,000 tweets from each topic while preserving the balance of classes, resulting in 15,000 tweets in order to get the data size similar to the other datasets. For Influential Ensemble, we query user features by tweet IDs in the Twitter API.
4.2 Experimental design
4.2.1 Experimental setup
We set the number of ensemble members to five since the number of labeled topics in the Toraman22 datasets is five and other datasets do not publish predetermined topic labels. We still provide an additional discussion on the varying numbers of ensemble members in Section 5.2. For preprocessing, we lowercase text and apply padding to the maximum input length of tokens with truncation.
As the backbone classifier for English, we fine-tune DistilBERT (Sanh et al. Reference Sanh, Debut, Chaumond and Wolf2019), a distilled version of BERT (Devlin et al. Reference Devlin, Chang, Lee and Toutanova2019), for the sake of efficiency since the number of training runs is significantly increased by training multiple ensemble members. We need an efficient model in terms of training time considering our limited hardware budgets. DistilBERT is a good option for this purpose since it is 60% faster than base models while retaining 97% of its language understanding capabilities (Sanh et al. Reference Sanh, Debut, Chaumond and Wolf2019).
For the baselines where we employ no ensembles (i.e. single classifiers based on varying features), we employ Autogluon (Shi et al. Reference Shi, Mueller, Erickson, Li and Smola2021) which is a well-established framework for training NLP models efficiently and robustly. For other languages, we use the Turkish version of BERT, called BERTurk,Footnote c and the Italian version of BERT, called Italian BERTFootnote d . After the CLS embedding at the last layer, we place a linear classification layer. We use the weighted cross-entropy loss, considering the number of instances per class. We choose to employ Transformer-based language models (i.e. BERT-like models)) since they outperform conventional bag-of-words and also other deep neural methods for hate speech detection (Caselli et al. Reference Caselli, Basile, Mitrović and Granitzer2021; Röttger et al. Reference Röttger, Vidgen, Nguyen, Waseem, Margetts and Pierrehumbert2021; Toraman et al. Reference Toraman, Sahinuç and Yilmaz2022a).
4.2.2 Hyperparameters
We use the scikit-learn (Pedregosa et al. Reference Pedregosa, Varoquaux, Gramfort, Michel, Thirion, Grisel, Blondel, Prettenhofer, Weiss, Dubourg, Vanderplas, Passos, Cournapeau, Brucher, Perrot and Duchesnay2011) implementation of the Gaussian Mixture Model. The parameters of the GMM are set to default as follows. The covariance type is full, the number of components is five, the threshold is 0.01, the maximum number of iterations is 150, and the floor on the diagonal of the covariance matrix to prevent overfitting is 0.001.
We use distilbert-base-uncased for DistilBERT, bert-base-turkish-cased for BERTurk, and bert-base-italian-cased for Italian BERT with the help of the Transformers library by Huggingface (Wolf et al. Reference Wolf, Debut, Sanh, Chaumond, Delangue, Moi, Cistac, Rault, Louf, Funtowicz, Davison, Shleifer, von Platen, Ma, Jernite, Plu, Xu, Le Scao, Gugger, Drame, Lhoest and Rush2020). Epoch size is set to $5$
, the learning rate is set to 5e-5, the learning rate scheduler is set to default (linear), the optimizer is set to default (adamw_hf), the batch size is set to
$5$
, the learning rate is set to 5e-5, the learning rate scheduler is set to default (linear), the optimizer is set to default (adamw_hf), the batch size is set to $16$
, and the dropout rate is set to
$16$
, and the dropout rate is set to $0.4$
. We use the same hyperparameters for all methods. The values are determined in preliminary experiments by considering the task and hardware that we employ. The main idea is to keep all these parameters fixed for all methods since they are used for fine-tuning Transformer-based language models rather than ensemble learning. In these settings, training and evaluation take in between 50 and 60 minutes using three GPUs (Nvidia RTX 2080) for five ensemble members.
$0.4$
. We use the same hyperparameters for all methods. The values are determined in preliminary experiments by considering the task and hardware that we employ. The main idea is to keep all these parameters fixed for all methods since they are used for fine-tuning Transformer-based language models rather than ensemble learning. In these settings, training and evaluation take in between 50 and 60 minutes using three GPUs (Nvidia RTX 2080) for five ensemble members.
4.2.3 Evaluation metric
We use stratified 5-fold validation. For each fold, 20% of the data is set aside as the test set, while the remaining 80% is further split into a train set and validation set. Since the number of ensemble members is set to five, we split this 80% of data into five parts of equal size, and then obtain train and validation sets based on the ensemble methods explained in Section 3. The validation sets are used for finding the optimal models according to their validation losses during a number of epochs of training. Within each fold, we train five base models with the same backbone using different train-validation pairs derived from the 80% part of the whole data as explained in Section 3. The softmax probabilities of five models are unweighted-averaged to get the final prediction.
We evaluate models with the F1 score using scikit-learn (Pedregosa et al. Reference Pedregosa, Varoquaux, Gramfort, Michel, Thirion, Grisel, Blondel, Prettenhofer, Weiss, Dubourg, Vanderplas, Passos, Cournapeau, Brucher, Perrot and Duchesnay2011). The F1 score is calculated as follows.
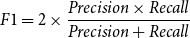 \begin{equation*} F1 = 2 \times \frac{Precision \times Recall}{Precision + Recall} \end{equation*}
where $Precision$
is the ratio of the correct predictions over all predictions, and
$Precision$
is the ratio of the correct predictions over all predictions, and $Recall$
is the ratio of the correct predictions over all true samples. We apply the weighted F1 score to get the average score over all classes since most of the datasets in the experiments are imbalanced.
$Recall$
is the ratio of the correct predictions over all true samples. We apply the weighted F1 score to get the average score over all classes since most of the datasets in the experiments are imbalanced.
We report the average of 5-fold results, along with their standard deviation. Moreover, we apply a paired t-test to find any statistically significant difference at a 95% interval in pairwise comparisons between two mean scores.
4.2.4 Baselines
Our focus in this study is the way of constructing ensemble members or base models by data splitting. We, therefore, compare our ensemble construction methods with the following baseline methods:
-
• Single-Text: We fine-tune a single model with the same size of train data. The motivation is to understand the performance when no ensemble method is applied.
-
• Single-Text-Topic: We fine-tune a single classifier that includes the text features and topic information. CLS text embeddings from the Transformer-based language models are concatenated with topic embedding (one-hot vector) that represents the tweet’s topic. This concatenated embedding vector is then given to a linear classification layer.
-
• Single-Text-Influential: We fine-tune a single classifier that includes the text features and user features. CLS text embeddings are concatenated with influential features, which are follower and followee counts. The features are then given to a linear classification layer.
-
• Ensemble-Bagging: A baseline ensemble construction method is to create ensemble members by selecting data randomly, as explained in Section 3.
-
• Ensemble-Fold: A baseline ensemble construction method is to create ensemble members by splitting data discretely, as explained in Section 3.
We refer to our ensemble construction methods (i.e. Topic, GMM, Influential, and their Combination versions) as Ensemble-MethodName in the experimental results. For instance, Ensemble-Topic refers to the ensemble approach explained in Section 3.3.
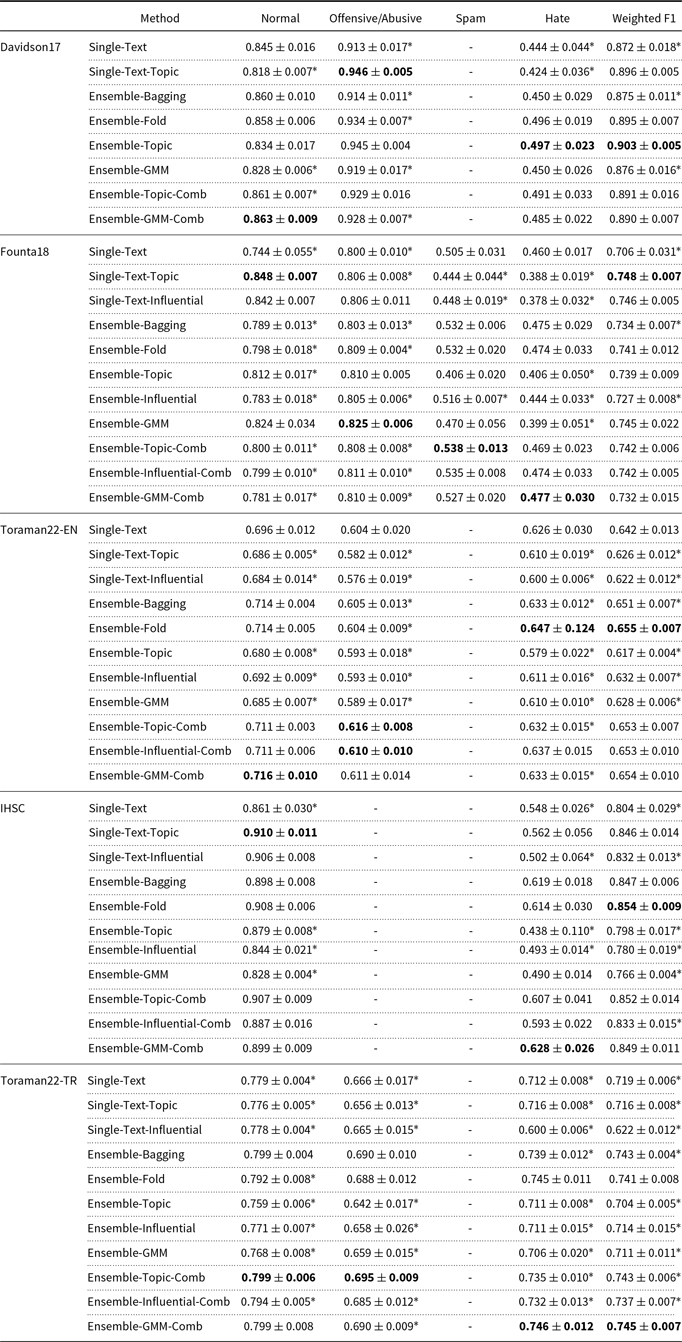
Comparison of ensemble methods for hate speech detection. An average of 5-fold is reported in terms of the F1 score. The highest scores for each class and dataset are given in bold. The symbol “*” indicates a statistically significant difference using a paired t-test at a 95% interval in pairwise comparisons between the highest-performing method and others
4.3 Experimental results
We present the results of ensemble methods for multi-class hate speech detection in all datasets in Table 3. We omit the results of a class label when the dataset includes no instances for this class label. Our observations that reflect the answers to the research questions of this study are given as follows.
RQ-1: Improvements by ensemble learning. We examine if ensemble learning provides any improvements to the performance of hate speech detection. Therefore, we pair the performance scores of a single model with an ensemble model. For instance, there are two single and six ensemble models in Davidson17, resulting in 12 pairs concerning Weighted F1 score. We observe that the highest-performing method in terms of the weighted F1 score is a type of ensemble learning, compared to the Single classifier, in all datasets. The ensemble methods yield better scores than the single methods in 67 of 108 (62%) comparisons in terms of the weighted F1 score. Furthermore, the Combination ensemble methods have better results than the single methods in 31 of 40 (78%) comparisons. The Combination method merges different splits to increase the number of instances and thereby improves the performance in most cases.
RQ-2: Benefits of ensemble methods that leverage different aspects of hate speech. When we compare our ensemble methods with the baseline ensemble approaches, we find that our proposed ensemble construction methods perform the highest in terms of the F1 score of the Hate class in four of five datasets (80% of the datasets) and in terms of the F1 score of the Offensive class in three of four datasets (75% of the datasets). We thereby argue that our ensemble construction methods can capture better different aspects of hate speech compared to the baseline ensemble construction methods. On the other hand, the Fold method performs the highest for the Hate class and weighted F1 score in Toraman22-EN. The reason could be the balanced distribution of both classes and topics in this dataset. Similarly, the Fold method performs highest in terms of the weighted F1 score in the IHSC dataset, however, our method has a better performance in the positive class (Hate), which is more important in this case since the task is binary classification (Normal vs. Hate) in this dataset.
Ensemble methods based on different user styles can be useful for reflecting user styles for hate speech. We demonstrate this idea with the influential feature of tweet authors. However, the Influential method is not the highest-performing method in any datasets, probably because the users in the same ensemble member do not necessarily have the same writing style of hate speech, or due to possible noise in the ensemble members. Nevertheless, we argue that this method is still promising such that its combination version performs in the top-3 highest methods in Founta18 and Toraman22-EN. We argue that a deeper examination of data splits or user features might improve performance by reflecting different hate styles.
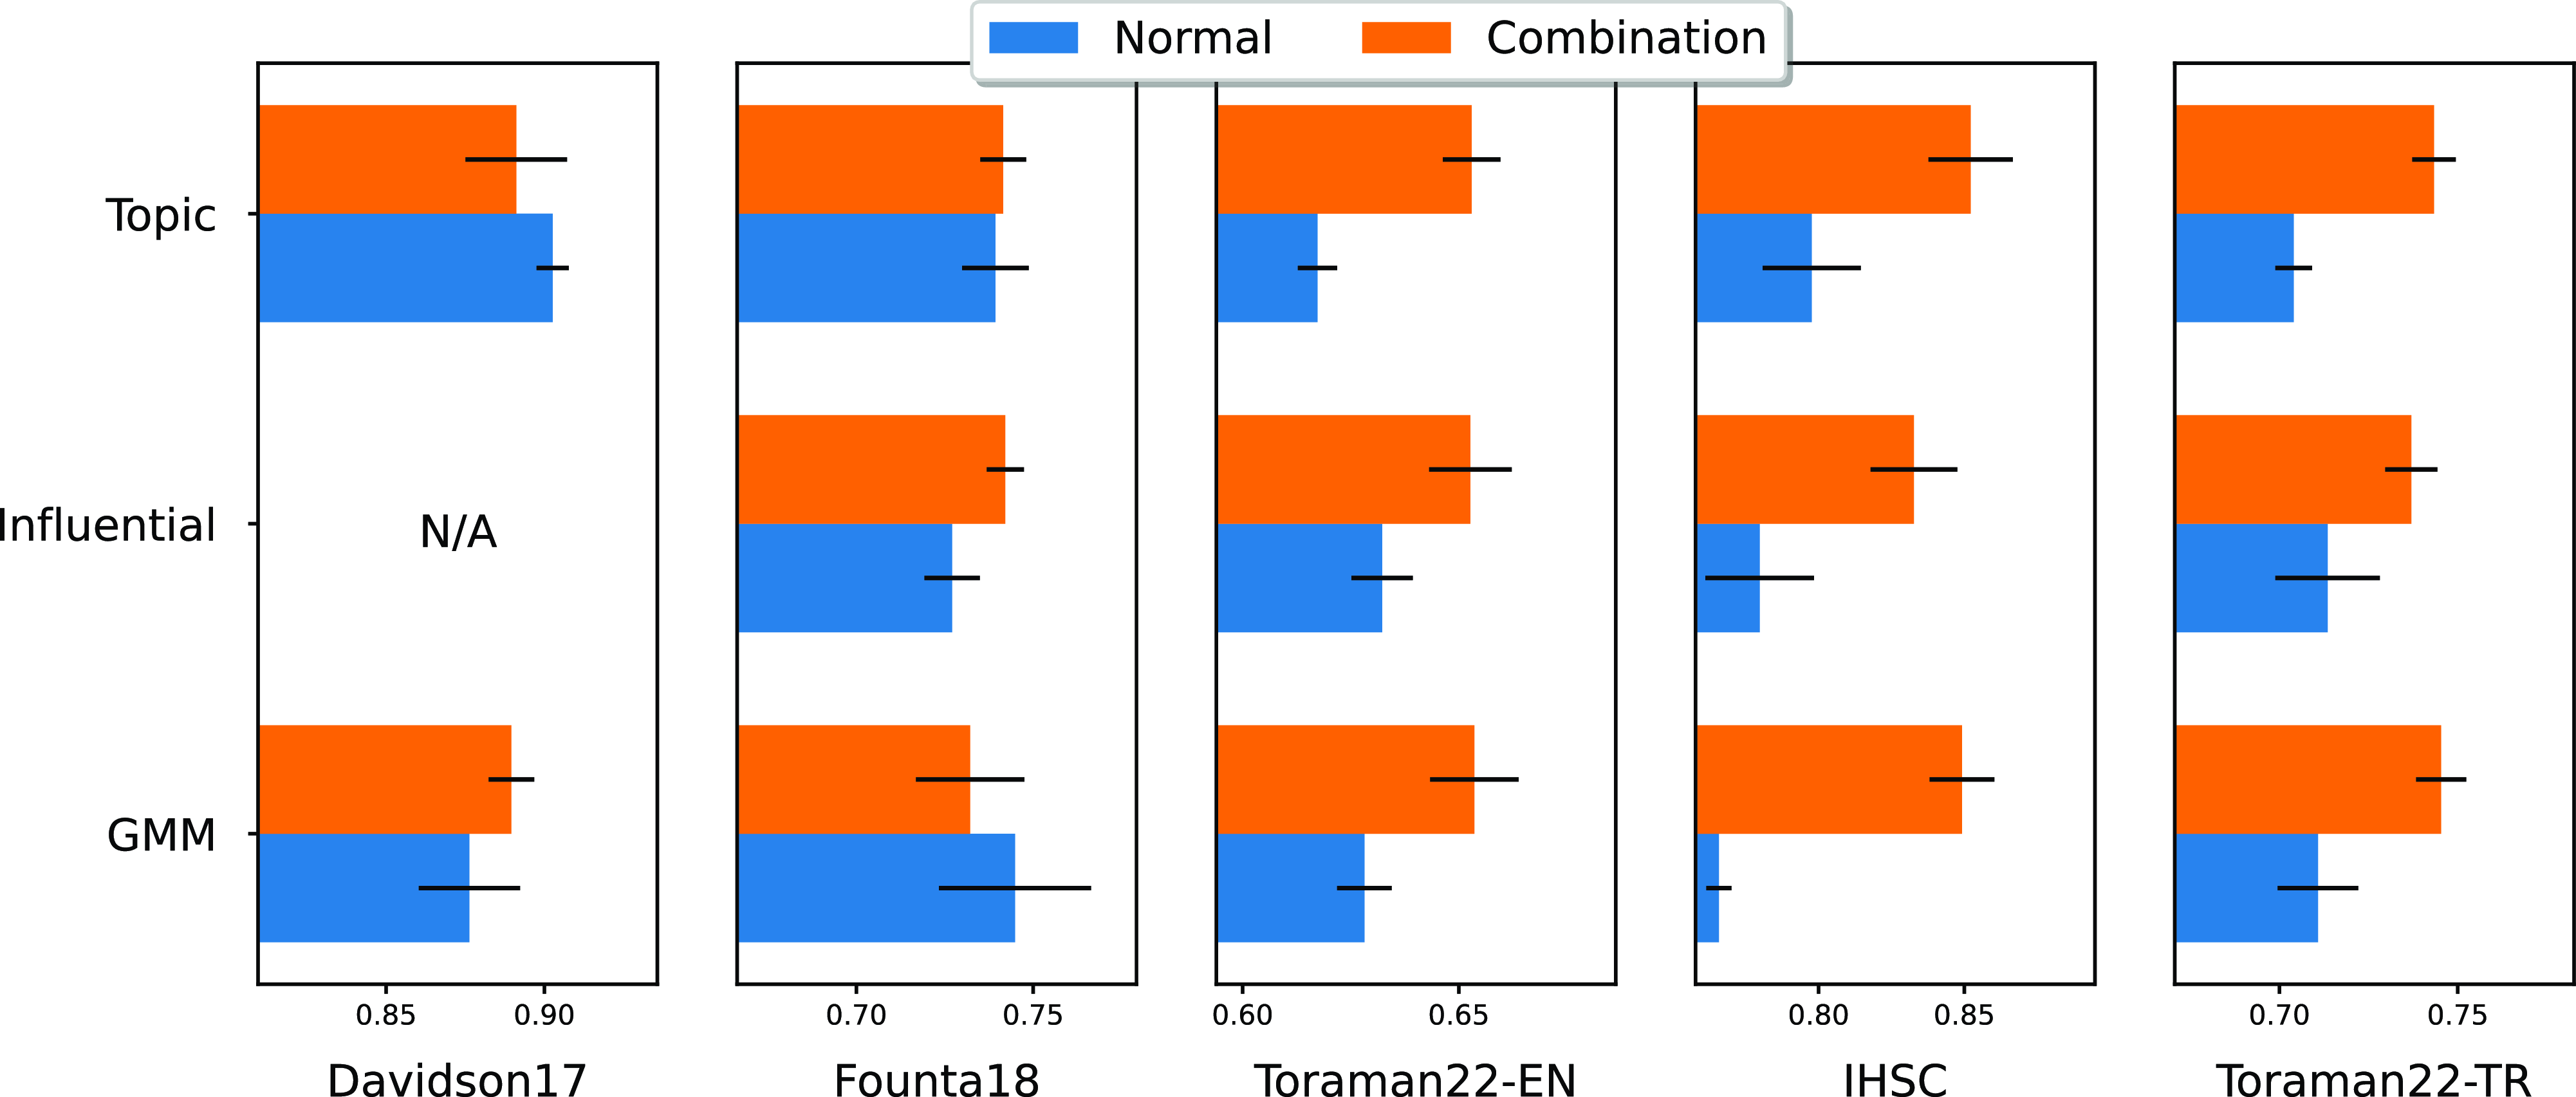
When we compare our normal and combination approach for constructing ensembles in Fig. 4, we observe that the Combination version outperforms in 12 of 14 (86%) comparisons. The better performance of the Combination method is probably due to the increased amount of samples in data splits used in training each ensemble member. The efficacy of the suggested models depends critically on the size of the training set while using deep learning methods (Bailly et al. Reference Bailly, Blanc, Francis, Guillotin, Jamal, Wakim and Roy2022). Note that our normal method uses a single data split (20% of the whole data) to train an ensemble member, while the Combination method merges four splits (80% of the whole data) that result in a similar number of instances as in the baseline methods (Bagging and Fold). We argue that our main ensemble approach splits the data to obtain different aspects of hate speech for ensemble learning, and the combination of different aspects can further improve the performance of hate speech detection.
Performance comparison of our proposed ensemble methods (i.e. GMM, Topic, and Influential) with their Combination versions, as explained in Section 3, for all datasets in different subplots.
In terms of class labels, we observe that the content-based models (i.e. GMM and Topic) perform the highest for the Hate class in four of five datasets. We argue that different writing styles can be captured by the content-based models since they cluster sentence embeddings, which are encoding vectors of the text contents.
Furthermore, we observe that the Topic method performs the highest for the Offensive/ Abusive class in three of four datasets and for the Spam class in the Founta18 dataset. Some words are not necessarily offensive, abusive, or spam in another context. We thereby argue that the topic splits can better capture the differences in offensive, abusive, and spam classes.
RQ-3: Language-independent ensemble methods for hate speech detection. The good performance of ensemble methods is also valid for other languages, that is Italian and Turkish. In our experiments, the highest-performing ensemble method improves the performance of the single approach statistically significantly in both Italian and Turkish languages. Moreover, an ensemble method that leverages different topic aspects of hate speech, GMM Combination, has the highest performance in the Hate class in both Italian and Turkish. We argue that our observations support that the performance of hate speech ensembles is language-independent, though the experiments are still limited to three languages (English, Italian, and Turkish).
5. Discussion
In this section, we provide a post-analysis of the ensemble approach and experimental results in terms of additional baselines, ensemble parameters, and writing style. We also include a brief discussion on the limitations of our study.
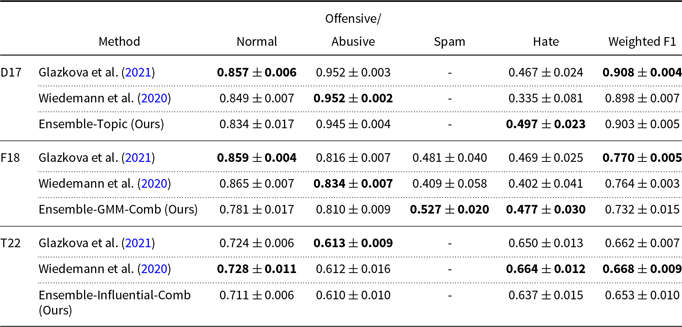
Comparison of our highest scores with state-of-the-art ensemble methods. An average of 5-fold is reported in terms of the F1 score. The highest scores for each class and dataset are given in bold. Davidson17, Founta18, and Toraman22-EN are shortened as D17, F18, T22, respectively
5.1 Comparison with state-of-the-art ensemble methods
Our approach emphasizes the utilization of different styles of hate speech for ensemble learning. We therefore compare our ensemble construction methods with baseline ensemble construction methods in Section 4. However, ensemble learning is a widely used method in hate speech detection especially in shared tasks and challenges, as mentioned in Section 2.1. We implement two of the state-of-the-art ensemble learning models which yielded the best results on their shared tasks (Wiedemann, Yimam, and Biemann Reference Wiedemann, Yimam and Biemann2020; Glazkova, Kadantsev, and Glazkov Reference Glazkova, Kadantsev and Glazkov2021). The results are reported in Table 4.
Glazkova et al. Reference Glazkova, Kadantsev and Glazkov(2021) proposed an ensemble model for HASOC in FIRE 2021 (Mandl et al. Reference Mandl, Modha, Shahi, Madhu, Satapara, Majumder, Schäfer, Ranasinghe, Zampieri, Nandini and Jaiswal2021). The authors implemented a five-member ensemble with a soft-voting algorithm (i.e. averaging the prediction probabilities). They used Twitter-RoBERTa (Barbieri et al. Reference Barbieri, Camacho-Collados, Anke and Neves2020) as the backbone model. On the other hand, Wiedemann et al. Reference Wiedemann, Yimam and Biemann(2020) proposed an ensemble method for the shared task SemEval-2020 (Zampieri et al. Reference Zampieri, Nakov, Rosenthal, Atanasova, Karadzhov, Mubarak, Derczynski, Pitenis and Çöltekin2020). They implemented a 10-fold ensemble method, as similar to our combination fold method, using RoBERTa-large (Liu et al. Reference Liu, Ott, Goyal, Du, Joshi, Chen, Levy, Lewis, Zettlemoyer and Stoyanov2019). We re-implement their method with a smaller model from the same model family, RoBERTa-base, since our limited hardware resources do not support RoBERTa-large while training ensemble learning.
Although the state-of-the-art methods have better weighted F1 scores, we observe that our highest-performing approach still outperforms the state-of-the-art methods in the Hate class of Davidson17 and Founta18. Note that our approach is ensemble construction for different hate speech styles but not optimizing performance score as in shared tasks by ensemble parameters (e.g. the backbone model and the number of ensemble members) and deep learning hyperparameters (e.g. learning rate). We argue that focusing on the optimization of both ensemble learning and different hate speech styles together can further improve the performance of hate speech detection.
5.2 Varying number of ensemble members
The number of ensemble members or base models can be a challenging parameter such that varying the number of ensemble members can significantly change the performance results (Bornheim, Grieger, and Bialonski Reference Bornheim, Grieger and Bialonski2021). In Table 3, we set the number of ensemble members to five, except that the number of ensemble members of the Topic method varies from five to six topics as reported in Table 2. In this subsection, we compare the results of varying numbers of ensemble members from three to seven to understand its effect on the performance of our approach for hate speech detection. We report the performance in terms of weighted F1 score for each dataset in Fig. 5.
Performance comparison of a varying number of ensemble members in terms of weighted F1 score in all datasets for the Fold, Influential, and GMM ensemble methods from (a) to (c), respectively.
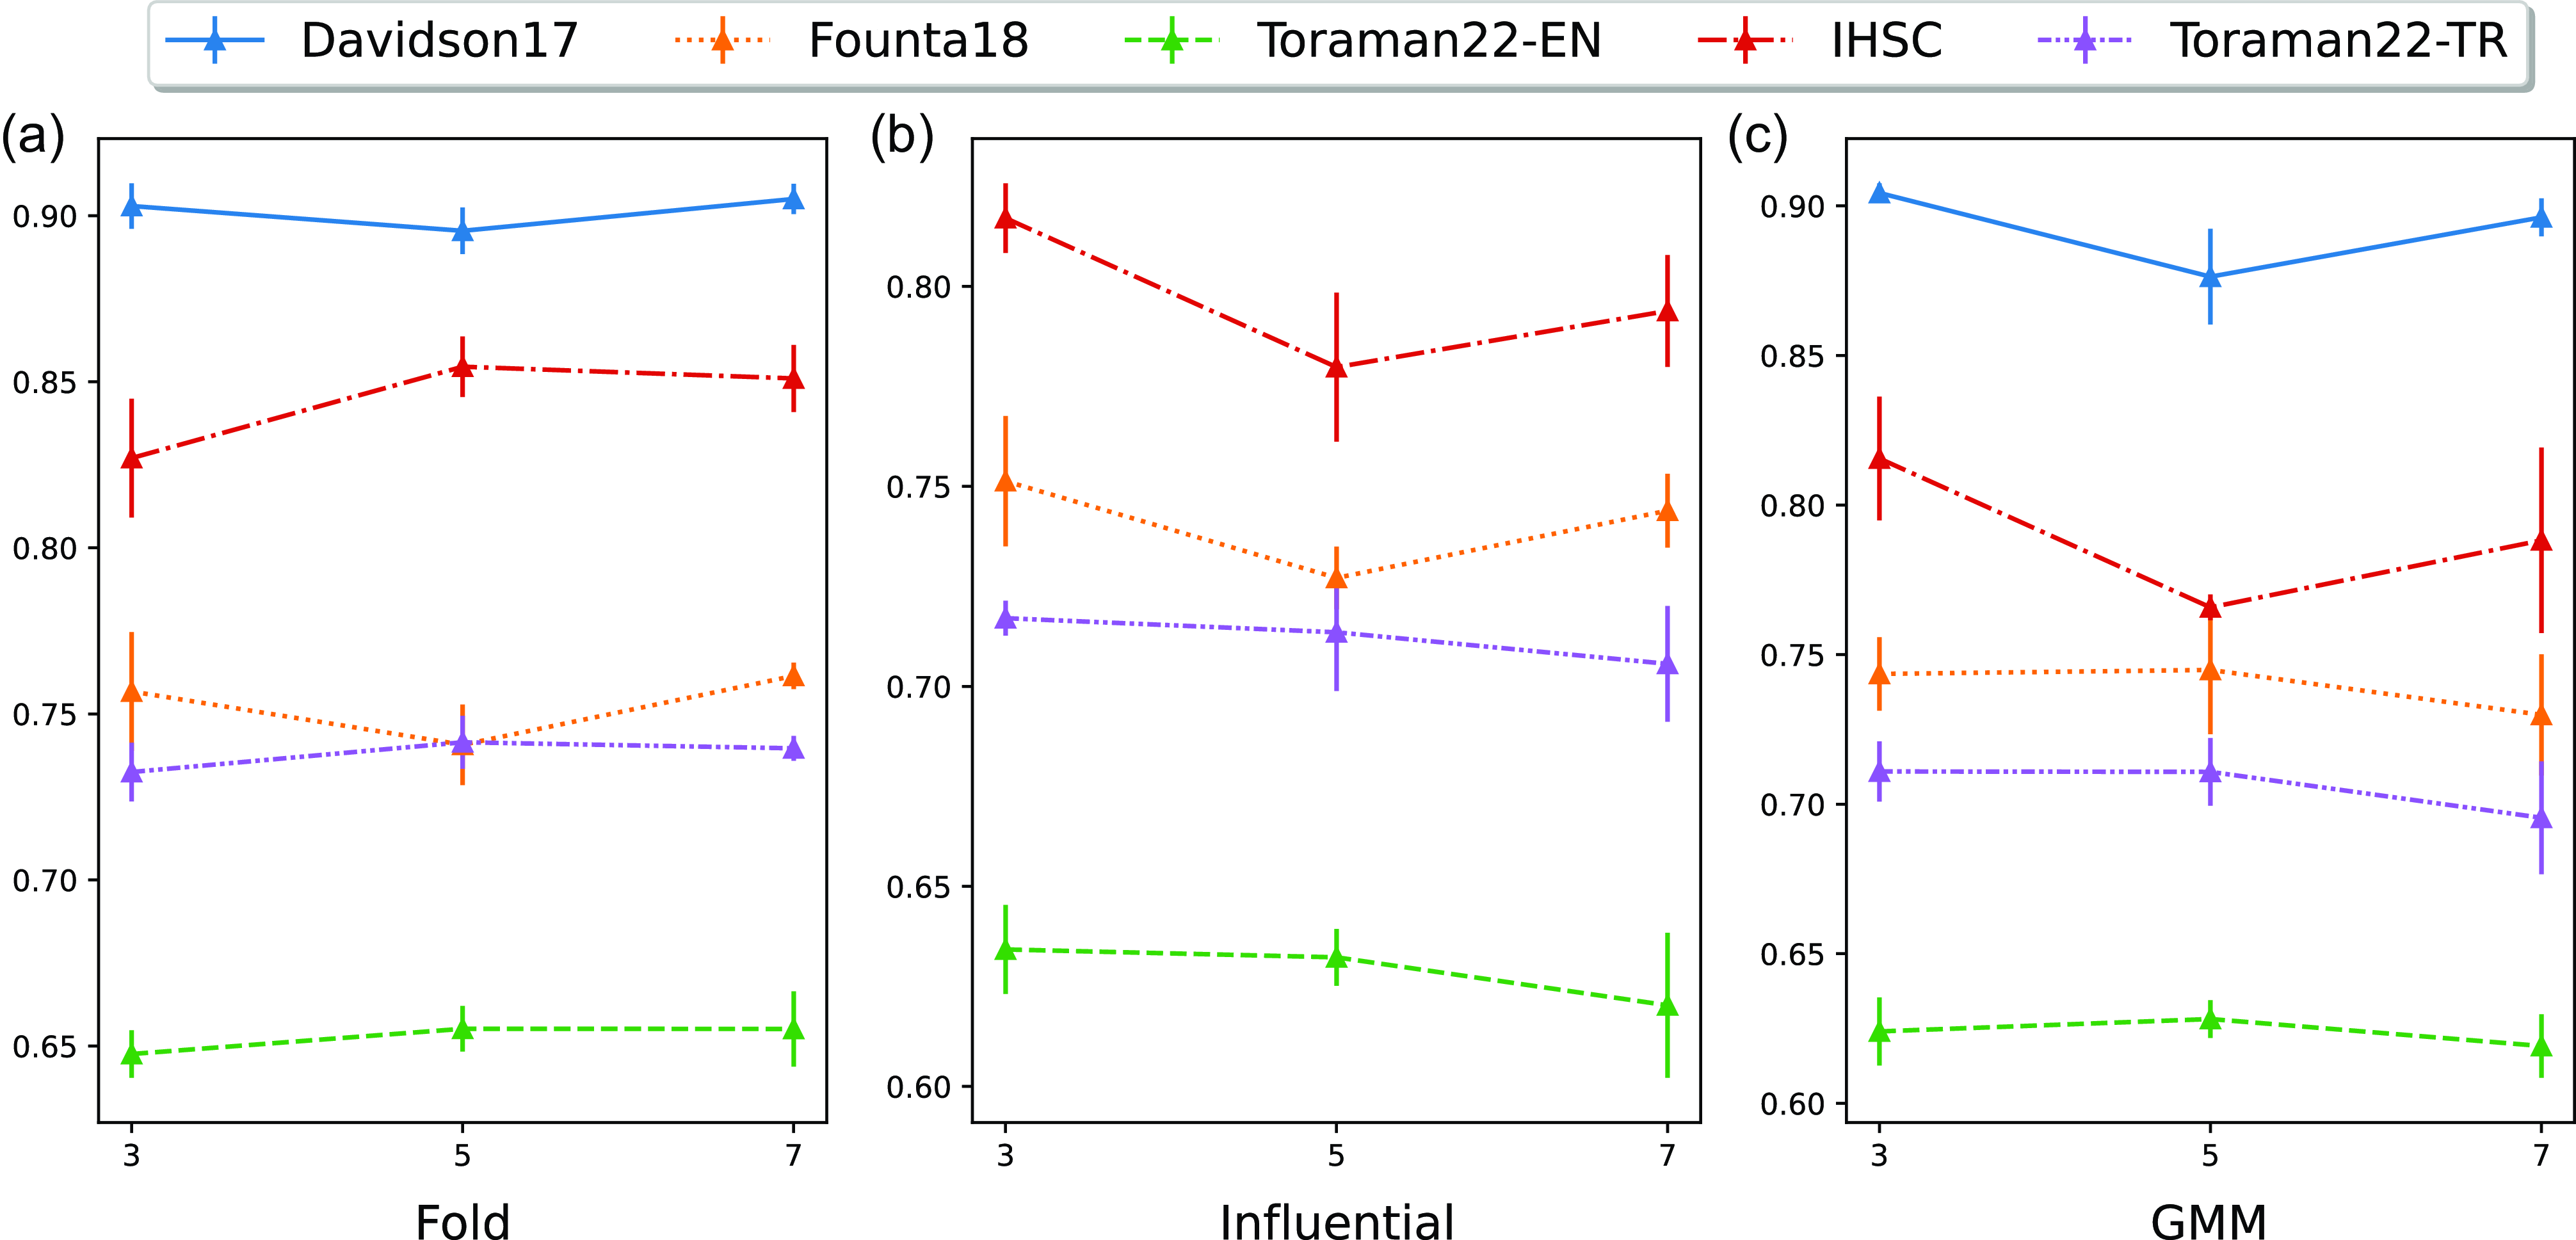
We apply the same hyperparameters as in Section 4, except for the number of ensemble members. We vary the number of ensemble members by using three, five, and seven members in this additional experiment. We select a baseline ensemble approach (i.e. Fold) and two proposed ensemble methods (i.e. GMM and Influential).
The performance does not deteriorate as the number of ensemble members increases in the majority of the cases for the Fold method. Since the Fold method splits the data and then merges a majority of the splits to train an ensemble member, the higher number of members, such as seven, can have more data instances, and therefore perform no worse than a smaller number of members.
In contrast to the results in the Fold method, the performance score of the GMM and Influential methods mostly decreases as the number of ensemble members increases. This observation supports the benefit of our ensemble approach that accounts for different aspects of hate speech. We argue that writing styles and topics are not captured well in seven members since the number of training instances might not be sufficient to cover a number of writing styles and topics inherently.
5.3 Writing style analysis
In our experiments, we use several features to analyze the intrinsic features of the writing style. Zangerle et al. Reference Zangerle, Mayerl, Potthast and Stein(2023) have a shared task that aims to distinguish the authors in multi-author documents where no other information is in the corpus but only the raw text. The writing style is based on the stylistic fingerprints in the text such as lexical features (n-grams) (Stein et al. Reference Stein, Rosso, Stamatatos, Koppel and Agirre2009; Schwartz et al. Reference Schwartz, Sap, Konstas, Zilles, Choi and Smith2017), word frequencies (Holmes Reference Zheng, Li, Chen and Huang1998), average word and sequence length (Zheng et al. Reference Holmes2006; Schwartz et al. Reference Schwartz, Sap, Konstas, Zilles, Choi and Smith2017), and structural features (Zheng et al. Reference Zheng, Li, Chen and Huang2006). In our work, the motivation of this analysis is to understand the writing style of different ensemble members. We argue that our ensemble approach can reflect different aspects of hate speech, and writing style can be an important factor in this regard.
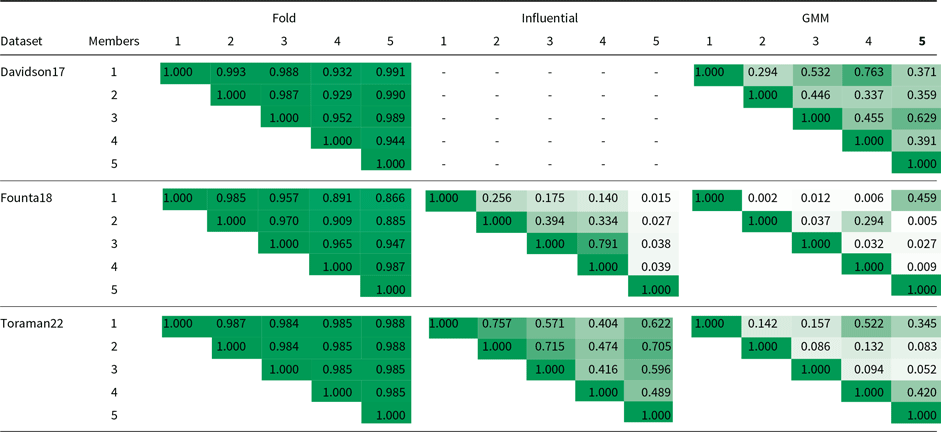
We analyze the results of a baseline ensemble method (i.e. Fold) and two of our proposed ensemble methods (i.e. Influential and GMM) in terms of word n-grams, specifically bigrams when n equals two. In Table 5, we concatenate the instances of each ensemble member and extract bigrams. We obtain a TF-IDF vector (Pedregosa et al. Reference Pedregosa, Varoquaux, Gramfort, Michel, Thirion, Grisel, Blondel, Prettenhofer, Weiss, Dubourg, Vanderplas, Passos, Cournapeau, Brucher, Perrot and Duchesnay2011) for each ensemble member using the most frequent 50 bigrams. We then calculate cosine similarity between TF-IDF vectors of two ensemble members and report the scores for all pairs of members in Table 5. The results show that the similarity scores between the pairs of ensemble members are much smaller in the Influential and GMM methods compared to the Fold method. In other words, the members in the Influential and GMM methods have much more variety in writing style compared to the members in the Fold method. Moreover, the GMM method has more variety in writing style compared to the Influential method, probably due to the fact that we separate GMM members based on embedding vectors.
Writing style comparison in terms of cosine similarity scores between bigram TF-IDF vectors of each ensemble member. The table is colored according to the scores in each cell: The higher the similarity score, the color gets darker. The Davidson17 dataset has no influential data. The similarity matrices are symmetric
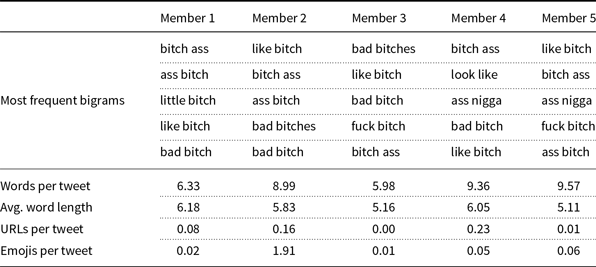
Furthermore, we analyze the results of our proposed ensemble methods (i.e. GMM, Influential, and Topic) in terms of additional writing style features that may differ between the data splits used in training, such as the average number of words, the average number of URLs, and the average number of emojis. We also list the most frequent bigrams in each ensemble member. In this analysis, we report on the Topic, Influential, and GMM methods on the Davidson17 and Founta18 datasets. We select these datasets since the Topic method performs the highest in Davidson17, and GMM in Founta18, as observed in Table 3.
5.3.1 Analysis of Davidson17
The results are given in Tables 6 and 7 for the Topic and GMM methods, respectively.
Writing style analysis for the Topic method in the Davidson17 dataset
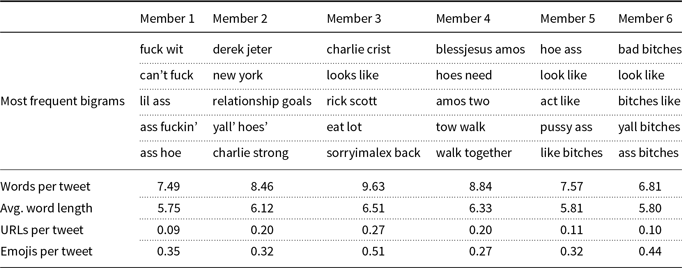
Writing style analysis for the GMM method in the Davidson17 dataset
Writing style analysis for the Topic method in the Founta18 dataset
In all ensemble methods, we observe that the average number of words, the average word length, the average number of URLs, and the average number of emojis differ among ensemble members. We argue that these differences could represent different user types or hate styles.
In terms of word n-grams, the same or similar bigrams are observed in the GMM method, compared to the Topic method. For instance, the “b*tch” and “*ss” words mostly exist in all ensemble members. That is, the splits of the GMM method seem to have similar writing styles in terms of bigrams. The worse performance of the GMM method in Table 3 can be attributed to this observation in this dataset.
5.3.2 Analysis of Founta18
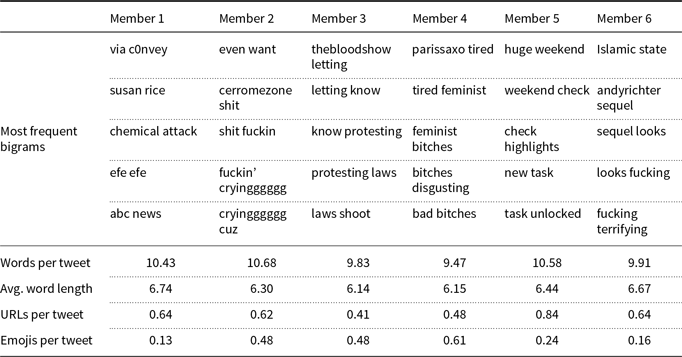
The results are given in Tables 8, 9, and 10 for the Topic, Influential, and GMM methods, respectively.
In terms of word n-grams, we observe that all methods have a variety of bigrams in ensemble members. In contrast to the analysis of the Davidson17 dataset, there are no significant overlapping bigrams in the ensemble members of the GMM method. Note that the GMM method performs better than the Topic and Influential methods in the Founta18 dataset, while it performs poorly in the Davidson17 dataset. This analysis supports the performance results and may suggest that the performance of the GMM method depends on the dataset.
Writing style analysis for the Influential method in the Founta18 dataset
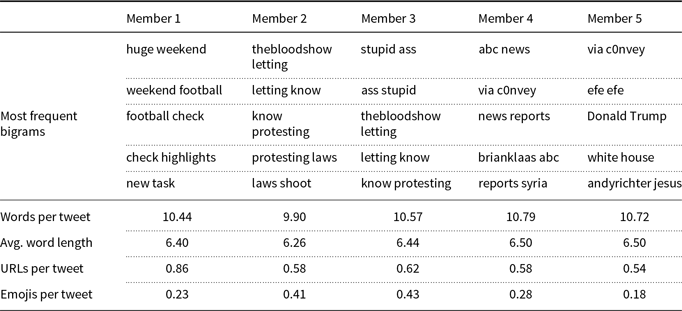
Writing style analysis for the GMM method in the Founta18 dataset
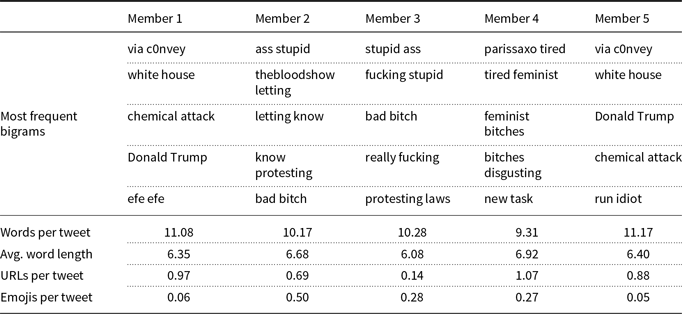
Another reason for the success of the GMM method could be the average statistics of writing style. Although the average statistics differ in all methods, the degree of this difference is larger in the GMM method, since the standard deviations of the average statistics are mostly higher in the GMM method. The standard deviations of the average number of words, word length, URLs, and emojis are 0.65, 0.20, 0.15, 0.18 in the Topic method; 0.31, 0.09, 0.11, 0.10 in the Influential method; and 0.68, 0.29, 0,33, and 0.17 in the GMM method, respectively.
In the Influential method, ensemble members are obtained by splitting the data according to the influential scores. The influential score decreases as the member number increases in this table. That is, the users in the data portion of the first ensemble member (i.e. Member 1 in the table) have a higher influential score compared to the influential scores of the last ensemble member. We observe that the average numbers of words and word length are longer in less influential groups. On the other hand, the average number of URLs and emojis is higher in the first member (more influential) compared to the last one (less influential).
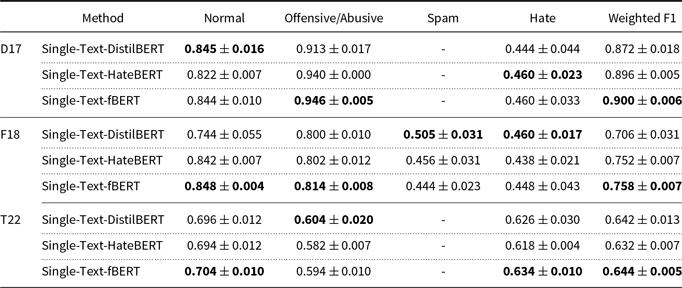
5.4 Selection of backbone model
HateBERT (Caselli et al. Reference Caselli, Basile, Mitrović and Granitzer2021) and fBERT (Sarkar et al. Reference Sarkar, Zampieri, Ranasinghe and Ororbia II2021) are two instances of Transformer-based models that are fine-tuned for hate speech detection. However, we use a smaller and faster model, DistilBERT (Sanh et al. Reference Sanh, Debut, Chaumond and Wolf2019), as a backbone model in our experiments, since the number of training models is very high due to ensemble learning and 5-fold splitting.
In Table 11, we validate our selection for the backbone model by comparing the performance of DistilBERT with those of fBERT and HateBERT. In this experiment, we use the Single-Text method to understand solely the performance of the backbone model rather than ensemble learning. The results show that DistilBERT has close performance (e.g. the Weighted F1 score in Toraman22) and sometimes better performance (e.g. the Hate class in Founta18) than HateBERT and fBERT, though DistilBERT is smaller in terms of the number of model parameters. We thereby argue that our selection of the backbone model does not have a significant impact on the model performance while comparing ensemble learning methods.
5.5 Limitations
We acknowledge a set of limitations to our study. Our experiments demonstrate ensemble learning for hate speech in the English, Turkish, and Italian languages. More experiments in different languages can be conducted to generalize the results to other languages. Similarly, different ensemble techniques can be employed to understand how they can capture different aspects of hate speech. In addition, there are other voting schemes in ensemble learning but we apply unweighted-average of softmax probabilities. For instance, one can use a dedicated weighting schema to give more importance to the predictions of particular ensemble members when test instances with the same style are processed.
Furthermore, we use a modified version of the datasets reported in the experiments. We observe that some of the performance scores are lower than those reported in the studies that use the whole dataset for experiments. For instance, Malik, Pang, and van den Hengel (Reference Malik, Pang and van den Hengel2022) achieve the weighted F1 scores of 0.91 and 0.79 using Transformer-based models for the Davidson17 and Founta18 datasets, respectively. The Single-Text method based on the DistilBERT architecture yields weighted F1 scores of 0.87 and 0.71, respectively for the datasets in this study. Also, Toraman et al. Reference Malik, Pang and van den Hengel(2022a) achieve the weighted scores of 0.83 and 0.78 for Toraman22-EN and TR, while we obtain the weighted F1 scores of 0.64 and 0.72, respectively. The reason for lower performance scores in our study is most probably related to the size of training data since we use a smaller part of these datasets after filtering the samples that do not include the topic keywords. In addition, ensemble learning is based on fine-tuning DistilBERT (Sanh et al. Reference Sanh, Debut, Chaumond and Wolf2019). One can further train other language models or feature extraction methods to encode text data before applying ensemble methods.
Comparison of Backbone Models. An average of 5-fold is reported in terms of the F1 score. The highest scores are given in bold. Davidson17, Founta18, and Toraman22-EN are shortened as D17, F18, and T22, respectively
6. Conclusion
We examine various ensemble learning techniques for hate speech detection. The motivation is to utilize multiple classifiers that reflect different aspects of hate speech. We conduct detailed experiments on five datasets covering multiple languages. Our experimental results, supported by statistical significance tests, show that the performance of hate speech detection is improved by capturing multiple aspects of hate speech in the majority of the datasets used in the experiments. We also provide a discussion on the number of ensemble members and writing styles exposed by different ensemble members.
In future work, we plan to generalize the experiments to other datasets and languages. Since cross-lingual transfer learning is a promising approach for hate speech detection (Bigoulaeva, Hangya, and Fraser Reference Bigoulaeva, Hangya and Fraser2021), one can further examine the opportunity for cross-lingual transfer learning with ensemble learning. We also plan to have a deeper analysis of ensemble members in order to understand how they reflect different aspects of hate speech. Alternative methods for capturing hate styles can also be studied, such as other user features rather than popularity for writing styles.
Acknowledgements
The work was partially done at Aselsan, Ankara, Turkey. We thank to Umitcan Sahin for providing the list of topic keywords used in Section 3.3.


 Open access