

Introduction
Gas-production-induced subsidence and seismicity from the large Groningen field have a large impact on the overlaying near-sea-level, relatively densely populated, northern province of Groningen in the Netherlands. Even in the absence of gas production, large parts of the province would be flooded without the protection of dikes and active pumping, a challenge increased by gas-production-induced subsidence and sea level rise from global warming. Given the absence of natural earthquakes, the (partly very fragile) build environment was never designed to withstand earthquakes. Meanwhile reliable subsidence and seismicity predictions have proven notoriously difficult to make (De Waal et al., Reference De Waal, Muntendam-Bos and Roest2015). Against that background, subsidence, induced seismicity and the resulting damage have caused public debate on the acceptability of the gas production. An improved legal and regulatory framework is needed to ensure responsible and socially acceptable production. Key questions are: how much subsidence and seismic risk can be expected, what is acceptable and how can it reliably and transparently be ensured that subsidence and seismic risk will stay within these limits?
The legal framework
A mining company must comply with many laws before it can produce natural gas. The most important are the Dutch Mining Act, the Dutch Nature Protection and Environmental Laws and the Dutch Spatial Planning Law. Under the Mining Act, companies involved in mining activities must submit a Production Plan which considers potential land subsidence issues (e.g. water management issues) and the risks from induced seismicity (including e.g. losses from building damage, building collapse, falling objects, damage to industrial installations, damage to infrastructure and the risk of casualties from all these). Approval by the minister of economic affairs is required. By Dutch law, operators are required to minimise all risks imposed by hydrocarbon extraction. The required risk management involves the identification, assessment and ranking of risks followed by coordinated and efficient application of resources to minimise and control the probability and/or impact of the undesired events (e.g. using the ‘bow-tie’ approach described later in this paper). The articles of the mining law correspond to the elements contained in this definition of risk management. From the regulator's perspective, the objective is to ensure the safety of people and the environment and to minimise damage. The regulator needs to establish that the operator is ‘in control’. Minimising the risk due to hydrocarbon-extraction-induced subsidence and seismicity is an integral part of this overall approach.
For subsidence the mining decree stipulates that the plan must contain (1) the extent of the predicted subsidence as a function of location and time, and (2) measures to limit subsidence and to prevent damage from subsidence. For seismicity it must contain (1) a seismic-risk assessment, (2) a description of the possible consequences, (3) a description of the measures taken to prevent and/or limit the occurrence of seismic ground motions and (4) the measures taken to mitigate the consequences of seismic ground motions if they occur.
Monitoring of subsidence and seismicity must be carried out in accordance with a separate Measurement Plan. This must be updated and submitted for reapproval annually. The Production Plan, other plans and licence conditions are made public as part of a legal consultation process. The legal framework enables authorities or judiciary to reject a Production Plan or a proposed production profile when the risk of damage from subsidence or seismicity is considered too large.
The regulatory framework ‘old style’
Subsidence
Already during the early stages of field development, it was realised that the gas production from Groningen could lead to a significant amount of reservoir compaction and surface subsidence. Detailed, well-documented rock-mechanical measurements and modelling studies were executed by the operator (NAM, 1973). In 1971 the application of these studies led to a deterministically predicted maximum subsidence of 100cm at the end of field life, then foreseen at around 2020. At the time, it was tacitly assumed (see e.g. Teeuw, Reference Teeuw1973; Mess, Reference Mess1978) that real numbers could be lower. An extensive monitoring network was installed. It involved a significant extension of the existing local geodetic surface network, monitoring of near-surface layer compaction unrelated to gas production (discontinued at a later stage) and several dedicated down-hole reservoir compaction monitoring wells with radioactive bullets shot into the formation. In 1983 an agreement and a fund were put in place to prevent, limit or remediate damage from gas-production-caused subsidence (for details see Commissie Bodemdaling, www.commissiebodemdaling.nl). Under the agreement, NAM must provide a reconciliation of subsidence measurements and predictions every five years. The latest of these was issued in 2015, based on measurements and modelling up to and including 2013. The maximum damage to be compensated under the agreement was increased to €855 million in 2015. Execution was put in the hands of an independent body, the Commissie Bodemdaling. As of 1 January 2016, €293 million of payments have been made, mostly related to water management issues (pumping stations, dykes etc.). Direct damage to individual buildings was not expected given the predicted gradual variation in subsidence over the field and its surroundings. Nevertheless, individuals can join the agreement. Citizens can also ask the Technical Committee on Soil Movement (Tcbb; www.tcbb.nl/) to advise on their damage claims.
Seismicity
Induced seismicity from gas production was initially not expected for Groningen. A study in 1990 estimated the chance of an induced event with a magnitude above 3.0 occurring in the Groningen field at less than 10% for the next 50 years (Toksöz & Walsh, Reference Toksöz and Walsh1990). If such an event were to occur at all, it was expected to happen on sealing faults at the field boundary, not in the centre of the field. Several seismic events had occurred near other fields, e.g. the Eleveld gas field. Then, a first earthquake with a magnitude of 2.4 was recorded in the Groningen field at Middelstum in 1991. It was followed by more events at a rate of some five to ten per year (Fig. 1). Initially doubts remained as to whether the observed seismicity was related to gas production (OVV, 2015). An official investigation in 1993 concluded that the two were linked for Eleveld while for other fields, including Groningen, it was considered a possibility (BOA, 1993).
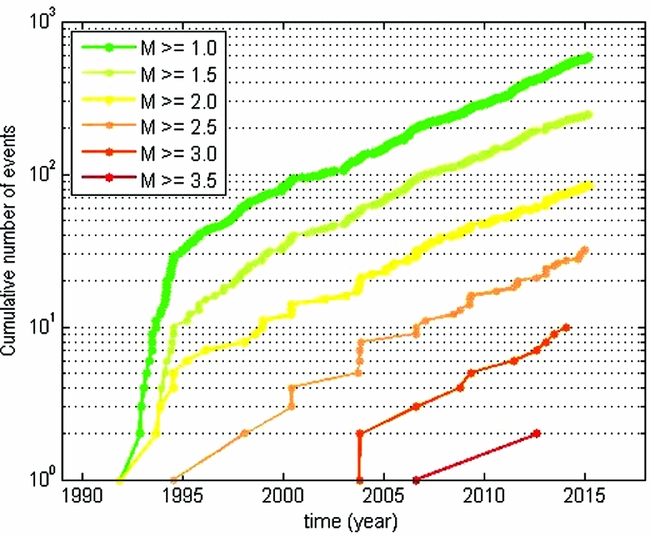
Fig. 1. Regulator analysis of the Groningen seismicity.
An important feature of induced seismicity is that, as for natural earthquakes, most damage and fatalities are associated with the rare large events, rather than the many small events (Taig, Reference Taig2012). The anticipated likely maximum magnitude in Groningen was, however, predicted not to exceed a magnitude above 3.3–3.5 (BOA, 1993; De Crook et al., Reference De Crook, Dost and Haak1995). The probability of its occurring was considered negligible. At those levels, studies concluded, structural damage to buildings and personal risks would not occur (BOA, 1993; De Lange et al., Reference De Lange, Van Oostrom, Dortland, Borsje and De Richemont2011). Based on these outcomes induced seismicity was long considered a nuisance, causing damage without posing a safety risk.
Production
During the early 1970s the Groningen field produced at high rates as it was anticipated that the value of the gas would soon be eroded by cheap nuclear power. When it was realised that this would not happen, the government changed the production philosophy drastically and Groningen became the regional swing producer. In addition, preference was given to production from smaller onshore and offshore fields, the development of which was stimulated by an offtake guarantee at market prices and caps on the maximum Groningen production (EZ, 2004; Mulder & Zwart, Reference Mulder and Zwart2006). This ‘small fields’ policy was so successful that the annual Groningen production dropped from values above 90 billion Nm3 in 1976 to as low as 21 billion Nm3 by 2000. Thereafter production from the ‘small fields’ started to decline, leading to increases in Groningen production, which reached a new annual high of 54 billion Nm3 in 2013. The technical capabilities of the installed infrastructure (wells, processing facilities, pipelines, storage facilities etc.) played a limited role given the very large gas production capacity initially installed. Risks from gas-production-induced subsidence and seismicity also did not play a role in setting Groningen production levels as their impact was deemed limited and manageable (OVV, 2015). Hence, production was considered a given by the regulator, with the amount and rate dictated by government policy and market conditions.
The regulatory approach for Groningen was therefore mainly to check production against government policy and to check measured subsidence and seismicity against their latest predictions. Support for such checks was (and is) provided by a dedicated advisory group at TNO (Geological Survey of the Netherlands) working exclusively for the government (TNO-AGE). Subsidence and seismicity were predicted by the operator using a single scenario with limited attention to uncertainties. Each time measurements started to deviate from the predictions, the operator was asked to provide an update. After the introduction of a new mining law in 2003 this automatically implied submitting an update of the Production Plan for approval. Independent of this, such an update had to be submitted for the Groningen field at least every five years.
Things not working as expected
Since the 1973 prediction of 100cm, the predicted maximum subsidence at the end of field life has fluctuated, with (sometimes large) changes each time new measurements or models became available (De Waal et al., Reference De Waal, Muntendam-Bos and Roest2015). The NAM-predicted maximum subsidence at the end of field life went to 77cm in 1973 and then to 30cm in 1977. In 1984 the prediction went up again to 65cm, down to 36cm in 1990 and then via 38cm (1995) and 42cm (2005) to 47cm in 2010, 49cm in 2013 and to 50–65cm in 2016 (NAM, https://www.sodm.nl/documenten).
For induced seismicity also, what happened was very different from the original expectations (Dost et al., Reference Dost, Ruigrok and Spetzler2017). It took many years before the causal relationship between seismicity and the gas production was widely accepted, illustrating the strength of paradigms. The first seismic event in the Groningen field was officially registered in 1991. Thereafter the number of observed events rose from 5 to 10 per year during the 1990s to well over 100 in 2013. The maximum observed magnitude also increased (Fig. 1). The figure suggests that smaller events probably started earlier without being detected, given the limitations of the seismic network (Dost et al., Reference Dost, Ruigrok and Spetzler2017) at the time.
The anticipated likely maximum magnitude gradually increased over time as new data became available. The 1993 BOA (Advisory Committee on Earthquake Investigation) study came to an initial estimated value of 2.9–3.3. KNMI (Royal Netherlands Meteorological Institute) later increased this estimate to 3.3–3.5 in 1995 (De Crook et al., Reference De Crook, Dost and Haak1995), to 3.7 in 1998 (De Crook et al., Reference De Crook, Dost and Haak1998) and then to 3.9 in 2006 (Van Eck et al., Reference Van Eck, Goutbeek, Haak and Dost2006). This corresponds to an almost 30-fold increase in released energy at the anticipated likely maximum magnitude. Since the initial seismic event in 1991, almost 1,000 events have been registered. Most events have been of a small magnitude (M L<1.5), while by mid-2016 some 270 earthquakes with magnitudes M L≥1.5 had been recorded. Of these, 10 events had a magnitude equal to or above 3.0, with 2 events equal to or above 3.5. Due to the soft Dutch soils (Kruiver et al., Reference Kruiver2017), events with magnitudes as low as 1.8 have reportedly been felt. Events with magnitude 2.0 and higher have caused minor to severe non-structural damage. Contrary to early expectations (Toksöz and Walsh, Reference Toksöz and Walsh1990), the tremors do not occur on the sealing faults at the field boundaries. They occur mainly in more central areas where cumulative compaction and the density of faults with unfavourable offsets are highest (Bourne et al., Reference Bourne, Oates, Van Elk and Doornhof2014).
The mechanism behind the earthquakes is now generally considered to be stress increases from depletion and (differential) compaction at reservoir level reactivating offset faults (Orlic & Wassing, Reference Orlic and Wassing2012; Bourne et al., Reference Bourne, Oates, Van Elk and Doornhof2014; NAM, https://www.sodm.nl/documenten) as originally proposed by Roest & Kuilman (Reference Roest and Kuilman1994). Hence, the occurrence of induced seismicity depends significantly on the geological characteristics of the subsurface: the stress regime in the region; the presence of faults; the orientation of the faults; the size of the faults; and on the development of the stresses with depletion and depletion rate. In hindsight, a trend break occurred in 2003 after which seismicity occurred at a much higher rate. It is now recognised that the effects of the induced seismicity in Groningen are enhanced by its shallow source, a partly very fragile build environment never designed to sustain seismic ground motions and soft near-surface layers locally leading to upswing of the ground motions (Kruiver et al., Reference Kruiver2017).
The magnitude 3.6 Huizinge event in August 2012 (Dost & Kraaijpoel, Reference Dost and Kraaijpoel2012) led to an unprecedented number of damage claims, involving thousands of homes. It was followed by an independent investigation by the regulator which showed that significantly stronger earthquakes, potentially with magnitudes up to 5.0, could not be excluded and that seismic risk levels in Groningen could be considerable (Muntendam-Bos & De Waal, Reference Muntendam-Bos and De Waal2013). The results were later confirmed in studies carried out by the operator (Bourne et al., Reference Bourne, Oates, Van Elk and Doornhof2014). The regulator analysis also suggested that increases and decreases in the annual number of seismic events could be linked to increases and decreases in the annual gas production rates, with a delay of 6–12 months (Fig. 2).

Fig. 2. Groningen annual production and seismicity (M≥1.0).
By that time the induced seismicity had caused increasing public concern related to, initially poorly recognised, non-structural building damage. This changed into anxiety after it became clear that higher-magnitude events, potentially causing building collapse and harm to people, could not be ruled out. Based on the results of its own independent investigation, the regulator judged the seismic risk in Groningen as ‘high’ from a safety point of view and in January 2013 advised that gas production be reduced by as much and as fast as realistically possible. The minister, taking a broader perspective, awaited the outcomes from a year of intense further studies, after which the first production measures were announced in January 2014 (De Waal et al., Reference De Waal, Muntendam-Bos and Roest2015).
Lessons learned
Important lessons can be learnt from the history of subsidence and induced seismicity in Groningen. It shows that uncertainties were largely underestimated at the start of production and for a long period thereafter. It is now realised that different models and parameters can be used to describe the subsidence and seismicity observed and that the choice of compaction and seismicity models and their parameters has a large impact on the calculated future subsidence (rates), seismic activity (rates) and on the predicted response to changes in gas production. The large changes over time in the predicted maximum subsidence suggest an initial uncertainty, prior to the start of production, of at least a factor of two (up or down). This has been confirmed for several other fields in the Netherlands (De Waal et al., Reference De Waal, Roest, Fokker, Kroon, Breunese, Muntendam-Bos, Oost and Van Wirdum2012). It can be caused by knowledge gaps, uncertainties in subsurface models, unknown influx of bottom and lateral aquifers, core damage, nonlinear rock compressibility, the difference in loading rate between laboratory and field, the very large change in loading rate at the start of production, the in situ stress state, reservoir burial history, salt flow, uncertainties in the relation between subsidence and compaction, etc. Meanwhile for Groningen, as for most Dutch gas fields, reservoir compaction and reservoir pressures are effectively only one-way coupled. There is usually limited influx from bottom and adjacent aquifers which further reduces uncertainties and allows for model simplifications. Reservoir pressures are well constrained, and extensive high-quality geodetic monitoring data are available. Predictions nevertheless remain uncertain as proven by history. This is quite sobering.
Studies carried out since 2013 (Bourne et al., Reference Bourne, Oates, Van Elk and Doornhof2014; NAM, https://www.sodm.nl/documenten) show that even larger uncertainties exist for predictions of induced seismicity. In addition, there are considerable uncertainties in the ground motions resulting from an earthquake of a given magnitude and in the expected response of buildings and infrastructure to those ground motions (NAM, 2016).
The regulatory framework ‘new style’
The now recognised large uncertainties have consequences for the regulatory framework. The traditional approach of only checking single-scenario operator-generated predictions against field measurements is too undemanding. The basis of regulatory control ‘new style’ is better risk identification and the development and execution of a well-organised risk management plan in interaction with a critical society and with clear objectives, well-defined risk norms and control measures with proven, or at least plausible, effectiveness.
A qualitative method to implement better identification, assessment and prioritisation of risks is the bow-tie methodology (Fig. 3, from SodM 2013). This methodology finds its origin in the petrochemical industry and in aviation. The method systematically and efficiently maps the risk of a possible incident by assessing the possible threats and consequences of an undesired event. In a risk matrix, the assessed risk to people, assets, environment and reputation can be classified (Fig. 4). In addition, it allows for the identification of feasible measures to minimise, monitor and control the risk. The first set of measures (in the bow-tie method called barriers) is always of a preventive nature, with the objective of preventing or stopping a potentially hazardous sequence of events. An example is a reduction in the rate of gas production in an effort to reduce the rate of subsidence and seismicity. The second set of barriers is there to mitigate the growth of a certain event into a major calamity. Examples are earthquake-prone building and the strengthening of existing dykes, buildings and infrastructure to minimise the potential consequences of an earthquake. Monitoring can provide early warnings enabling timely preventive action to be taken to limit the scale of the undesired effects. These elements constitute the foundation of the monitoring programme, as well as of the control system (Fig. 5, modified from De Waal et al, Reference De Waal, Roest, Fokker, Kroon, Breunese, Muntendam-Bos, Oost and Van Wirdum2012). This requires the installation of an adequate field-monitoring network to feed a control loop of interactive modelling, measurements and repeated recalibration, or even revision, of models. As soon as (one out of) a set of threshold monitoring values is reached, the measurement and control loop system triggers actions (e.g. further investigations and/or the implementation of production measures). In addition, notifications are issued in accordance with a communication protocol.

Fig. 3. Bow-tie analysis.

Fig. 4. Risk matrix.

Fig. 5. Measurement and control loop.
In support of such a measurement and control loop, the operator needs to provide a range of scenarios covering possible outcomes for subsidence, seismicity, damage, personal risk etc. In the scenarios, all combinations of credible models and parameter ranges need to be considered. The relative likelihood of each scenario can be determined e.g. using a Monte Carlo approach and by comparing the resulting predictions against the available (field) data. The uncertainty range can only be reduced when certain scenarios become too unlikely given new insights (closing knowledge gaps) or new field measurements (Nepveu et al., Reference Nepveu, Kroon and Fokker2010; De Waal et al., Reference De Waal, Roest, Fokker, Kroon, Breunese, Muntendam-Bos, Oost and Van Wirdum2012). It must be ensured that the range of possible outcomes, as it changes over time, remains in line with what the area concerned can sustain. This includes taking timely and appropriate mitigation measures when the probability of unacceptable scenarios becomes too large. Examples are adjustments in production (level and/or temporal and spatial distribution), water management measures (pumping stations, bridges and dykes) and the strengthening of existing buildings and infrastructure. The new approach requires that the regulator actively assures the integrated control loop of risk identification, prediction, monitoring, updating, mitigation measures and the closing of knowledge gaps, to ensure that subsidence (rate) and the frequency and ground motions of the induced seismicity remain within acceptable limits. The new approach is supported by changes in the mining law and requires appropriate conditions in the Production Plan assent.
Such a ‘new style’ regulatory approach, involving the concepts of ‘effective subsidence capacity’ and ‘hand on the tap’ production, was applied for the first time for the Wadden Sea (EZ, 2006; De Waal et al, Reference De Waal, Roest, Fokker, Kroon, Breunese, Muntendam-Bos, Oost and Van Wirdum2012) to keep subsidence (rate) within accepted limits. It can be extended to include induced seismicity. For Groningen, the regulator has requested the operator to develop a customised methodology for risk identification and quantification, a measurement and control loop, a risk management protocol and a communication protocol. Generalised versions can be used to improve the present industry guideline (TPB (Soil Movement Technology Platform), www.tcbb.nl/pdf/Leidraad%20Document_V1.pdf). The use of scenarios, probabilistic prediction methods and better methods to confront predictions against observations should also be considered in such an update. From each confrontation step, one will learn and improve models and thereby forecasting. This learning process is an essential part of the measuring and control loop, which is too often neglected.
The new approach is supported by significant changes in the Dutch mining law that became effective on 1 January 2017. Following the advice of the Dutch Safety Board in its report on the investigation of the Huizinge event (OVV, 2015), the new law places much more emphasis on safety and provides better assurance of regulator independence. This includes independent reporting, legal, communication and budget responsibilities for the regulator. It also includes budget to fund independent scientific research to address knowledge gaps on the short- and long-term effects of mining activities (KEM: Kennisprogramma Effecten Mijnbouw, or Knowledge Development Programme on the Effects of Mining). The new mining law gives the minister of economic affairs more grounds to refuse or withdraw licences and/or Production Plans. For the Groningen field the burden of proof for damage claims has been reversed. For new applications for gas extraction and for the modification of existing plans, public and other interested parties can respond to draft decisions. The ministry involves these reactions in the final decision and indicates what has been done with the responses. Under the new law, local authorities such as municipalities, provinces and water boards must be asked for advice on the submitted production plans. Mining companies must identify all safety risks for the environment and indicate how they will reduce their potential impact. Independent authorities, including experts working for the regulator, review this information.
Recent developments
From a physics point of view (Roest & Kuilman, Reference Roest and Kuilman1994; Zoback, Reference Zoback2007; Van Wees et al., Reference Van Wees, Buijze, Van Thienen-Visser and Fokker2014) production reduction measures should result in a reduction in the subsidence and seismicity rates. Implementing operational control measures is also the least invasive measure to minimise seismic risk (Häring et al., Reference Häring, Schanz, Ladner and Dyer2008; I. Wong et al., unpublished report, 2015). Based on these considerations and supported by early positive indications in the field, the Dutch minister of economic affairs has, on the advice of the regulator, gradually limited production offtake in the Groningen gas field in recent years.
Starting in January 2014, gas production was gradually reduced in five discrete steps until a reduction by more than 50% was achieved in 2016. Since 2015 virtually no gas is produced anymore from the production clusters in the centre of the field. At a later stage, studies initiated by the regulator (Pijpers, Reference Pijpers2014b, Reference Pijpers2016) suggested that production rate changes in themselves play a role in triggering the seismicity. This led to a production philosophy in which large summer–winter fluctuations in production rate are avoided as much as possible. As a result, these fluctuations have been much smaller since March 2015 (Fig. 6). The production measures taken have resulted in a clear change in the observed spatial pattern of the seismic events, with seismicity reducing significantly in the central area of the field after April 2014 (Muntendam-Bos et al., Reference Muntendam-Bos, Roest and de Waal2017).
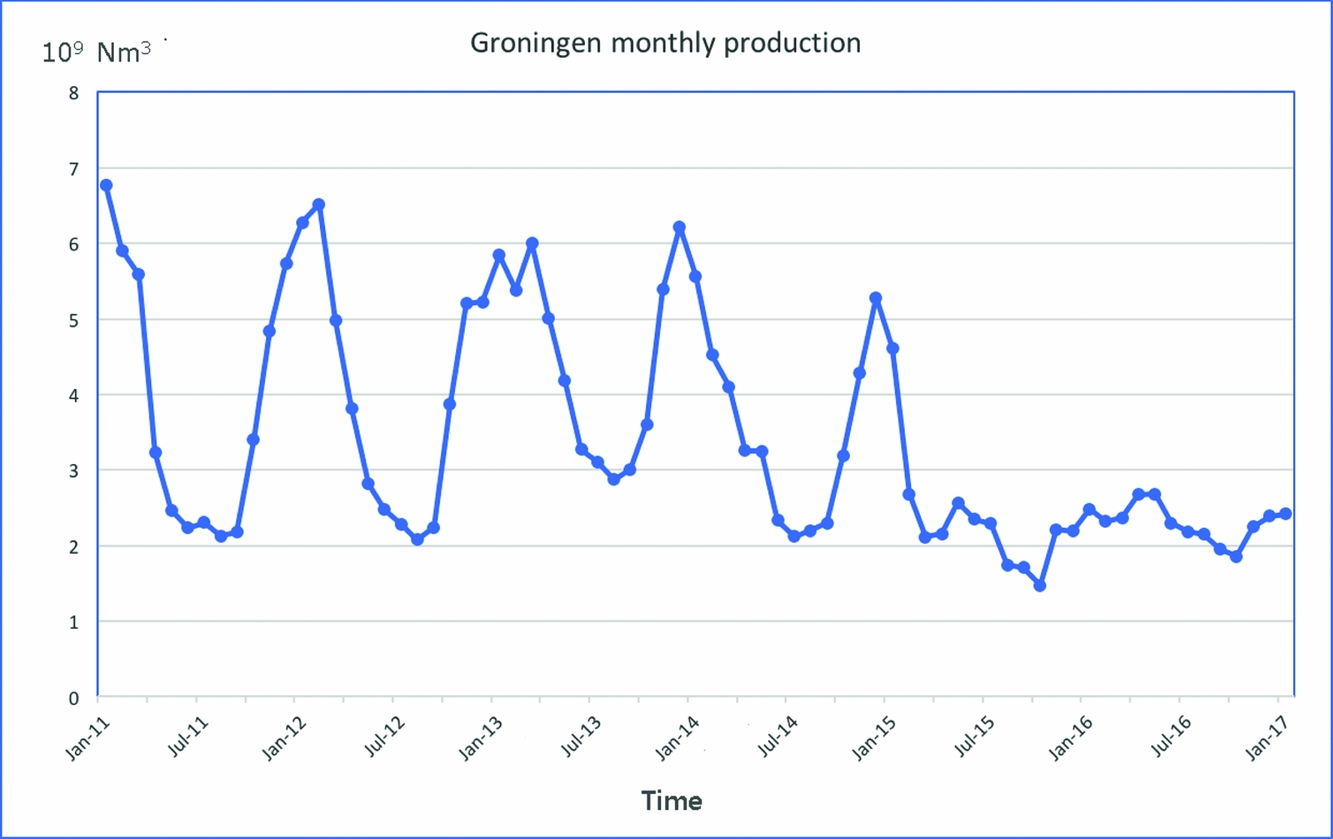
Fig. 6. Monthly production in the Groningen field.
To determine the resulting subsidence rate changes over relatively short periods from noisy GPS data, a novel method was developed by Statistics Netherlands (Pijpers, Reference Pijpers2014a). To study the effect on the seismicity, another novel method was developed to better address the statistical noise and the non-Poissonian character of the relatively short Groningen seismicity time series. It incorporates the modelling of the propagating pressure waves from production fluctuations at the wells into the reservoir, enabling the study of causal mechanisms (Pijpers, Reference Pijpers2014b, Reference Pijpers2016; TNO, 2015a,b).
Results demonstrate that the reduction in depletion rate since 2014 (due to production redistribution and caps) and the minimisation of seasonal swing in the annual production since March 2015 have significantly reduced subsidence and seismicity rates in the field. Early indications are that the reduction in the number of higher-magnitude events is larger than a linear relation to production predicts (Muntendam-Bos et al., Reference Muntendam-Bos, Roest and de Waal2017). Response time seems to be in the order of several months to a year. For the induced seismicity, a plausible causal mechanism linking it to the pressure fluctuations in the reservoir could be identified (Pijpers, Reference Pijpers2016). Support for the reduction in seismicity is also provided by the statistical analysis reported by Nepveu et al (Reference Nepveu, Van Thienen-Visser and Sijacic2016). To our knowledge this is the first time that operational controllability of gas-production-induced seismicity (at least in the short term) has been corroborated. This suggests that the system can be influenced with time constants in the order of several months to a year.
Acknowledgements
We thank the management of Staatstoezicht op de Mijnen permission to publish this paper. We also thank staff at TNO, KNMI, CBS (Statistics Netherlands) and NAM for stimulating discussions and support, although they may not agree with all the interpretations and conclusions of this paper. We are particularly grateful for the contributions and support provided by Karin van Thienen-Visser and Jaap Breunese at TNO and by Frank Pijpers at CBS.


 Open access