

Introduction
The Cenozoic geologic record of the North Sea Basin in the Netherlands has been given relatively little attention. The Palaeogene is characterised by many marine clay layers such as the Eocene Ieper and Asse Members, and the Oligocene Rupel Clay Member. The Neogene marine clay layers are part of the Breda and Oosterhout Formations (Van Adrichem Boogaert & Kouwe, Reference Van Adrichem Boogaert and Kouwe1993) (Fig. 1). For petroleum geological studies the Cenozoic sequence in the Netherlands is usually penetrated without taking high-quality logs or cores. The Neogene formations have been studied relatively more, because of their geohydrological importance as aquitards in shallow groundwater-flow systems. In the Palaeogene clay layers, data and information on penetrating oil and gas wells usually do not include high-quality logs or cores.

Fig. 1. Tectonostratigraphy of the Cenozoic, comparing Belgium, Germany and the Netherlands (modified after Knox et al., Reference Knox, Bosch, Rasmussen, Heilmann-Clausen, Hiss, De Lugt, Kasińksi, King, Köthe, Słodkowska, Standke, Vandenberghe, Doornenbal and Stevenson2010).
Of the Palaeogene clay layers, the Rupel Clay Member has received some attention because of its qualities as a potential host rock for disposal of radioactive waste. The Rupel Clay Member is part of the Rupel Formation (Van Adrichem Boogaert & Kouwe, Reference Van Adrichem Boogaert and Kouwe1993). Research programmes coordinated by TNO have studied the possibility of disposal of radioactive waste in clay layers in the Dutch subsurface. The first programme to encompass the Rupel Clay Member was the CORA research programme (Commissie Opberging Radioactief Afval, Committee on Disposal of Radioactive Waste, 1996–2001). This clay layer is present in the subsurface of nearly the complete onshore part of the Netherlands. Further, it is present in the shallow subsurface of Germany (e.g. Kleve–Düsseldorf region) and Belgium (e.g. Rupel–Antwerpen region) where it crops out along the southern fringes of its distribution (Fig. 2). In Zeeuws-Vlaanderen the Rupel Formation is located at shallow depths, and is covered with Quaternary deposits. In Belgium extensive research on the Rupel Clay Member – known there as the Boom Clay – has been going on for decades and an underground research laboratory in this layer is in use near the town of Mol (Van Doorn & Van Staalduinen, Reference Van Doorn, Van Staalduinen, Boekschoten, Dijkhuis, van Doorn, Doust, Minnigh, Reijers, De Ruiter, Van Veen, Van Loon and Floor2012).

Fig. 2. Location of the study area, topographic names and wells for grain-size analyses and the onshore distribution of the Rupel Clay Member in the Netherlands and Belgium. In Belgium the Rupel Clay Member locally crops out (De Craen et al., Reference De Craen, Beerten, Honty and Gedeon2012; Welkenhuysen et al., Reference Welkenhuysen, Vancampenhout and De Ceukelaire2012).
For studies related to disposal of radioactive waste in the Rupel Clay Member, up-to-date maps of distribution and thickness are essential. Despite the attention given to the Rupel Clay Member, the depth–thickness maps available up to now are based on the CAR Fase I report (Bremmer et al., Reference Bremmer, Simmelink, Heidema, Hoogendoorn and Pagnier1997), which merely digitised maps from an earlier Geological Survey (RGD) report (De Mulder et al., Reference De Mulder, Schokking and Van Rooijen1984).
During the last 30 years the amount of seismic and well data has grown and knowledge and technical possibilities have improved. We therefore present newly constructed depth–thickness maps of the Rupel Clay Member and a review of its depositional environment. Using seismically interpreted horizons, we constructed the regional-scale geometry (depth and thickness) of the Rupel Clay Member for the onshore part of the Netherlands. Using newly measured grain-size samples from 19 wells (Fig. 2) we discuss sedimentology and depositional environment.
Rupel Formation
This section provides general information on the Rupel Formation and is based in large part on the Stratigraphic Nomenclature of the Netherlands (Van Adrichem Boogaert & Kouwe, Reference Van Adrichem Boogaert and Kouwe1993).
Nomenclature
Both the formation and the Rupelian stage (~34–28 Ma) are named after the river Rupel in Belgium. The main part of the formation consists of heavy, dark brown-grey clays. Towards the base and top, the clays grade, rather abruptly, into sands along the southern basin margin. In the Netherlands the formation consists of three members from base to top (Fig. 1): Vessem Member, Rupel Clay Member and Steensel Member (Van Adrichem Boogaert & Kouwe, Reference Van Adrichem Boogaert and Kouwe1993; De Man et al., Reference De Man, Van Simaeys, Vandenberghe, Harris and Wampler2010). The Rupel Clay Member is more or less equivalent with the unofficial name Boom Clay. The Boom Formation of the Belgian nomenclature (Maréchal & Laga, Reference Maréchal and Laga1988; Vandenberghe & Wouters, Reference Vandenberghe and Wouters2011) is equivalent to the Dutch Rupel Clay Member of the Rupel Formation (Welkenhuysen & De Ceukelaire, Reference Welkenhuysen and De Ceukelaire2009). In Germany the equivalent is formed by the Ratingen and Lintfort Members (Fig. 1). In this study we will refer to the Rupel Clay Member as RCM.
Palaeogeography
The deposits of the Rupel Formation were formed in the southern part of the North Sea Basin of which the London–Brabant Massif (which includes the present-day Ardennes) was the southern limit (Fig. 3a). The coastline of the sea was oriented roughly east–west and located in middle Belgium. Towards the centre of the North Sea Basin the sea is said to have reached several hundreds of metres depth, although no data to prove this are provided (De Lang & Ebbing, Reference De Lang and Ebbing2003). Below we briefly describe the lower and upper members of the Dutch Rupel Formation. The intermediate Rupel Clay Member will then be discussed in detail.

Fig. 3. (A) Rupelian palaeogeography. (B) Chattian palaeogeography (modified after Knox et al., Reference Knox, Bosch, Rasmussen, Heilmann-Clausen, Hiss, De Lugt, Kasińksi, King, Köthe, Słodkowska, Standke, Vandenberghe, Doornenbal and Stevenson2010).
Vessem Member
The sand-dominated Vessem Member is found below the RCM (Fig. 2). It has a variable thickness and is present in nearly the whole onshore part of the Netherlands (Fig. 4a). In the southern part of the Netherlands, the Vessem Member roughly corresponds with the Belgian Bilzen Formation and the underlying Zelzate Formation (Maréchal & Laga, Reference Maréchal and Laga1988; Vandenberghe & Wouters, Reference Vandenberghe and Wouters2011; Vandenberghe et al., Reference Vandenberghe, De Craen and Wouters2014). In the eastern Netherlands it can be correlated with the Ratum Member of Van den Bosch et al. (Reference Van den Bosch, Cadée and Janssen1975).

Fig. 4. (A) Schematic subcrop map of the Rupel Clay Member, showing the deposits on which the base of the member rests. (B) Schematic supercrop map of the Rupel Clay Member, showing the deposits overlying the member.
The Vessem Member is a transgressive unit consisting of silty to clayey sands with a low glauconite content; flint pebbles or phosphorite nodules commonly occur at the base (Van Adrichem Boogaert & Kouwe, Reference Van Adrichem Boogaert and Kouwe1993). In Belgium phosphates occur at the base of the Boom Formation and are equivalent in time (NP22–NP23 boundary) with flint pebbles typically occurring at the base of the Berg Sand (Vandenberghe et al., Reference Vandenberghe, Herman and Steurbaut2002). This level is also time-equivalent with the base of the Belsele-Waas Member (base Boom Formation) in the Antwerp Campine area in Belgium. Calcareous fossils are generally absent. In a basinal setting the Vessem Member becomes more heterogeneous. In the Voorne Trough and the Zuiderzee Low and locally in the eastern part of the Netherlands, only the topmost part is a thin transgressive sand layer. There, the member consists largely of stacked units which locally coarsen upwards. The sands of these units have a relatively high glauconite content and do not contain pebbles. Autochthonous phosphorite nodules occur in some areas. The sands and the intercalated clays contain little to no calcium carbonate (Van Adrichem Boogaert & Kouwe, Reference Van Adrichem Boogaert and Kouwe1993).
In southern Limburg a lagoonal clay layer is enclosed in the sand (Kleine Spouwen Member). Basinward of this clay, the presence of a coastal barrier facies is inferred (Van Adrichem Boogaert & Kouwe, Reference Van Adrichem Boogaert and Kouwe1993). The coarsening-upward sequences below the main transgressive surface represent shallow-marine sands prograding onto middle- to outer-neritic clays. The base itself is presumed to be a transgressive, shallow-marine sand (Van Adrichem Boogaert & Kouwe, Reference Van Adrichem Boogaert and Kouwe1993).
Steensel Member
In the southeast of the Netherlands, near the southeastern margin of the basin, the RCM is conformably overlain by the sandy Steensel Member (Fig. 4b). Hence, its depositional environment was near-coastal (Van Adrichem Boogaert & Kouwe, Reference Van Adrichem Boogaert and Kouwe1993).
In the neighbouring countries sands occur in overall similar stratigraphic positions. In Belgium, the lithostratigraphic equivalent has been named Eigenbilzen Formation (Maréchal & Laga, Reference Maréchal and Laga1988). The Steensel Member consists of an alternation of clays and silty clays with thin sand layers, grading upwards into fine-grained sands with a high glauconite content.
Further north (basinward), the sandy Steensel Member is absent and the similarly sand-dominated Voort Member of the Veldhoven Formation overlies the RCM. In the rest of the onshore Netherlands the member is covered by the Veldhoven Clay Member or the Breda Formation, which is generally clay-dominated in the north and contains sandy intercalations in the south (Fig. 4b). Where Early Miocene erosion occurred, an unconformable contact exists with the overlying Breda Formation, which consists of glauconitic sands and clays.
Methods
Three maps of the RCM were constructed using Schlumberger Petrel 2013 software and the most recent publicly available data. The map-making procedure and the data used are described below. All grids have a resolution of 250 × 250 m.
Maps
In some regions the Veldhoven Formation and the Steensel Member lie between the base of the Breda Formation and the top of the RCM (Fig. 1). Because the Steensel Member is at most 28 m thick and only found in nine wells in the north of Limburg, no correction for this member was made.
The depth maps of the top and the base of the RCM are based on existing recently released depth horizons which are based on seismic interpretation (2-D and 3-D) and well data (TNO, Reference TNO2004; Kombrink et al., Reference Kombrink, Doornenbal, Duin, Den Dulk, Van Gessel, Ten Veen and Witmans2012). The seismically interpreted base grid of the nearly nationwide present Breda Formation (mapped as base Upper North Sea Group) forms the basis for the maps (Fig. 5). In parts of the country this formation directly overlies the RCM (Fig. 4b), and therefore in those regions the base of the Breda Formation equals the top of the RCM.

Fig. 5. Map-making procedure for the top and base of the Rupel Clay Member (in colour). See text for explanation.
The Veldhoven Formation is up to ~200 m thick and was encountered in 168 wells. The thickness is based on interpretation in wells as registered in the TNO-DINO database (www.nlog.nl). Since in these relatively shallow-lying deposits the wells are still oriented vertically, the along-hole thickness is assumed to be equal to the true-vertical thickness. For the construction of the top-RCM grid, the along-hole thickness of the Veldhoven Formation at well locations was subtracted from the base grid of the Breda Formation.
The base-RCM grid was constructed by subtracting its along-hole thickness in 498 wells (Vis & Verweij, Reference Vis and Verweij2014) from the above-described surface representing the top of the member (Fig. 5). For this, mainly oil and gas wells were used, because most groundwater wells do not penetrate the base of the member since it is buried too deep. On the southern and eastern fringes of its distribution (Zeeuws-Vlaanderen, Noord-Limburg and near Winterswijk), the member reaches depths shallow enough for groundwater wells to penetrate it. Here the detailed information from those wells was used to fine-tune the base of the grid in a later quality-control step.
The aforementioned procedure resulted in an initial version of the maps. Subsequently wells penetrating the top and/or base of the member were used to verify and correct the obtained top and base grids. The difference between the depth in the obtained grids and the depth in the wells is a measure for the reliability of the approach (residual). The well data were used to correct the grids, to make the grids fit the top and base of the RCM at well locations.
After the correction step, a dataset from a study of the stability of benchmarks roughly covering the province of Groningen in the northeast of the country was used to improve the depth of the top map (Duin, Reference Duin1995). In that study, Cenozoic strata were seismically interpreted using a 3-D regional seismic survey. The horizons were calibrated on data such as well logs, cuttings, and biostratigraphy. Because the Breda Formation directly overlies the RCM, we used the base-Breda Formation grid to update our top-RCM grid in that area. The thickness map was made by subtracting the grid of the base of the RCM from its top grid. This resulted in a grid showing the regional variation in thickness.
To get an impression of the fit of the Dutch grids with those in Belgium, we used the top and base of the Belgian Boom Formation (De Craen et al., Reference De Craen, Beerten, Honty and Gedeon2012; Welkenhuysen et al., Reference Welkenhuysen, Vancampenhout and De Ceukelaire2012). It should be noted that the top of the Rupel Clay Member is about equivalent to the top of the Boom Formation in Belgium. However, the base of the Rupel Clay Member lies lithostratigraphically higher than the base of the Belgian Boom Formation.
Map accuracy and quality control
The accuracy of the presented maps relies on the following items:
-
• regional seismic interpretation of the base of the Upper North Sea Group surface and faults using 2-D and 3-D seismic data;
-
• time-to-depth conversion;
-
• stratigraphic interpretation of wells from well logs, cuttings and cores:
-
○ interpretation of the base Upper North Sea Group;
-
○ interpretation of the Veldhoven Formation;
-
○ interpretation of the Rupel Clay Member.
-
The source map for the maps presented here is the regionally mapped base of the Breda Formation which equals the base Upper North Sea Group surface (Duin et al., Reference Duin, Doornenbal, Rijkers, Verbeek and Wong2006). This surface was mapped using mostly 2-D seismic lines; 3-D seismic surveys were at that time only available for the northeast of the country and for the West Netherlands Basin (Duin et al., Reference Duin, Doornenbal, Rijkers, Verbeek and Wong2006). The seismic interpretations were converted from the time domain to the depth domain using the VELMOD-1 velocity model (Van Dalfsen et al., Reference Van Dalfsen, Doornenbal, Dortland and Gunnink2006). The stratigraphic information on wells was used to constrain the seismic interpretation (Duin et al., Reference Duin, Doornenbal, Rijkers, Verbeek and Wong2006).
Well data (well tops) identifying the RCM have been used to adjust the calculated top (822 points) and base grids (1047 points). The number for the base is higher because all well tops marked as ‘base RCM’ were used. Where the RCM is overlain by various formations in the southwest and east of the Netherlands, only the ‘base Breda Formation’ well tops were used to indicate the top of the RCM. This was done for database technical reasons. The residual maps for top and base of the member show that the utilised methodology obtained reasonable results on a regional scale (Vis & Verweij, Reference Vis and Verweij2014). In most locations a correction of less than 20 m was needed, which is well within expected errors for regional-scale maps. Only at a few locations does the mismatch between the grid and the well data reach 200 m in depth. A mismatch of up to 200 m is large, and may result from incorrect stratigraphic interpretation in wells. These interpretations need to be reconsidered in a future study to improve the quality of the depth and thickness grids. Although the interpolation technique may also cause mismatches, they are expected to be of a magnitude of tens of metres at most.
The corrections made for the top-RCM grid occur distributed over the country. The residuals of the base of the member show most corrections in the southwest of the country (Vis & Verweij, Reference Vis and Verweij2014). This is due to the fact that the base of the Breda Formation (base Upper North Sea Group) is known to be inaccurate here due to absence of seismic data.
The seismic data quality did not allow accurate mapping of faults, especially in the provinces of Flevoland and Noord-Holland. Only 2-D seismic lines were present while the geologic structure here is complex with many small faults. Although the grids apparently show few faults here, it is to be expected that many more faults are present.
Another way to check the quality of the grids is by verifying whether the top and base of the RCM cross overlying and underlying stratigraphic horizons or the land surface. The top RCM grid intersects with the base of the overlying Breda Formation grid at some locations (Vis & Verweij, Reference Vis and Verweij2014). The base-RCM grid hardly intersects with the underlying base North Sea Super Group (Vis & Verweij, Reference Vis and Verweij2014), although that horizon usually lies several hundred metres deeper. Because of uncertainties in the base Breda Formation and base North Sea Super Group grids, we decided not to make corrections in the RCM grids. In some cases the top-RCM grid intersects with the land surface based on laser altimetry surface-elevation data (Actueel Hoogtebestand Nederland). Where the top-RCM grid occurred above the land surface, it was set equal to the land surface (Vis & Verweij, Reference Vis and Verweij2014).
The RCM thickness grid shows large areas with an unknown thickness or absence in the province of Zeeland because shallow wells have often not penetrated the base of the RCM. Interpolation of the base of the member is therefore not reliable, and subtracting base from top therefore results in an erroneously thin or absent sediment layer.
When comparing the Dutch and Belgian top and base grids, the differences between the top grids are smaller than those between the base grids across the border. This reflects differences in stratigraphic definitions, mapping and modelling on both sides of the border. The top of the RCM equals the top of the Boom Formation, so relatively smaller differences are expected. The base of the RCM lies lithostratigraphically shallower than the base of the Boom Formation. In other words, the base of the Boom Formation (Belsele-Waas Member) in Belgium is stratigraphically equivalent to the Vessem Member in the Netherlands, which underlies the RCM. Large mismatches occur towards the Roer Valley Graben, because the Belgian grids do not take the faults of the graben into account. To solve the observed mismatches, an integrated cross-border stratigraphy needs to be established.
Grain-size data
In total, 133 Rupel Clay Member samples were collected from 15 cores stored in the TNO core shed (Table 1). The cores were selected based on optimal geographical distribution and a depth of preferably more than 400 m. If available, samples were taken from wells where the RCM is thicker than 100 m. In that way information was acquired on the least-known sections of the RCM. Six samples were taken from three wells provided by COVRA. Another 14 fresh clay samples were taken from cuttings that were brought to the surface while drilling geothermal well CAL-GT-02. Further details on the samples are given in Koenen & Griffioen (Reference Koenen and Griffioen2016).
Table 1. Overview of along-hole depth (m) of selected samples and the represented core length per sample (m) resulting from lumping several samples to obtain sufficient material for analyses.

The samples collected from the core shed have been exposed to air during and after coring and during storage, probably leading to oxidation of pyrite and subsequent dissolution of calcium carbonate and growth of fungi and secondary minerals such as gypsum and jarosite (Koenen & Griffioen, Reference Koenen and Griffioen2016). As a result of potential (partial) pyrite oxidation, the measurements of pyrite content in the selected samples are not reliable and not used for this study. The sampled material represents varying core lengths because sometimes several samples had to be merged to obtain a sufficient quantity for analyses (Table 1).
Grain-size distributions were measured by Qmineral bvba in Belgium (www.qmineral.com). During sample preparation, constituents which possibly bind individual grains were removed by dissolving carbonate, Fe-oxides and hydroxides and organic compounds. Carbonates were removed using 1.5N HCl; iron was removed by reduction of Fe3+ using oxalic acid and an Al plate. Organic matter was removed using H2O2.
After the removal of cements, the samples were shaken overnight using a shaking table. After that, they were given an ultrasonic treatment for one minute. The samples were split in equally sized subsamples using a Rotary Cone Sample Divider.
Laser diffraction
One-fifth of a prepared sample was used for grain-size analyses using laser diffraction (low-angle laser light scattering, or LALLS). This sample was subdivided into ten equally sized samples using a Rotary Cone Sample Divider. Subdivision was necessary to be able to replicate measurements and to gradually increase the sample size to generate a suitable suspension for measurement. Samples were measured using a Malvern Mastersizer S Long Bed. At least two separate measurements were done, of which the average was calculated.
From sample 9 in well B58G0192 (287.8 m depth), only the fraction <2 mm was analysed because a large part of the sample consisted of flat flint stone pebbles. This interval is suggested to reflect a transgressive coastal environment, close to the base of the succession. It may be correlated with the base of the sands of the Belgian Berg Member in which such pebbles also occur (Vandenberghe et al., Reference Vandenberghe, Herman and Steurbaut2002).
Sedigraph
Three-fifths of a prepared sample was used for grain-size analyses using a Sedigraph (X-ray measurements). This method has been specifically developed for fine-grained clay-rich sediments and is usually not used for sandy sediments. For technical reasons, only grains smaller than 250 µm can be analysed using this instrument. The fraction smaller than 250 µm was centrifuged and dried. Afterwards, water was added to obtain a suspension with a suitable density. A peptiser (sodium triphosphate) was added to obtain a stable suspension. Subsequently the sample was shaken again during one night and analysed using a Micromeritics Sedigraph 5100.
Fraction larger than 250 µm
One-fifth of a sample was used to determine the fraction greater than 250 µm, which is not analysed using the Sedigraph. The sample was wet-sieved and both the fraction smaller than 250 µm and greater than 250 µm were weighed after drying. In this way the fraction larger than 250 µm was obtained.
Grain-size statistics
The EXCEL spreadsheet program GRADISTAT 8 was used to interpolate class boundaries between the raw data size intervals (Blott & Pye, Reference Blott and Pye2001). The program also outputs various grain-size statistics and textural descriptions.
Uncertainties
Grain-size data were measured using two different methods. This was done because the Sedigraph is dominantly used by SCK•CEN (nuclear research centre) in Belgium, while laser diffraction is the preferred method in the Netherlands. The two techniques were applied to allow (future) comparison of new and older measurements in both countries.
A comparison of the results for 11 samples from well B52E0114 shows strongly varying clay-percentages depending on measurement and analysis technique (Table 2). When analysed using laser diffraction, the samples have an average clay content of 13% (grain size <2 µm, according to GRADISTAT 8). However, Konert & Vandenberghe (Reference Konert and Vandenberghe1997) have shown that the plate shape of clay minerals may introduce an overestimation of their particle size in laser-diffraction measurements. This difference may be up to eight size-classes when compared with traditional pipette measurements. They propose to use the measured fraction smaller than 8 µm as representing the clay fraction, i.e. representing a grain size smaller than 2 µm. When this approach is used, the average clay content is 41% (according to GRADISTAT 8, not shown in Table 2); more than three times higher than the <2 µm fraction alone.
Table 2. Comparison of the grain-size measurement results for 11 samples from well B52E0114. Sample depth (m) is given in the first row. Shown are the raw data from laser diffraction and sedigraph. These are presented as 0–2 µm and 0–8 µm classes. The lower part of the table shows clay percentages after calculation with GRADISTAT software. These values compare relatively well with the raw data 0–2 µm class for the laser diffraction technique. See text for discussion.

The same samples from well B52E0114 measured using the Sedigraph method yield an average clay content of 19% (according to GRADISTAT 8), which is 1.5 times the value from the laser-diffraction method. When comparing the Sedigraph results with the laser-diffraction results corrected for the plate shape of the minerals, the clay percentage based on the Sedigraph is more than two times lower (41% vs 19%).
A study has shown that the relationships between pipette (like the Sedigraph) and laser-diffraction measurements are different for different types of sediment (Buurman et al., Reference Buurman, Pape, Reijneveld, De Jong and Van Gelder2001). For marine sediments they found a general underestimation of the fraction <50 µm measured using laser diffraction. They further state that it is better to use the two methods separately. It must be noted, however, that the number of measured classes in the fraction <2 µm in the current study using the Malvern laser-particle sizer equals 24, which is eight more than in Konert & Vandenberghe (Reference Konert and Vandenberghe1997). This gives more detail of the present results in the fraction <2 µm. For the most recent study comparing these methods, the reader is referred to Verweij et al. (Reference Verweij, Vis and Imberechts2016).
Any technique used to measure grain size is known to give a different result. In fact, true grain size does not exist. The combination of measurement technique and the fact that sediment particles rarely have an ideal spherical shape implies that there is always a degree of uncertainty or noise associated with grain-size measurements. In the present study we will use the laser-diffraction grain-size results without a correction for the plate shape of the clay minerals. Using the laser-diffraction data probably implies an underestimation of the clay content in the samples from the RCM.
Well-log correlation
To visualise vertical and lateral lithological trends in the RCM, well-log correlation panels were constructed using data from www.nlog.nl. These panels show gamma-ray (GR) values against depth. Higher GR values generally indicate more clay-rich deposits, while low values signify quartz-rich sands. Interpretation is hampered when sands contain glauconite, which increases GR values. For some wells a sonic log (DT) is shown, when no GR was available. By plotting grain-size data next to the well logs, the problems caused by glauconite are overcome.
Results
Regional-scale geometry
The regional-scale geometry of the RCM (Figs 6–9) clearly demonstrates its presence at shallow depths along the southwestern and eastern borders of the country. Away from these borders, towards the northwest, the layer is present at greater depths.

Fig. 6. The depth (in metres relative to m.s.l. = mean sea level ~NAP) of the top of the Rupel Clay Member. The Belgian data represent the Boom Formation (Welkenhuysen & De Ceukelaire, Reference Welkenhuysen and De Ceukelaire2009; De Craen et al., Reference De Craen, Beerten, Honty and Gedeon2012; Welkenhuysen et al., Reference Welkenhuysen, Vancampenhout and De Ceukelaire2012).

Fig. 7. The depth (in metres relative to m.s.l. = mean sea level ~NAP) of the base of the Rupel Clay Member. The Belgian data represent the Boom Formation (De Craen et al., Reference De Craen, Beerten, Honty and Gedeon2012; Welkenhuysen et al., Reference Welkenhuysen, Vancampenhout and De Ceukelaire2012).

Fig. 8. The difference between the latest version of the top of the Rupel Clay Member as published in the RGD report by De Mulder et al. (Reference De Mulder, Schokking and Van Rooijen1984) and the top of the member as published in the present study. Blue = new grid lies less deep than in De Mulder et al. (Reference De Mulder, Schokking and Van Rooijen1984); red = new grid lies deeper than in De Mulder et al. (Reference De Mulder, Schokking and Van Rooijen1984).

Top and base
In a large area in the southwest of the Netherlands, roughly encompassing the province of Zeeland and the west of the province of Noord-Brabant, the top of the RCM is located at depths shallower than −400 m m.s.l. (Fig. 6). The same is valid for the east of the country where the top of the clay member lies at depths shallower than −400 m m.s.l.
There are two zones with a burial depth of the top of the clay member below −800 m m.s.l. These are the Roer Valley Graben and the Zuiderzee Low, which are known subsiding Cenozoic structural elements (Duin et al., Reference Duin, Doornenbal, Rijkers, Verbeek and Wong2006). In the Roer Valley Graben the deepest point of the base of the RCM lies around −1600 m m.s.l.; in the Zuiderzee Low this is about −1200 m m.s.l. (Fig. 7).
Difference with previous CORA study
We compared the top-RCM grid with the previously published depth map resulting from the CORA study (based on De Mulder et al., Reference De Mulder, Schokking and Van Rooijen1984). The map showing the difference in depth obtained by the two studies shows where positive and negative deviations occur (Fig. 8). Large negative differences occur in the south of Limburg, because De Mulder et al. (Reference De Mulder, Schokking and Van Rooijen1984) did not map that region. Large negative and positive deviations occur along the major bounding faults of the Roer Valley Graben, which can be ascribed to the greater detail in the present study inherited from the base Breda Formation grid. The relatively large deviations south of Leiden and west of Amsterdam result from the fact that these areas were labelled as uncertain by De Mulder et al. (Reference De Mulder, Schokking and Van Rooijen1984) due to data limitations. Smaller differences generally result from newly available well data in the present study. Although the new top map shows greater detail and incorporates more data than the map by De Mulder et al. (Reference De Mulder, Schokking and Van Rooijen1984), it should only be used for regional large-scale purposes.
Thickness
The RCM is thickest (>100 m) in three zones: Roer Valley Graben, Zuiderzee Low and the southern part of the West Netherlands Basin (Fig. 9). In the north of the province of Friesland the map shows a locally >100 m thick RCM, which is probably due to an incorrect stratigraphic interpretation of well HTM-01 in the TNO database; the RCM in this area is probably thinner than 100 m. Outside these areas, there are four zones where the thickness is limited to less than ~25 m or where the RCM is possibly absent: the north of the West Netherlands Basin, the province of Zeeland (Fig. 10), the eastern part of the province of Drenthe and the northeast of the province of Overijssel. These zones are indicated as thickness uncertain.

Fig. 10. Schematised cross-section in the south of the province of Zeeland showing the tilted Rupel Formation as a result of uplift of the London–Brabant Massif. Note the erosion of the Rupel Formation. Wells B54F0093 and B55A0364 have been used for biostratigraphic studies (see text). Constructed by A. Menkovic, TNO.
Sedimentology
This section focuses on the onshore Rupel Clay Member in the onshore Netherlands, unless otherwise stated. At present, limited grain-size data are available. Because of a lack of good-quality samples, no wells penetrating the RCM in the Roer Valley Graben in Noord-Brabant and Limburg could be analysed for grain size. The sampled wells are all located on the structurally higher horst blocks on both sides of the graben, where the RCM occurs at relatively shallow depth (<−400 m m.s.l.). A well correlation in the south of the country (Fig. 11) shows that wells B50H0373 and B48G0159 have a slightly larger D50 grain size within the RCM towards top and base. Well B58G0192 contains the coarsest deposits, with D50 grain-size values reaching up to 166 µm.
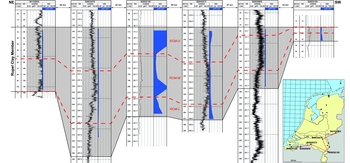
Fig. 11. Correlation between wells with the Rupel Clay Member sampled for grain size in the south of the Netherlands. Well B58G0192 shows coarser-grained intervals towards top and base. Note the absence of the RCM-L subunit near Winterswijk (B41G0024), which is corroborated by local observations (Buurman, Reference Buurman1972; Van den Bosch, Reference Van den Bosch1966, Reference Van den Bosch1967, Reference Van den Bosch1969).
Wells in the southwest (B41G0024 and B46C0478) show an average D50 grain size which is similar to that of wells in the north (see below). In the eastern part of the Zuiderzee Low, underneath the Veluwe area no wells were available for grain-size sampling.
A well-correlation panel along the sampled wells in the north of the country (Fig. 12) shows that only in well GRD-01 is the RCM relatively thick (~125 m). The median grain size (D50) in this well shows low values between 8 and 10 µm, justifying the name of a medium silt. Grain-size measurements show hardly any or no coarsening towards the top and base of the member. Due to the absence of a GR log, a well-log correlation with nearby wells was not made.

Fig. 12. Correlation between wells with the Rupel Clay Member sampled for grain size in the north of the Netherlands. A slight grain-size increase towards top and base can be discerned.
We do not have data on pyrite and calcareous septaria. However, studies in Belgium have found that the complete RCM is rich in pyrite and contains layers of early-diagenetic calcareous septaria which generally measure 0.3–1 m in width and 0.1–0.2 m in thickness (Van Adrichem Boogaert & Kouwe, Reference Van Adrichem Boogaert and Kouwe1993; De Craen et al., Reference De Craen, Swennen and Keppens1999). More than 18 horizons characterised by the presence of septarian carbonate concretions have been identified in Belgium (Gaemers, 1993; Mertens & Wouters, 2003; Vandenberghe & Wouters, Reference Vandenberghe and Wouters2011). In the Winterswijk area a study of the Brinkheurne Formation, which is equivalent to the Rupel Clay Member, shows the presence of calcareous septaria in the Netherlands (Van den Bosch et al., Reference Van den Bosch, Cadée and Janssen1975). Ten distinct layers were identified, but no correlation has been found with reported carbonate-free or carbonate-rich levels. Also in the south of the Netherlands, the presence of calcareous septaria is reported (De Mulder et al., Reference De Mulder, Schokking and Van Rooijen1984). For a large part of the Dutch subsurface, no evidence of the presence of carbonate septaria has been registered in borehole reports and descriptions.
Summarising, the RCM is generally finer-grained in the north and coarser-grained in the south and east. Vertically, the member can be divided into three subunits, based mainly on grain-size characteristics. In this section we present the available data on the three RCM subunits and provide an overview of their sedimentary characteristics.
Lower Rupel Clay Member (RCM-L)
The thickness of the RCM-L reaches 25–50 m along hole, of which the thickest occurrences are found in the east of the Netherlands. The lower RCM subunit consists of relatively coarse-grained sediment with a blue-grey colour (Van Adrichem Boogaert & Kouwe, Reference Van Adrichem Boogaert and Kouwe1993). The median grain size varies from coarse silt (~18 µm) in the south, to fine sand (~150 µm) in the east of the Netherlands (Fig. 13). In the north this subunit is much less pronounced. It has been identified only in well NNE-07 where it has a maximum median grain size of coarse silt (~30 µm). A fining upward trend can be observed within this subunit.

Fig. 13. Grain-size distributions of all 19 analysed wells including sample depths. The regional location of the wells is indicated, from which it is seen that the wells in the north mostly exhibit a unimodal grain-size distribution, as opposed to the southern and eastern wells which exhibit a bimodal distribution. Note the ‘clean’ appearance of the grain-size distribution of the freshly sampled CAL-GT-02 well.
On GR logs the subunit stands out as an interval with lower values (~30–90 API, open hole logging) than the overlying middle RCM, and slightly higher values than in the underlying sandy Vessem Member. In the northern well-correlation panel this is difficult to discern (Fig. 12). The Ca content is generally low (<4 wt%) in the measured samples, with occasional local Ca-peaks up to 10 wt%.
The relatively coarse-grained deposits in a generally fining-upward sequence, which become less pronounced towards the north (i.e. basinward), suggest a transgressive marine depositional environment which is relatively close to the basin margin, especially in the east of the Netherlands.
Middle Rupel Clay Member (RCM-M)
The subunit reaches a thickness of 40–90 m along hole (e.g. well B46C0478). The middle RCM subunit is the finest-grained, most clay-rich part of the member. Grain-size measurements show that the clay content of most samples is relatively low (<26%, when using laser-diffraction data < µm). This implies that in terms of sediment texture most samples do not classify as a clay, but rather as a fine to coarse silt.
This subunit is characterised by intercalated bituminous bands as identified in well Grashoek-01 west of Venlo. The colours range from dark green-grey, dark-brown to black (Van Adrichem Boogaert & Kouwe, Reference Van Adrichem Boogaert and Kouwe1993). In the east of the Netherlands the grain size is most variable and coarsest, with median values ranging between medium silt and fine sand (~8–130 µm; Fig. 13). In the south and north, the grain size is markedly finer and less variable, with a median grain size of medium silt (~6–12 µm). The measured clay percentage mostly does not exceed 10%; only on rare occasions are values up to 25% reached (well B52E0114). The RCM-M can be identified on GR logs as the interval with highest values (~90–>150 API, open hole logging). These high values can be explained by: (1) a high clay content and (2) a higher organic-matter content as already discussed by others (Grimm & Steurbaut, Reference Grimm and Steurbaut2001; Vandenberghe et al., Reference Vandenberghe, Hager, Van den Bosch, Verstraelen, Leroi, Steurbaut, Prüfert, Laga and Vandenberghe2001). Organic carbon content was measured on the grain-size samples (Koenen & Griffioen, Reference Koenen and Griffioen2016). These measurements suggest some correlation between higher GR values, higher clay content and higher organic carbon content for samples from the south of the Netherlands (wells in Fig. 11). In the north of the country this correlation is much weaker, except for well NNE-07(wells in Fig. 12). The high clay-content in the RCM-M interval generally shows up clearly in seismics.
Although trends in geochemistry are difficult to discern in our relatively small dataset, the RCM-M generally has lowest Ca values of the complete member (<2 wt%) with rare Ca-peaks.
Based on the fine-grained nature of the RCM-M in combination with bituminous bands (Van Adrichem Boogaert & Kouwe, Reference Van Adrichem Boogaert and Kouwe1993), we interpret the sediments of this interval to be deposited in a fully marine environment with water depths in the range ~50–200 m.
Upper Rupel Clay Member (RCM-U)
This subunit has a thickness of 15–40 m along hole, with the thickest occurrences in wells in the south and east. It shows an upward increasing grain size. The deposits are green-grey to green with a slightly marly character (Van Adrichem Boogaert & Kouwe, Reference Van Adrichem Boogaert and Kouwe1993). In the north and south, median grain size coarsens slightly up to medium silt (~10–20 µm; Fig. 13). In the east the strongest coarsening is observed. The median grain size of the sediment varies here between coarse silt and fine sand (~20–165 µm). The most pronounced coarsening occurs in well B58G0192 between 190 and 170 m along hole.
The GR signal of this interval shows steadily decreasing values, corroborating the increasing grain size with a lower clay content. Gamma-ray values range between 60 and 120 API (open hole logging). In most analysed wells the Ca content increases in the RCM-U to reach values higher than in the lower two subunits (~14 wt%).
This relatively fine-grained but coarsening-upward subunit is interpreted to be deposited in a shallowing marine environment, reflecting regressive circumstances. Coarsest-grained sediments were encountered in well B58G0192, which is located at the most proximal location, near a palaeo-coastline and/or river mouth (Fig. 3b).
Discussion
Data quality and availability
The presented maps rely on stratigraphic interpretation of the RCM in wells. The dataset of Mining Law-related wells (www.nlog.nl) consists of nearly 3500 onshore wells. In an estimated 20% of these wells the stratigraphic interpretation of the Rupel Formation has been properly quality-controlled during the 1980s. Since then about 20% has been quality-controlled for mapping purposes. The remainder of the onshore wells have stratigraphic interpretations which were taken directly from the composite well logs as supplied by the owners of the wells; i.e. without quality control.
Since the 1980s, litho- and chronostratigraphic insights have changed. Further, it is clear that the Dutch stratigraphic nomenclature is not always a good match for the nomenclature in Belgium and Germany for the investigated time interval. Future studies should pay close attention to these topics in order to improve the quality of produced maps.
In the Roer Valley Graben the top of the RCM is located between −400 and −1500 m m.s.l. and penetrated by 18 wells. Of these wells, 15 have encountered a thickness of at least 100 m. Well AST-GT-02 was drilled in 1986 for research purposes, but the sample quality was insufficient for it to be incorporated in this study. None of the wells sampled for grain size is located in the Roer Valley Graben. Based on nearby wells, palaeogeography (Fig. 3a) and our own grain-size data, we expect the most fine-grained low-energy facies to be found towards the northwest, while coarser-grained coastal sand facies are expected near the borders with Belgium and Germany, as corroborated by well B58G0192 (Fig. 11).
The RCM in the Roer Valley Graben is cut by several larger faults (Fig. 14). The faults have created offsets of the clay layer in the order of tens to hundreds of metres, creating compartmentalisation and fragmentation. Our thickness map does not show this compartmentalisation due to the adopted methodology. Besides the known faults, more faults are likely to be present which have not been identified, either due to the limited availability of seismic data or because they are below the seismic resolution.

Fig. 14. Cross-section through the 3-D layer model which forms the basis of the presented grids. The cross-section clearly shows the variable depth of the Rupel Clay Member through the Netherlands. The absence of faults in the Zuiderzee Low area reflects the lack of data there.
In the Zuiderzee Low the RCM is located between −400 and −1200 m m.s.l. (Fig. 6). Four wells have penetrated the clay member in this area. No wells were sampled for grain size in this area due to a lack of wells in general and a limited availability and quality of samples. Several faults have been mapped in the Zuiderzee Low; however, they have not been mapped in Cenozoic sediments (Fig. 6). No 3-D seismic data cover this area, hampering a more detailed analysis. The fact that some faults have been mapped in the Zuiderzee Low suggests that the RCM may be offset by several more faults. Because the Zuiderzee Low is more a depression than a graben, the fault offsets are expected to be less pronounced than in the Roer Valley Graben. This may be why they have not been identified so far.
In the north of the Netherlands the top of the RCM lies between −400 and −850 m m.s.l. Near the island of Ameland a salt dome has lifted the RCM to depths around −250 m m.s.l. (Fig. 6). In this region, six wells had sufficiently good material to be sampled for grain-size analyses.
Faults have been mapped in the north of the country, but most of them have not been mapped through the RCM (Fig. 6). The RCM is nonetheless expected to be cut by several faults which are known to penetrate far up into the Cenozoic sequence. Presently the area is covered by 3-D seismic data, and a new mapping campaign is underway at TNO and due to be finished in the coming years. These new data will allow more accurate and detailed analyses of the depth of the RCM and the presence of faults.
Depositional environment and sedimentology
Early Rupelian
The oldest Rupelian deposits in Belgium were deposited in relatively warm water (NP-21, Fig. 15), just before the globally recognised Oi-1 cooling event (~33.5 Ma; Miller et al., Reference Miller, Wright and Fairbanks1991). This event represents the largest Cenozoic shift in benthic δ18O and is thought to be an Antarctic glaciation event, without a concomitant Arctic glaciation (Lear et al., Reference Lear, Elderfield and Wilson2000; Abels et al., Reference Abels, van Simaeys, Hilgen, De Man and Vandenberghe2006; DeConto et al., Reference DeConto, Pollard, Wilson, Pälike, Lear and Pagani2008). Essentially this event represents a major climate change from a greenhouse world during the preceding Eocene to a glaciated world during the Oligocene (Lear et al., Reference Lear, Elderfield and Wilson2000; Abels et al., Reference Abels, van Simaeys, Hilgen, De Man and Vandenberghe2006). The glaciated world and Antarctic ice growth resulted in a decreased global ocean-water volume and a global sea-level drop of ~105 m (Lear et al., Reference Lear, Elderfield and Wilson2000; Katz et al., Reference Katz, Miller, Wright, Wade, Browning, Cramer and Rosenthal2008). In the Netherlands no measurements of benthic δ18O from the Eocene–Oligocene are available (A.J.B. Houben, pers. comm., 2014).

Fig. 15. Standard chronostratigraphy, calcareous nannofossil zones, global sedimentary sequences (Gradstein et al., Reference Gradstein, Ogg, Schmitz and Ogg2012), phanerozoic sea level (Hardenbol et al., Reference Hardenbol, Thierry, Farley, Jacquin, Graciansky, Vail, Graciansky, Hardenbol, Jacquin and Vail1998; Haq & Al-Qahtani, Reference Haq and Al-Qahtani2005; Haq & Shutter, Reference Haq and Shutter2008) and marine δ18O (Gradstein et al., Reference Gradstein, Ogg, Schmitz and Ogg2012). Tectonic phase, relative accommodation space and Dutch Rupelian lithostratigraphy are based on this study. Belgian lithostratigraphy is from http://ncs.drupalgardens.com and Vandenberghe et al. (Reference Vandenberghe, De Craen and Wouters2014).
The warm phase during the Early Rupelian (NP-21) has been biostratigraphically identified in deposits from the Oligocene in the southwest of the Netherlands (e.g. in wells B48H0328, B55A0364, B54F0093 and B48E0224; (Munsterman, Reference Munsterman2003, Reference Munsterman2007)). The warm-phase samples taken near the Eocene–Oligocene transition in well B48H0328 (transition between dinocyst zones NSO-1/NSO-2, equivalent to calcareous nanno biozones NP-21/NP-22) show clear indicators of erosion of the uplifted hinterland, as indicated by reworked dinocysts from the Carboniferous, Jurassic and Cretaceous (Munsterman, Reference Munsterman2007). The warm-phase deposits were also found in the Roer Valley Graben at −1550 m along hole in well SMG-01 (Munsterman, Reference Munsterman1998) and on the northern end of the Dutch continental shelf in well A17-01 at −1180 m along hole (Munsterman, Reference Munsterman2008).
The Early Oligocene is also marked by an unconformity, which can be identified in southern onshore areas and in adjacent offshore inversion zones (Knox et al., Reference Knox, Bosch, Rasmussen, Heilmann-Clausen, Hiss, De Lugt, Kasińksi, King, Köthe, Słodkowska, Standke, Vandenberghe, Doornenbal and Stevenson2010). The unconformity is considered to be the result of uplift and inversion resulting from the Pyrenean tectonic phase. At the beginning of this phase, the hinterland was uplifted and Carboniferous and Mesozoic deposits were eroded and transported northward where the Rupelian sea was still present. Because of this, Carboniferous and Mesozoic dinocysts are found in sediments of Priabonian age below the unconformity in well 48H0328 (Munsterman, Reference Munsterman2007).
De Man et al. (Reference De Man, Ivany and Vandenberghe2004) have estimated that the major sea-level fall resulting from the Oi-1 cooling event occurred about 1 Myr after the Pyrenean tectonic phase ended (Fig. 15). The major sea-level fall associated with the cooling event ultimately caused exposure and erosion of Early Oligocene warm-phase sediments and possibly generated another unconformity. This unconformity has not been identified in the Netherlands so far. In the offshore well A17-01 in the north of the Dutch continental shelf, the presence of dinocyst zone NSO-1 (equivalent to calcareous nanno biozone NP-21) indicates the preservation of warm-phase sediments. Along the Dutch–Belgian border, warm-phase sediments are probably present, as indicated by the presence of the Tongeren and Zelzate Formations from that time and the interpretation of zone NP-21 in various boreholes. The unconformity appears not to have completely eroded the proximal Eocene–Oligocene transition deposits along the margin of the North Sea Basin (southern Netherlands and Belgium).
The Eocene–Oligocene transition was also characterised by a change of the main progradational direction of systems feeding into the central North Sea Basin from eastward to principally westward due to uplift of the Fennoscandian Platform and development of drainage systems from that direction (Knox et al., Reference Knox, Bosch, Rasmussen, Heilmann-Clausen, Hiss, De Lugt, Kasińksi, King, Köthe, Słodkowska, Standke, Vandenberghe, Doornenbal and Stevenson2010). The uplift caused southward deltaic progradation into the eastern North Sea Basin. The impact of this on Rupelian deposition in the Dutch onshore part of the North Sea Basin has yet to be established.
In the Netherlands the sediments deposited during the Early Rupelian can be correlated with the lithostratigraphic Vessem Member. This mainly sandy unit is interpreted over most of the Netherlands as a transgressive shallow-marine sand.
In this study we identified the RCM-L as a relatively coarse-grained deposit in a generally fining-upward sequence which becomes less pronounced towards the north (i.e. basinward). The RCM-L was formed about 1 Myr after the Oi-1 cooling event. The nature of the RCM-L subunit suggests a transgressive marine depositional environment which is relatively close to the basin margin, especially in the east of the Netherlands. This fits well with a transition from proximal to more distal conditions due to the transgression following the Oi-1 cooling event. Although we do not have biostratigraphic age constraints, the RCM-L subunit seems to correspond with the Terhagen Member in Belgium and was deposited during times of increasing accommodation space. Therefore we assume the subunit to have an age of 32–31.6 Ma (Fig. 15; Van Simaeys, Reference Van Simaeys2004b).
Middle Rupelian
The Middle Rupelian period was characterised by continued eustatic sea-level rise. This resulted in a major transgression and maximum flooding of the Rupelian sea over its margins and creation of increased accommodation space. Following the onset of northeast Atlantic sea-floor spreading between Greenland and Scotland (Knox et al., Reference Knox, Bosch, Rasmussen, Heilmann-Clausen, Hiss, De Lugt, Kasińksi, King, Köthe, Słodkowska, Standke, Vandenberghe, Doornenbal and Stevenson2010), the North Sea Basin was characterised by thermal sag and regional subsidence (De Lugt et al., Reference De Lugt, Van Wees and Wong2003; De Lugt, Reference De Lugt2007). The amount of subsidence during the Rupelian is not easy to quantify, due to the combination with eustatic sea-level rise. According to Knox et al. (Reference Knox, Bosch, Rasmussen, Heilmann-Clausen, Hiss, De Lugt, Kasińksi, King, Köthe, Słodkowska, Standke, Vandenberghe, Doornenbal and Stevenson2010), most of the areas which were inverted during the Pyrenean phase in the West and Central Netherlands Basins were subject to erosion during the Oligocene. Nonetheless, some Rupelian sediments have been preserved in those areas. Eustatic sea-level rise reached a maximum around 32.8 Ma, after which only relatively small fluctuations occurred (Fig. 15). The Rupelian sea reached far into Belgium as a result of the transgression, which caused a progressively more distal depositional environment, with fine-grained sediments (Fig. 3a).
The sediments of the fine-grained, sometimes bituminous RCM-M subunit are interpreted to be deposited in a fully marine environment. This fits well with a period of maximum flooding of the Dutch onshore area. In the RCM in Belgium (Boom Clay), lithological alternations between silt and clay which can be regionally correlated have been identified. The metre-scale sequences reflect sea-level fluctuations which affect local water depth and wave base, resulting in changing sorting intensities and lithological variation (Vandenberghe, Reference Vandenberghe1978; Van Echelpoel & Weedon, Reference Van Echelpoel and Weedon1990; Vandenberghe et al., Reference Vandenberghe, Laenen, Van Echelpoel and Lagrou1997, Reference Vandenberghe, Hager, Van den Bosch, Verstraelen, Leroi, Steurbaut, Prüfert, Laga and Vandenberghe2001). The rhythmic lithological variations are considered to reflect astronomical control (Van Echelpoel & Weedon, Reference Van Echelpoel and Weedon1990; Vandenberghe et al., Reference Vandenberghe, Hager, Van den Bosch, Verstraelen, Leroi, Steurbaut, Prüfert, Laga and Vandenberghe2001; Abels et al., Reference Abels, van Simaeys, Hilgen, De Man and Vandenberghe2006). In the Netherlands, where the RCM is buried and not outcropping, we have no data available to confirm the presence of such alternating layers. The RCM-M subunit represents the sea-level high stand and is therefore estimated to have an age between 31.6 and 29.2 Ma (Fig. 15).
The Rupelian sea was characterised by a restricted marine setting as evidenced by endemic flora and fauna. The basin was semi-enclosed and only connected to the North Atlantic via a northern connection and a temporary southern connection to the para-Tethys (Van Simaeys et al., Reference Van Simaeys, Munsterman and Brinkhuis2005). Estimates of the water depth of the Rupelian sea range between 50 and 155 m in Belgium, with cyclic variations (Laenen, Reference Laenen1998). Towards the centre of the North Sea Basin between Scotland and Norway, the environment deepened as can be concluded from regional trends in bed thickness and grain size (Vandenberghe & Van Echelpoel, Reference Vandenberghe and Van Echelpoel1987). According to De Lang & Ebbing (Reference De Lang and Ebbing2003), the water depth may have reached up to 500 m in the deepest parts. However, it remains unclear to which area they are referring, and no data are provided to support this statement.
Late Rupelian
Towards the end of the Rupelian, around 28.6 Ma, eustatic sea level dropped as a result of the Oi-2a cooling event (~28.3 Ma; Miller et al., Reference Miller, Mountain, Browning, Kominz, Sugarman, Christie-Blick, Katz and Wright1998). Besides the sea-level drop, tectonic activity gradually increased as well, leading to regional uplift and tilting (De Man et al., Reference De Man, Van Simaeys, Vandenberghe, Harris and Wampler2010). The effect was a shallowing of facies and erosion, removing up to 80 m in the Antwerp area. In the north of Belgium the input of silicified Late Cretaceous foraminifera into Rupelian age sediments points to uplift and erosion west of the Antwerp area (De Man et al., Reference De Man, Van Simaeys, Vandenberghe, Harris and Wampler2010). In the triangle Brussels–Winterswijk–Bonn, Hager et al. (Reference Hager, Vandenberghe, Van den Bosch, Abraham, Von der Hocht, Rescher, Laga, Nickel, Verstraelen, Leroi and Van Leeuwen1998) have identified these changes to increase grain size from clayey to more sandy around the transition from NP-23 to NP-24 (Fig. 15). They conclude that a central area in the middle of the graben along the Pellenberg–Winterswijk section was uplifted gradually, causing a water depth change of 30–70 m. The sandy upper part in the section is the overlying Eigenbilzen Formation. A eustatic component is not mentioned.
The eustatic amplitudes during the Oligocene have been matter of debate. According to Pekar & Miller (Reference Pekar and Miller1996), the high-amplitude changes presented by Haq et al. (Reference Haq, Hardenbol and Vail1987) are not supported by their δ18O record. They conclude that the amplitudes are poorly known, but much less than the maximum of 140 m reported by Haq et al. (Reference Haq, Hardenbol and Vail1987).
The Late Rupelian eustatic sea-level fall and gradually increasing tectonic activity are expected to have led to regressive conditions. Such conditions can be identified in the RCM-U subunit, which consists of relatively fine-grained but coarsening upward sediments. These are interpreted to be deposited in a shallowing marine environment, reflecting regressive circumstances. Coarsest-grained sediments were encountered at the margin of the Roer Valley Graben near the German border (well B58G0192). This infers a proximal location near a palaeo-coastline and/or river mouth as corroborated by the results of Hager et al. (Reference Hager, Vandenberghe, Van den Bosch, Abraham, Von der Hocht, Rescher, Laga, Nickel, Verstraelen, Leroi and Van Leeuwen1998) who found ‘sandy top-facies’ in zone NP24. Based on this and the estimated age of the base of the correlative Belgian Eigenbilzen Formation (Van Simaeys, Reference Van Simaeys2004b), we estimate the age of the RCM-U to be between 29.2 and 28.6 Ma (Fig. 15).
The lithostratigraphic Steensel Member overlies the RCM-U subunit and is the equivalent of the Belgian Eigenbilzen Formation. This member consists of an alternation of clays and silty clays with thin sand layers, grading upwards into fine-grained sands with a high glauconite content. The depositional environment was near-coastal (Van Adrichem Boogaert & Kouwe, Reference Van Adrichem Boogaert and Kouwe1993). Further north (basinward), the sandy Steensel Member is absent and the similarly sand-dominated Voort Member overlies the RCM.
Around the middle of the Rupelian the relative accommodation space in the North Sea Basin reached a maximum (Fig. 15). This space was filled with sediment at various rates of supply. In general, the rate of sediment supply is thought to have been high during the Early Rupelian, reaching a low around the Middle Rupelian and increasing again towards the Late Rupelian (Laenen & De Craen, Reference Laenen and De Craen2004). This trend probably reflects regional tectonic activity leading to increased or reduced uplift and erosion (e.g. Vandenberghe et al., Reference Vandenberghe, Laenen, Van Echelpoel and Lagrou1997). Clay mineralogy in Belgium indicates that the increased sediment supply during the Late Rupelian was caused by uplift of the Ardennes-Rhenish Slate Massif (Vandenberghe et al., Reference Vandenberghe, Laenen, Van Echelpoel and Lagrou1997). More recently, the variation in Rupelian bed thickness throughout the sequence has been linked to tectonic control of sediment supply as well (Vandenberghe & Mertens, Reference Vandenberghe and Mertens2013).
The increased tectonic activity towards the end of the Rupelian created a regional unconformity spanning the interval 28.7 ± 0.6 Ma (top Rupelian) to 27.5 ± 0.7 Ma (base Chattian) in northern Belgium (Demyttenaere, Reference Demyttenaere1989; De Man et al., Reference De Man, Van Simaeys, Vandenberghe, Harris and Wampler2010). In the central North Sea Basin this unconformity is not present, confirming its regional character (Van Simaeys, Reference Van Simaeys2004a). This regional unconformity is expected to be present in the south of the Netherlands as well. In those areas in the Netherlands where the Veldhoven Clay Member directly overlies the RCM, this generally is a gradual, conformable transition (Van Adrichem Boogaert & Kouwe, Reference Van Adrichem Boogaert and Kouwe1993). This is roughly in the central eastern part of the Netherlands (Fig. 4b).
A recent study indicates that the base of the Chattian is synchronous with the Oi-2a cooling event around 28.3 Ma (Śliwińska et al., Reference Śliwińska, Abrahamsen, Beyer, Brünings-Hansen, Thomsen, Ulleberg and Heilmann-Clausen2012). The unconformity at the base of the Chattian deposits in the North Sea Basin is not related to a glacio-eustatic sea-level fall linked to the Oi-2b cooling event, because that event is younger (lower Chattian) based on calcareous nannofossils (Van Adrichem Boogaert & Kouwe, Reference Van Adrichem Boogaert and Kouwe1993; Śliwińska et al., Reference Śliwińska, Abrahamsen, Beyer, Brünings-Hansen, Thomsen, Ulleberg and Heilmann-Clausen2012, Reference Śliwińska, Heilmann-Clausen, Thomsen and Rocha2014).
Post Rupelian
The Late Oligocene to Early Miocene period is characterised by a gradual increase of tectonic activity (Fig. 15), related to the Savian tectonic phase (Van Hoorn, Reference Van Hoorn1987; De Jager, Reference De Jager, Wong, Batjes and De Jager2007). This phase led to marked uplift in the West Netherlands Basin (De Jager, Reference De Jager, Wong, Batjes and De Jager2007). During the Chattian, significant subsidence of the Roer Valley Graben began, which was associated with propagation of the Lower Rhine rift system into the Netherlands (Geluk et al., Reference Geluk, Duin, Dusar, Rijkers, Van den Berg and Rooijen1994; Van den Berg et al., Reference Van den Berg, Groenewoud, Lorenz, Lubbers, Brus and Kroonenberg1994). As a result of that, deposits of Chattian age (i.e. Veldhoven Formation) are much thicker than deposits of Rupelian age.
During the Savian tectonic phase which started around late Rupelian – early Chattian tomes (Fig. 15), the northern part of the West Netherlands Basin was uplifted (inversion). This caused partial or complete erosion of the RCM, as indicated by the uncertain thickness in the area (Fig. 9). The effect of the inversion and erosion is clearly visible in an offshore seismic section (Fig. 16). Important unconformities are not identified in the Roer Valley Graben, while they are seen in Belgium, so they only seem to occur in proximal regions.

Fig. 16. Seismic section through Cenozoic sediments below the North Sea (modified after Knox et al., Reference Knox, Bosch, Rasmussen, Heilmann-Clausen, Hiss, De Lugt, Kasińksi, King, Köthe, Słodkowska, Standke, Vandenberghe, Doornenbal and Stevenson2010).
Lithofacies distribution
The distribution of median grain size (D50) in the Netherlands based on our samples from 19 wells roughly fits with the palaeogeographic setting as described above and presented by Knox et al. (Reference Knox, Bosch, Rasmussen, Heilmann-Clausen, Hiss, De Lugt, Kasińksi, King, Köthe, Słodkowska, Standke, Vandenberghe, Doornenbal and Stevenson2010; Fig. 3). In palaeo-coastal regions, coarser-grained facies of the RCM are expected due to input from land and reworking by currents and waves. This is corroborated by the fact that the samples with the finest average median grain size are found in the north and the coarsest are found in the southwest around the Zeeland High, and in the southeast around the Venlo Block (Fig. 17).

Fig. 17. On- and offshore Cenozoic structural elements, D50 average grain size of the Rupel Clay Member for each sampled well, and the thickness of Vessem Member sands are shown to identify the effect of structural elements on palaeo-depositional environments and lithofacies in the Rupel Clay Member.
Recent studies have found tectonic signals in the Rupelian Boom Clay cycles and indications for regional uplift at the end of the Rupelian stage (De Man et al., Reference De Man, Van Simaeys, Vandenberghe, Harris and Wampler2010; Vandenberghe & Mertens, Reference Vandenberghe and Mertens2013). Pre-existing structural elements may have been active during the Rupelian stage (Knox et al., Reference Knox, Bosch, Rasmussen, Heilmann-Clausen, Hiss, De Lugt, Kasińksi, King, Köthe, Słodkowska, Standke, Vandenberghe, Doornenbal and Stevenson2010; N. Vandenberghe, pers. comm., 2013). To understand the distribution of lithofacies, we plotted Cenozoic structural elements, RCM grain-size data and the thickness of the sand-rich Vessem Member together on one map (Fig. 17).
The distribution of wells which penetrated the thickest occurrences of the transgressive sandy Vessem Member provides some clues on the presence of shallower parts in the basin. For this exercise we assume that this transgressive sequence is thicker in shallower waters, where more land-sourced sand was available. The Vessem Member is thickest in the southwest and southeast (Fig. 17), which is in line with the presence of the coarsest RCM deposits. In the rest of the onshore Netherlands the pattern is more random, with thicker Vessem Member occurrences at various locations. RCM grain size and Vessem Member thickness are therefore roughly in line with expected general palaeogeographic trends which show deeper waters towards the northwest, i.e. towards the centre of the North Sea Basin (Fig. 3).
Depositional thickness and preservation
Most of the observed thickness variation of the RCM (Fig. 9) is likely to be of post-depositional origin. Since most of the RCM in the Netherlands was deposited in a marine basin during a period of relative tectonic quiescence, we assume a relatively uniform depositional thickness.
Uplift of the northern part of the West Netherlands Basin during the Savian tectonic phase caused partial or complete erosion of the RCM, as indicated by the uncertain thickness in the area (Fig. 9). This uncertain thickness is also the result of poor well interpretations; in many oil and gas wells the Cenozoic sequence has not been interpreted beyond lithostratigraphic group level.
Besides erosion of the West Netherlands Basin, uplift of the London–Brabant Massif also caused erosion of Rupelian deposits. Similarly, in the north of the onshore Netherlands, salt tectonics have caused uplift and locally erosion of the RCM.
Clay content
Although the RCM is known as a clay layer, its clay content is relatively low. Based on laser-diffraction grain-size measurements without a correction for the plate shape of clay minerals, the clay percentage of our measured samples rarely exceeds 25%. This implies that in terms of sediment texture most samples would not classify as a clay, but rather as a fine to coarse silt. The low clay content in our samples based on laser-diffraction measurements contrasts with other studies which use various methodologies. Although clay content determined using different methodologies cannot simply be compared, we provide an overview here to demonstrate the variability in results.
A study using samples from the most silty to clayey intervals (our RCM-M) near the town of Mol (Belgium) found 44–60% clay (De Mulder et al., Reference De Mulder, Schokking and Van Rooijen1984). Similarly, grain-size analyses on samples from the east of the Netherlands (Achterhoek) are said to have a clay content up to 60% according to the same study. An evaluation of the Boom Clay as a raw material for the clay product industry used the sedimentation method to determine the fraction <2 µm. The samples were taken from outcrops north of the River Rupel in Belgium, and yielded clay percentages ranging between 23.5 and 63.3% (Decleer et al., Reference Decleer, Viane and Vandenberghe1983). Samples taken from well MOL-1 in Belgium were reported to contain 25–70 wt.% clay minerals. Those values were obtained using X-ray diffractometry (Cornélis, Reference Cornélis2001; Honty & De Craen, Reference Honty and De Craen2012; Zeelmaekers et al., Reference Zeelmaekers, Honty, Derkowski, De Craen, Vandenberghe, Adriaens, Ufer and Wouters2015) and correspond with results using a similar methodology for the southern Netherlands in a recent study (Koenen & Griffioen, Reference Koenen and Griffioen2016).
A number of samples taken from the Boom Clay in well MOL-1 and from the Underground Research Facility in Mol contain 2.4–53.4% in the grain-size fraction <2 µm, using the sedimentation method (Honty, Reference Honty2008). It is acknowledged that the Boom Clay in Belgium is a silty clay or argillaceous silt, with remarkable silt-clay bands several tens of centimetres thick (Cornélis, Reference Cornélis2001; Vandenberghe & Wouters, Reference Vandenberghe and Wouters2011). The observed differences in clay content are the result of the methodologies used. The measurement of clay-mineral content using X-ray fluorescence techniques may provide a valuable tool to cross-validate other techniques for clay-content determination. Verweij et al. (Reference Verweij, Vis and Imberechts2016) have compared the clay-percentages based on different techniques for the Rupel Clay Member in more detail.
The vertical lithological variability in the RCM is the result of the mode of deposition. The bands are the result of cyclic variations in grain size and organic matter (Vandenberghe, Reference Vandenberghe1978; Van Echelpoel & Weedon, Reference Van Echelpoel and Weedon1990; Van Echelpoel, Reference Van Echelpoel1994; Laenen & De Craen, Reference Laenen and De Craen2004). These variations are considered to reflect changes in bottom water turbulence (Vandenberghe, Reference Vandenberghe1978). Regular periodicities of ~100 cm and ~46 cm have been identified, which are linked to Milankovitch cycles (Van Echelpoel & Weedon, Reference Van Echelpoel and Weedon1990; Van Echelpoel, Reference Van Echelpoel1994). The mechanism behind the silty intervals in the RCM is possibly periods of (relatively) increased winnowing by bottom currents (e.g. Vis et al., Reference Vis, Kasse, Kroon, Jung, Zuur and Prick2010). This mechanism seems to play a greater role in near-coastal situations and is therefore less likely to be found further away from the palaeo-coastline where water depths were greater. Currently these fine-grained deposits are buried at great depth in a large part of the Netherlands. It is therefore unknown whether the bands as observed in Belgium are present in the Dutch subsurface. Possibly the more distal deep water facies are richer in clay.
In the deeper palaeo-environment underneath a large part of the Netherlands, the bands and lamination may have been destroyed by bioturbation. The depositional environment was quieter in the deeper water, which may have favoured stronger bioturbation while sedimentation continued. Bioturbation is present as demonstrated by Laenen and De Craen (Reference Laenen and De Craen2004) who studied siderite concretion level S60 which is situated in bed 56, in the centre of an intensely bioturbated zone in Belgium, which points to low sedimentation rates.
Conclusions
This study presents an updated regional-scale onshore geometry (depth and thickness) of the Rupel Clay Member in the Netherlands. The geometry is derived from seismic data and based on well data and shows the 3-D geometry and distribution of the member. The Rupel Clay Member is present in nearly the entire onshore part of the Netherlands. The thickness of the member is variable but rarely exceeds 125 m. We identified three subunits: RCM-U, with a thickness of 15–40 m; RCM-M, with a thickness of 40–90 m and RCM-L with a thickness of 25–50 m. Along the southwestern and eastern borders of the Netherlands, the member is present within ~50 m of the surface and partially eroded. The deepest occurrences of the member lie in the Roer Valley Graben (−1500 m m.s.l.) and in the Zuiderzee Low (−1200 m m.s.l.). The distribution is affected by inversion and erosion of the West Netherlands Basin and erosion of the London–Brabant Massif. In the north, salt tectonics have caused uplift and sometimes erosion.
Based on new grain-size samples from 19 wells we were able to demonstrate that the Rupel Clay Member is finest-grained in the north, with <25% clay content. It must be noted that this value is based on laser-diffraction grain-size measurements without a correction for the plate shape of clay minerals, which underestimate the clay content. The member can be divided into three subunits, which are easiest to identify using a combination of gamma-ray and grain-size data. The lower subunit shows a fining-upward trend (RCM-L; ~32–31.6 Ma), the middle subunit is finest grained (RCM-M; 31.6 and 29.2 Ma) and the upper unit shows a coarsening-upward trend (RCM-U; 29.2 and 28.6 Ma). In the north the depositional environment was more distal; thus the three subunits have a very subtle expression and the grain sizes are generally smaller.
A review of climatic and tectonic events during the Rupelian shows that the area just north of the London–Brabant Massif along the border between the Netherlands and Belgium has been most affected by erosion. Further towards the basin (current North Sea) and in the Roer Valley Graben, the most complete sequences are found.
Further work
Most important for improving the understanding of the Rupel Clay Member is obtaining completely cored and logged sections from the Dutch subsurface. The focus should be on deeper buried intervals, since current knowledge relies heavily on samples from shallow boreholes and outcrops in Belgium. Cores should also be collected from the northern, distal facies, of which very little is known at present. A nation-wide seismic (re)interpretation of the Rupel Clay Member would further improve the depth and thickness maps of the member and provide a more complete distribution of faults. Despite the new information presented here, much remains unknown due to lack of core data. Although regular lamination at decimetre-to-metre scale and layers of calcareous septaria have been identified within the Rupel Clay Member in Belgium and in the east of the Netherlands, it is unclear whether these features are present in the subsurface of the Netherlands.
Understanding of the depositional history of the Rupel Clay Member in the Netherlands can be considerably improved by applying biostratigraphic age control and up-to-date stratigraphic well interpretations. That would in turn facilitate the establishment of a cross-border lithostratigraphic framework for the Rupelian in the Netherlands, Belgium and Germany.
Acknowledgements
This work is partly based on report OPERA-PU-TNO411 which was written by TNO in the framework of the Dutch research programme on geological disposal of radioactive waste OPERA (OnderzoeksProgramma Eindberging Radioactief Afval). The authors thank COVRA for financial support to write this paper. Wijnen Square Crops is thanked for permission to sample well CAL-GT-02. Laurent Wouters of NIRAS (Belgium) is thanked for providing ArcGIS data of the Boom Formation. João Araújo is thanked for providing inspiring accommodation during the writing of this paper. The authors thank Nora Witmans and Erika Neeft for comments on earlier drafts of this manuscript. Noël Vandenberghe and Mieke De Craen are thanked for their extensive review and their valuable comments and suggestions which greatly improved the quality of this work.


 Open access