


1. Introduction
Individuals’ influence in various social networks may be an appropriate measure for identification of eligible persons for immunization and a viable strategy for preventing epidemics or reducing the number of infected individuals during an outbreak. While the communication network studied can be modeled using a single-layer network, this method is insufficient for many complex networks commonly existent in the real world, and a significant amount of data is lost in the process. A more accurate assumption for human networks is that they are composed of numerous connections between individuals.
Recent years have seen a surge in research on multilayer networks, particularly multiplex networks, as data sets containing numerous interactions between individuals in a network became available. Recent studies have emphasized the context of multilayer and multiplex networks when modeling real-world multilayer networks (Aleta and Moreno, Reference Xu, Wang, Lu and Hu2019; Cheriyan and Sajeev, Reference Chen, Paul, Havlin, Liljeros and Stanley2020; de Domenico et al., Reference de Domenico, Granell, Porter and Arenas2016; Tortosa et al., Reference Zheng, Xia, Guo and Dehmer2021; Valles-Catala et al., Reference Tu, Jiang, Song and Zhang2016). Multiplex networks are a type of multilayer network in which the same nodes in different layers of the network interact with one another (Iacovacci and Bianconi, Reference Hébert-Dufresne, Allard, Young and Dubé2016; Soriano-Paños et al., Reference Soriano-Paños, Guo, Latora and Gómez-Gardeñes2019). In multiplex networks, interlayer links connect the same nodes across different layers, enabling the propagation of dynamic processes and enhancing the overall robustness of the system (Kivelä et al., Reference Kivelä, Arenas, Barthelemy, Gleeson, Moreno and Porter2014). These models are more realistic than single-layer networks because, in the real world, each individual communicates with other members in a variety of ways, and communication at any layer affects communication at all other layers. Infectious diseases, for example, spread through physical contacts (Funk et al., Reference Fan, Jin, Huo, Liu, Yang and Wang2009; Granell et al., Reference Funk, Gilad, Watkins and Jansen2014; Wang et al., Reference Valles-Catala, Massucci, Guimera and Sales-Pardo2015). Moreover, awareness can be transmitted via an individual’s communication network. Individuals exchange information about the emergence of infection via communication networks. Individuals who are aware of infection can take appropriate actions when communicating with others in their physical network (Xu et al., Reference Zweig2023). The multiplex network enables the study of the interaction between these two networks and the effect of awareness on infection spread.
Essential nodes are critical to the network’s performance. Therefore, examining the effect of node importance in the network from various perspectives should be considered. Therefore, it is essential to use appropriate centrality measures when identifying individuals who play a key role in a social network. Numerous procedures have been used to identify key members in single-layer and multilayer networks, primarily based on the network topology or structure. However, the rapid development of multiplex network science may misinterpret established methods, resulting in erroneous conclusions and findings (Borgatti, Reference Borgatti2006; Butts, Reference Borgatti2009). The vital point to remember is that the appropriate use of centrality measures varies according to the situation. The most significant gap in previous research is that most studies neglect to consider the network context when selecting these influential members (Bockholt and Zweig, Reference Xu, Wang, Lu and Hu2019).
The term “context” refers to how a subject is expressed concerning time, place, and circumstance. Understanding context is a necessary precondition for comprehending any other relationship and comprehending any other relationship in practice would be impossible without first comprehending context. Understanding a network context begins with considering the network’s purpose for the study. For instance, there are two primary objectives when it comes to selecting key members. One method is to propagating information within a network by selecting a subset of key members. In public health, this type of selection occurs when an organization selects a group of community members to broadcast information about health improvement. The other option is to interrupt the broadcasting process or to break down the network by removing key nodes. This type of removal occurs in public health when a subset of community members must be quarantined or immunized to contain an epidemic (Borgatti, Reference Bockholt and Zweig2005).
The second component of the network context is the network process or flow. According to Borgatti, centrality predicts which node is most frequently used during a network flow or process (Bockholt and Zweig, Reference Xu, Wang, Lu and Hu2019; Borgatti, Reference Borgatti2006; Zweig, Reference Zheng, Xia, Guo and Dehmer2016). While others, such as Freeman, have concentrated their efforts on the relationship between network processes and quantitative measures of network structure, Borgatti was the first to investigate the relationship between the desired process and quantitative measures, as well as the process’s indirect effects on the network. Additionally, he stated unequivocally that a mismatch between a complicated network, its process, and the centrality measure would result in non-generalizable results. The current formulas for calculating centrality measures are entirely geared toward specific processes, and when applied to other processes, produce incorrect results (Zweig, Reference Zheng, Xia, Guo and Dehmer2016). Furthermore, Bockholt and Zweig examined four distinct flow processes and concluded that each network measure is suitable for a particular flow process (Bockholt and Zweig, Reference Xu, Wang, Lu and Hu2019).
Identifying key members of multiplex networks may result in citable results. Considering the dynamic properties of the network and its conditions, such as multilayer structure and the centrality measure, complicates these networks.
According to previous research, various processes have combined a unit centrality measure across multiple network layers to select key members using multiplex network centrality measures. The impact of a node’s centrality in one layer on its centrality in another layer has been evaluated in these algorithms (Multiplex PageRank), or the share of layers in a node’s centrality can be measured in these methods using links between different layers (Multiplex Eigenvector Centralities, Functional Multiplex PageRank, and MultiRank).
Centrality measures play a critical role in link prediction and other significant applications of multiplex networks. Nasiri and Berahmand developed the Multiplex Local Random Walk (MLRW) method, which enhances traditional link prediction by integrating multiple centrality metrics such as degree, closeness, and betweenness. Their approach leverages both intra-layer and inter-layer structural information to bias the random walk process, thereby improving the accuracy of predicting potential links (Nasiri et al., Reference Valles-Catala, Massucci, Guimera and Sales-Pardo2021). Also They proposed a novel Weighted Common neighbors (WCN) method that employs various centrality measures to predict link formation in multiplex networks (Nasiri et al., Reference Wang, Guo, Sun and Xia2022).
Another approach for selecting key nodes in reversible epidemic control was presented in Sun et al. (Reference Zweig2023). This method integrated techniques of machine learning to automatically differentiate community structures from the network, effectively dividing it into communities with analogous interaction patterns. The approach optimized the epidemic threshold by combining these community insights with evolutionary algorithms that pinpointed the most prominent nodes for vaccination and offered a robust alternative to classical centrality-based strategies.
Also, another study sponsored an innovative method that modeled the co-evolution of information and epidemic dynamics using a UAU-SIS framework. Their approach leveraged machine learning to detect community structures in time-varying multiplex networks and integrated evolutionary algorithms to optimize the epidemic threshold by targeting influential nodes for vaccination. This method, by considering asymmetric individual activity levels, presented a novel and complementary strategy for the effective control of epidemic outbreaks (Xie and Huo, Reference Xie and Huo2024).
Other algorithms enable users to directly control the centrality of nodes in multilayer networks by incorporating the explicit behavior of the interlinks (Versatility, Communicability) (Rahmede et al., Reference Wang, Andrews, Wu, Wang and Bauch2018).
The critical point that none of these studies address is the distinction between the layers and their context, which results in the use of a unit centrality for all layers and a combination method (Cheriyan and Sajeev, Reference Chen, Paul, Havlin, Liljeros and Stanley2020; Tortosa et al., Reference Zheng, Xia, Guo and Dehmer2021; Tu et al., Reference Tortosa, Vicent and Yeghikyan2018). If we intend to examine solutions using multiple layers, we should be aware that each layer has a unique context that may affect the network’s overall centrality. Hence, each layer’s centrality should correspond to its context, and the centralities of multiple layers should be combined. This issue has not yet been investigated as far as we know.
In this study, we address two primary objectives. First, we determine the appropriate centrality measure for each layer by considering the study’s goals and contextual factors, which are vital for selecting suitable research methodologies, tools, and techniques. Second, we present an effective method for combining the layers’ centralities to determine the total centrality of the multiplex network, thereby facilitating the identification of key nodes for immunization when resources are limited. A scale-free (SF) bilayer multiplex network is used to accomplish these objectives, which includes physical communications between individuals in one layer and virtual relationships between the same individuals in another layer. We also investigate the proper centrality measure for each layer by considering its context and present an effective combination solution called Multiplex Combined PageRank (MCPR), which leverages the effect of a node’s centrality in one layer on its centrality in another layer.
The rest of the paper is organized as follows. Section 2 explains basics of the proposed method including joint infection-awareness immunization model and node selection methodology. The proposed MCPR centrality method is presented in Section 3. Simulation and results are illustrated and explained in Section 4. Section 5 provides analysis of the algorithm parameters. Finally, Section 6 presents concluding remarks and future works.
2. Methods
Since a double-layer multiplex network that considers the context of each layer is used to model the immunization of network nodes, the algorithm’s evaluation metric is the joint infection and awareness spread model. Numerous studies present various types of these models (Fan et al., Reference de Domenico, Solé-Ribalta, Omodei, Gómez and Arenas2016; Pan and Yan, Reference Wang, Andrews, Wu, Wang and Bauch2018; Zheng et al., Reference Wang, Guo, Sun and Xia2018). The generalized SIR-UA model with an awareness index was used in this study, adopted from Funk et al. (Reference Fan, Jin, Huo, Liu, Yang and Wang2009) and Kan and Zhang (Reference Iacovacci and Bianconi2017).
We implemented the MCPR and SIR-UA models using R. Then, to compare our approach with the Multiplex PageRank (MPR) method, we drew upon the article “Functional Multiplex PageRank” (Iacovacci et al., Reference Iacovacci, Rahmede, Arenas and Bianconi2016), in which the analyses were carried out in the Matlab environment.
2.1 The joint infection-awareness immunization model
As previously stated, this study’s multiple networks include both physical and virtual layers. The SIR model is used to model infection spread at the physical layer. In the virtual layer, information about this infection spreads through the network via the UA model, in which unaware individuals (U) can receive information from aware individuals (A) via communication with these nodes. By demonstrating preventive behaviors, aware individuals prevent infection from spreading in the physical layer (Kan and Zhang, Reference Iacovacci and Bianconi2017; Shams and Khansari, Reference Valles-Catala, Massucci, Guimera and Sales-Pardo2015; Wang et al., Reference Valles-Catala, Massucci, Guimera and Sales-Pardo2015); thus, the SIR and UA models interact.
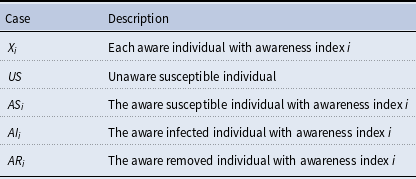
According to this model, each individual can adopt one of the scenarios presented in Table 1. In the possible cases of
 $AS_{i}$
,
$AS_{i}$
,
 $AI_{i}$
, and
$AI_{i}$
, and
 $AR_{i}$
,
$AR_{i}$
,
 $X_{i}$
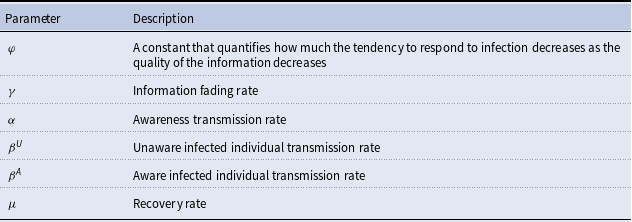
represents an individual. Index i measures the quality of the information received by an individual and serves as a proxy for their awareness index. Individuals who become aware retain their awareness, but the quality of their awareness deteriorates during transmission events and over time. The rate at which awareness fades is referred to as the information fading rate (Funk et al., Reference Fan, Jin, Huo, Liu, Yang and Wang2009).
$X_{i}$
represents an individual. Index i measures the quality of the information received by an individual and serves as a proxy for their awareness index. Individuals who become aware retain their awareness, but the quality of their awareness deteriorates during transmission events and over time. The rate at which awareness fades is referred to as the information fading rate (Funk et al., Reference Fan, Jin, Huo, Liu, Yang and Wang2009).
Individual conditions’ symptoms

Initially, it is assumed that the susceptible nodes are unaware, but they may become aware through communication with aware individuals. Additionally, infected nodes become aware following the onset of infection symptoms and then spread their awareness. Furthermore, vaccinated nodes develop awareness and spread it throughout the awareness layer (Shams and Khansari, Reference Valles-Catala, Massucci, Guimera and Sales-Pardo2015; Wang et al., Reference Valles-Catala, Massucci, Guimera and Sales-Pardo2015).
In the physical layer, vaccinated nodes are excluded from the infection transmission and reception cycle.
Table 2 summarizes the model parameters used in this study. The following paragraphs include only the names of the parameters without their definitions for convenience
Defining the joint infection-awareness spreading model’s fixed parameters
The following four steps occur at each time step of the pandemic period (Funk et al., Reference Fan, Jin, Huo, Liu, Yang and Wang2009; Kan and Zhang, Reference Iacovacci and Bianconi2017) described in the following.
-
1. Recovery phase: Each infected node recovers with probability of μ.
-
2. Transmission phase: Each infected individual has a probability of
 $\hat{\beta }$
for contracting an infection from its infected neighbors in the physical layer. The aware or unaware susceptible nodes will be infected with a probability of
$\beta ^{U}$
and
$\beta ^{A}$
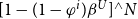
, respectively. According to Equation (1), each aware and unaware individual with N infected neighbors will have a probability of
$[1-(1-\varphi^{i})\beta^U]^\wedge N$
and
$(1-\beta ^{U})^\wedge{}N$
of not being infected by any of the infected neighbors.
$\hat{\beta }$
for contracting an infection from its infected neighbors in the physical layer. The aware or unaware susceptible nodes will be infected with a probability of
$\beta ^{U}$
and
$\beta ^{A}$
, respectively. According to Equation (1), each aware and unaware individual with N infected neighbors will have a probability of
$[1-(1-\varphi^{i})\beta^U]^\wedge N$
and
$(1-\beta ^{U})^\wedge{}N$
of not being infected by any of the infected neighbors.


Individuals with an awareness index i who are adjacent to an infected individual will become infected at a rate of
 $(1-\varphi ^{i})\beta^U$
. Here,
$(1-\varphi ^{i})\beta^U$
. Here,
 $\varphi$
is a constant strictly between 0 and 1 that regulates how awareness quality diminishes as ii increases, thus determining individuals’ reactions to infection when information quality declines. Furthermore,
$\varphi$
is a constant strictly between 0 and 1 that regulates how awareness quality diminishes as ii increases, thus determining individuals’ reactions to infection when information quality declines. Furthermore,
 $\overline{d}$
represents the average degree of the physical layer, while
$\overline{d}$
represents the average degree of the physical layer, while
 $\beta ^{U}$
and
$\beta ^{U}$
and
 $R_{0}$
are constants that vary based on the type of infection, as also seen in traditional SIR models and related frameworks.
$R_{0}$
are constants that vary based on the type of infection, as also seen in traditional SIR models and related frameworks.
 \begin{align} \beta ^{U} &=\begin{cases} \frac{R_{0}\,*\,\mu }{\overline{d}} & R_{0}\gt \overline{d}\\[3pt] \left(1-\left(1-\frac{R_{0}}{\overline{d}}\right)^{\mu }\right) & R_{0}\leq \overline{d} \end{cases} \\[-10pt] \nonumber \end{align}
 \begin{align} \beta ^{A} &=(1-\varphi^{i})\beta^{U} \,: \,0 < \varphi < 1 \\[-4pt] \nonumber \end{align}
-
3. Information transmission: Each unaware individual has a probability of α of becoming aware through a connection with an aware neighbor. The awareness index, initially set to zero, controls the awareness level. Additionally, each aware individual with an awareness index of i has the opportunity to renew information. If the awareness index of a node’s neighbors, denoted by the symbol j, is less than the node’s current awareness index i, the information is updated, and the awareness index i is set to j+1.
-
4. Information fading: Each individual’s awareness index decreases as the information transmission phase or time unit progresses. If an individual’s awareness index exceeds
$\gamma$
, the aware individual loses its information quality.

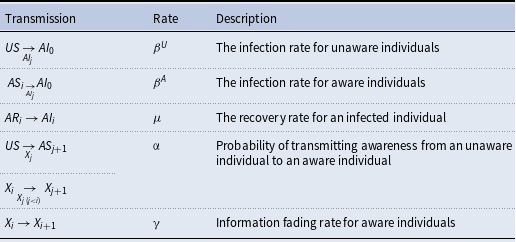
Table 3 summarizes all possible transmissions in the joint awareness-infection spreading model. Each transmission is represented in the following format:
As a result, an individual in the “old state” transitions to the “new state” via communication with a “connected person” at the rate specified in the second column of Table 3.
List of transmissions

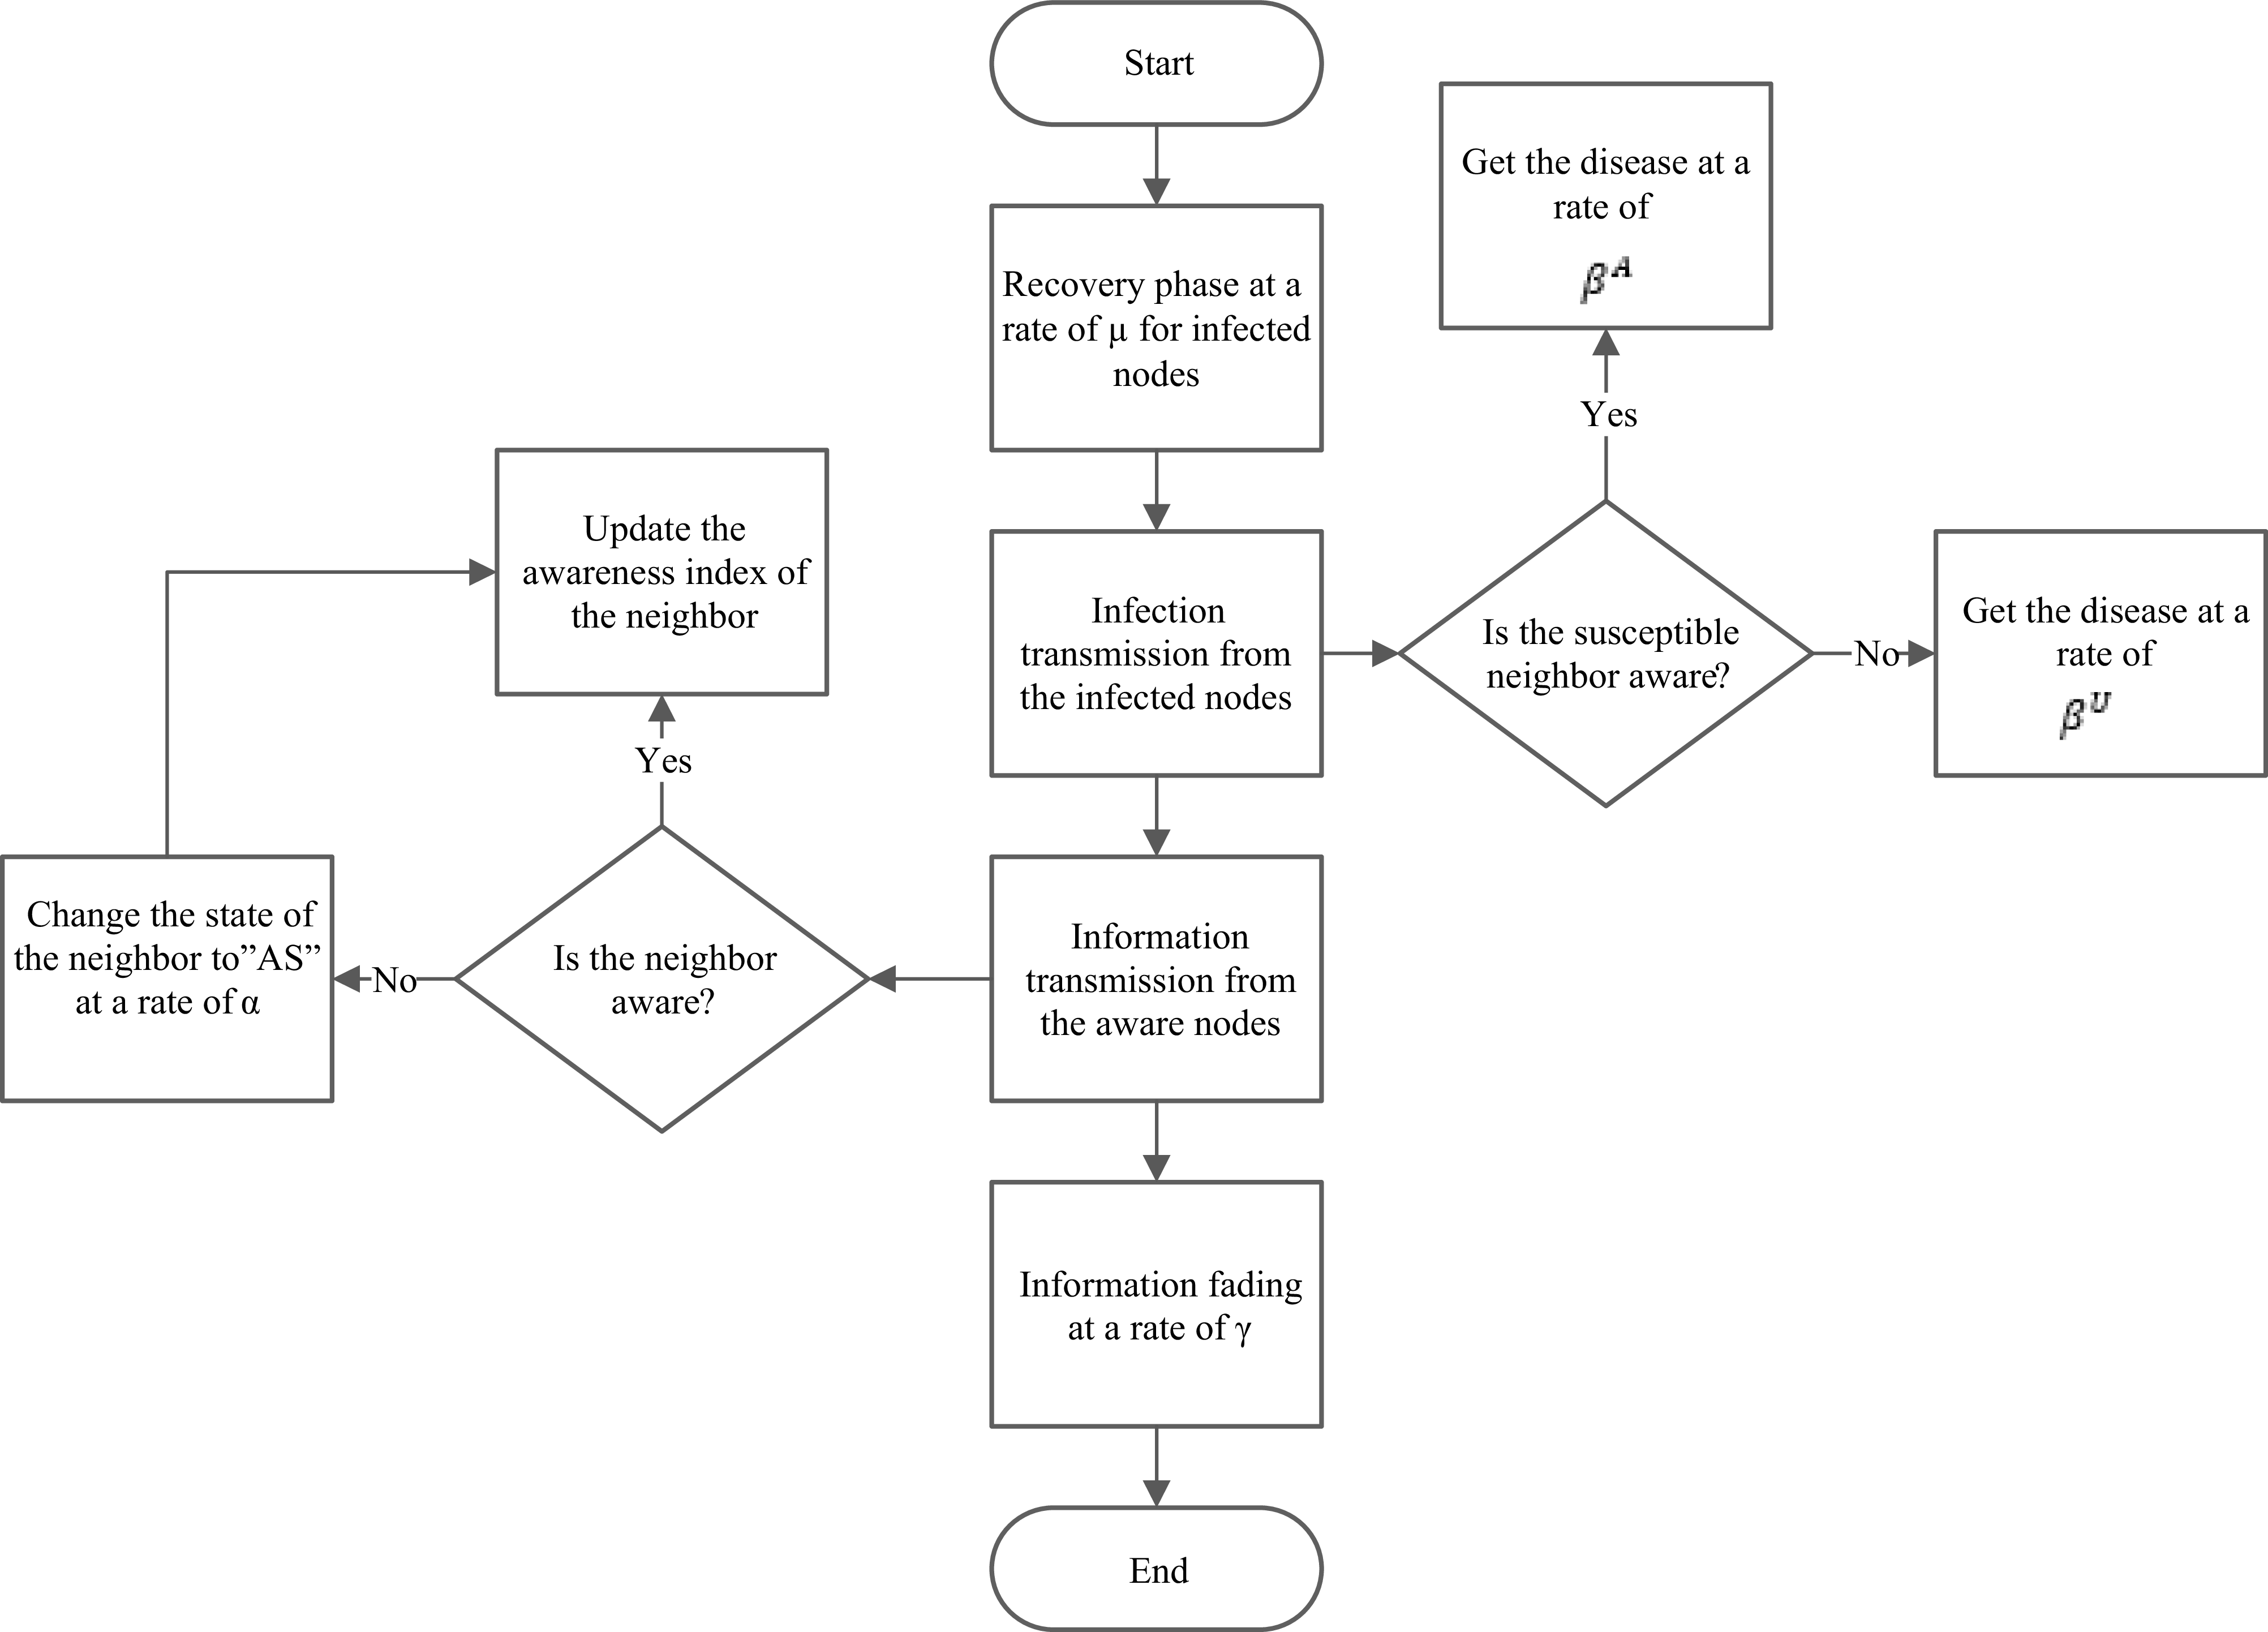
The diagram in Figure 1 illustrates the awareness and infection spread algorithms discussed in this study and how they affect each other.
Joint awareness-infection spread model.

In this model, the population is represented in two layers; an infection (physical) layer and an awareness (information) layer. Initially, all susceptible individuals are unaware but can become aware through contact with aware neighbors, while infected individuals automatically become aware upon showing symptoms. Vaccinated nodes remain aware but are exempt from transmitting or receiving infection. At each time step, four processes occur: (1) Infected individuals recover with probability μ; (2) Susceptible individuals contract the infection from infected neighbors at rates that depend on whether they are aware (
 $\beta ^{A}$
) or unaware (
$\beta ^{A}$
) or unaware (
 $\beta ^{U}$
); (3) Unaware individuals become aware with probability α, and awareness levels (indexed by i) may be updated if a node encounters neighbors with lower awareness indices; and (4) Individuals lose information quality if their awareness index exceeds a threshold γ. This joint framework illustrates how awareness spreads alongside infection and how both processes influence one another.
$\beta ^{U}$
); (3) Unaware individuals become aware with probability α, and awareness levels (indexed by i) may be updated if a node encounters neighbors with lower awareness indices; and (4) Individuals lose information quality if their awareness index exceeds a threshold γ. This joint framework illustrates how awareness spreads alongside infection and how both processes influence one another.
2.2 Selecting nodes for immunization
Numerous studies have previously compared and analyzed centrality measures in the context of social ties, flow propagation, and epidemic spread (Borgatti, Reference Borgatti2006; Chen et al., Reference Butts2008; Christley et al., Reference Cheriyan and Sajeev2005; Miller and Hyman, Reference Kiss and Bichler2007; Kan and Zhang, Reference Iacovacci and Bianconi2017; Kiss and Bichler, Reference Kan and Zhang2008; Zweig, Reference Zheng, Xia, Guo and Dehmer2016). The first group investigates influential Spreader for influential nodes capable of widely spreading the epidemic throughout the network. The second category examines the relationship between centrality measures and the probability of node infection. These studies determine the likelihood of an individual contracting an infection by repeatedly applying epidemic models across the network and then relate this value to centrality measures. The third group focuses on nodes that act as spread blockers; removing these nodes slows the epidemic’s growth. The objective of the immunization problem is to identify these blocker nodes. While these issues are closely related, they remain fundamentally distinct. Numerous studies demonstrate that the role of nodes in resolving these three issues is not identical (Borgatti, Reference Borgatti2006; Hébert-Dufresne et al., Reference Hébert-Dufresne, Allard, Young and Dubé2013).
For instance, in the influence maximization problem, nodes with a high total degree of neighbors or high core scores are an appropriate solution because the population density surrounding these nodes is high, and they can quickly spread the epidemic throughout the network. On the other hand, nodes with a high total number of neighbors or a high core score are ineffective in solving the immunization problem. Because of communication congestion, the immunized node’s neighbors to remain susceptible to infection. As a result, their immunization does not affect the community’s overall immunity. In general, it can be said that the immunization problem requires the discovery of a set of nodes connected to nodes with limited communication, which significantly reduces the probability of infection. Thus, each node’s immunity effect is inversely proportional to the degrees of its neighbors, whereas, in the influence maximization problem, each node’s influence is proportional to the total degrees of its neighbors. The probability of infection in the susceptible individual identification problem is dependent on the number and length of communication paths connecting other nodes to the node of interest (Borgatti, Reference Borgatti2006)
According to the definition above, the appropriate centrality for determining the appropriate nodes for solving the immunization problem is the centrality that ranks nodes proportional to their degree and the inverse degrees of their neighbors. The PageRank centrality measure, as described in the following section, satisfies these properties (Shams, Reference Zheng, Xia, Guo and Dehmer2014).
PageRank centrality quantifies the likelihood of encountering a node along a random path. As a result, nodes with a high PageRank centrality are not connected to a large number of communication paths, and they infect a large number of nodes in the event of infection. Additionally, nodes with a high PageRank centrality are typically nodes with a high degree relative to their neighbors. In other words, this algorithm immunizes nodes so that their immunization has a more significant effect on their neighbors’ immunity (Miller and Hyman, Reference Kiss and Bichler2007).
According to Shams et al.’s research on identifying eligible nodes for network immunization on a shoestring budget, the highest PageRank algorithm outperformed all other algorithms in free-scale, small-world, and real-world networks using three immunizations evaluation metrics (LCC and SSP). This is primarily due to the nodes with a higher PageRank consisting of a greater number of low-degree neighbors. As a result, their immunization significantly reduces the risk of infection for a large number of people. Since these nodes serve as a connection point between clusters, numerous random walks pass these nodes. Thus, the bridge nodes have a high PageRank (Shams, Reference Zheng, Xia, Guo and Dehmer2014).
As a result of computer simulations, the most efficient centrality-based technique is PageRank-based immunization, which holds for both the physical layer and the epidemy size-based immunization assessment measure used in this work.
3. The proposed method: MCPR centrality
As previously stated, the PageRank centrality measure is the most effective method for locating appropriate immunization nodes. Thus, the PageRank measure is used as the primary metric for ranking nodes in multiplex network nodes. Because the virtual interactions layer serves as a platform for the spread of infection information, the importance of these nodes in the virtual layer cannot be overstated. Consequently, we should propose an approach that considers the importance of nodes in both the physical and virtual layers.
Since the PageRank algorithm begins with no knowledge of the nodes’ PageRank importance, the constant value of
 $\frac{1}{N}$
is applied to all nodes (while N is considered as the total number of the network nodes).
$\frac{1}{N}$
is applied to all nodes (while N is considered as the total number of the network nodes).
Equation (3) is used to calculate the PageRank of an undirected graph with high mathematical accuracy, where
 $\alpha =0.85$
(Zheng et al., Reference Wang, Guo, Sun and Xia2018).
$\alpha =0.85$
(Zheng et al., Reference Wang, Guo, Sun and Xia2018).
 \begin{equation} x_{i}=\alpha _{A}\sum _{j}A_{ij}\frac{x_{j}}{g_{j}}+\left(1-\alpha _{A}\right)\frac{1}{N} \end{equation}
MPR treats the first layer (
 $L_{1}$
) as a layer with the neighborhood matrix
$L_{1}$
) as a layer with the neighborhood matrix
 ${a}_{ji}^{[L_{1}]}$
and applies classical PR to it.
${a}_{ji}^{[L_{1}]}$
and applies classical PR to it.
 \begin{align} x_{i} = \mu {\sum }_{j=1}^{N}{a}_{ji}^{\left[L_{1}\right]}\frac{x_{j}}{\hat{k}_{j}}+ \omega \\[-30pt] \nonumber \end{align}
 \begin{align*} \hat{k}_{j} =\max \left(\tilde{k}_{j}.1\right).\,{\rm with}\,\tilde{k}_{j}= {\sum }_{r=1}^{N}{a}_{jr}^{\left[L_{1}\right]} \end{align*}
Here
 $x_{i}$
denotes the PageRank score of node i in the first layer which later serves as the input for the second layer. The matrix element
$x_{i}$
denotes the PageRank score of node i in the first layer which later serves as the input for the second layer. The matrix element
 ${a}_{ij}^{[L_{1}]}$
represents the adjacency relation in the first layer (virtual layer) that equals to one if a link exists from node j to node i. The parameter
${a}_{ij}^{[L_{1}]}$
represents the adjacency relation in the first layer (virtual layer) that equals to one if a link exists from node j to node i. The parameter
 $\mu \in (0,1)$
is the probability following an outgoing link, while
$\mu \in (0,1)$
is the probability following an outgoing link, while
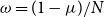 $\omega =(1-\mu )/N$
is the teleportation term for ensuring ergodicity. The quantity
$\omega =(1-\mu )/N$
is the teleportation term for ensuring ergodicity. The quantity
 $\tilde{k}_{j}$
is the degree of node j in
$\tilde{k}_{j}$
is the degree of node j in
 $L_{1}$
and
$L_{1}$
and
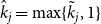 $\hat{k}_{j}=\max\{\tilde{k}_{j},1\}$
prevents division by zero.
$\hat{k}_{j}=\max\{\tilde{k}_{j},1\}$
prevents division by zero.
Equation (5) extends this formulation to the second layer (
 $L_{2}$
) by incorporating node weights obtained from the first layer. The MPR in the second (
$L_{2}$
) by incorporating node weights obtained from the first layer. The MPR in the second (
 $L_{2}$
) layer is then examined with the neighborhood matrix
$L_{2}$
) layer is then examined with the neighborhood matrix
 ${a}_{jr}^{[L_{1}]}$
by utilizing the
${a}_{jr}^{[L_{1}]}$
by utilizing the
 $x_{i}$
rank obtained from this layer.
$x_{i}$
rank obtained from this layer.
 \begin{equation} X_{i}\left(q.n\right)= \mu {\sum }_{j=1}^{N}\left(x_{i}\right)^{q}{a}_{ji}^{\left[L_{2}\right]}\frac{X_{j\left(q.n\right)}}{k_{j}}+\omega \left(\frac{x_{i}}{\left\langle x\right\rangle }\right)^{n} \end{equation}
 \begin{equation*} k_{j}=\mathit{\max } \left({\sum }_{r=1}^{N}{a}_{jr}^{\left[L_{2}\right]}\left(x_{r}\right)^{q}.1\right) \end{equation*}
 \begin{equation*} \omega =\frac{1}{N}\left[1-\mu +\mu \delta \left({\sum }_{r=1}^{N}{a}_{jr}^{\left[L_{2}\right]}\left(x_{r}\right)^{q}.0\right)X_{i}\left(q.n\right)\right] \end{equation*}
In this expression
 $X_{i}(q.n)$
represents the MPR score of node i in the second (physical) layer, where the ranking is influenced by the first-layer values
$X_{i}(q.n)$
represents the MPR score of node i in the second (physical) layer, where the ranking is influenced by the first-layer values
 $x_{j}$
. The adjacency matrix element
$x_{j}$
. The adjacency matrix element
 ${a}_{jr}^{[L_{2}]}$
encodes connections in
${a}_{jr}^{[L_{2}]}$
encodes connections in
 $L_{2}$
. The
$L_{2}$
. The
 $(x_{i}/\langle x\rangle )^{n}$
is the teleportation term scaled by the average
$(x_{i}/\langle x\rangle )^{n}$
is the teleportation term scaled by the average
 $\langle x\rangle$
of the first-layer PageRank. The normalization
$\langle x\rangle$
of the first-layer PageRank. The normalization
 $\mathit{\max } ({\sum }_{r=1}^{N}{a}_{jr}^{[L_{2}]}(x_{r})^{q}.1)$
ensures stability by avoiding divisions by zero and
$\mathit{\max } ({\sum }_{r=1}^{N}{a}_{jr}^{[L_{2}]}(x_{r})^{q}.1)$
ensures stability by avoiding divisions by zero and
 $\delta (k_{i},0)$
is the Kronecker delta that accounts for isolated nodes. The parameters
$\delta (k_{i},0)$
is the Kronecker delta that accounts for isolated nodes. The parameters
 $q,n\in [0,1]$
regulate the relative influence of these functions.
$q,n\in [0,1]$
regulate the relative influence of these functions.
MPR’s value is dependent on two parameters,
 $q,n\in (0.1)$
, and results in PageRank multiplexing, multiplication, and combination with different values of zero and one.
$q,n\in (0.1)$
, and results in PageRank multiplexing, multiplication, and combination with different values of zero and one.
In this study, we used the MCPR method to construct initial knowledge about nodes based on their importance in the virtual interactions layer and obtained it from the layer’s centrality measures. Unlike the MPR method, which assumes that all layers have the same centrality, the PR method (the best centrality measure for the physical layer) is used to determine the best centrality measure for the virtual layer in the physical layer. Equation (6) introduces the MCPR, which integrates context-specific centralities from both layers:
 \begin{align} x_{i}=\alpha _{A}\sum _{j}A_{ij}\frac{x_{j}}{g_{j}}+\left(1-\alpha _{A}\right)y_{i} \\[-30pt] \nonumber \end{align}
 \begin{equation*} g_{j}=\max \left\{{\sum }_{r=1}^{N}A_{jr},1\right\} \end{equation*}
This equation defines the MCPR score for node i in the physical layer. The first term on the right-hand side corresponds to a PageRank-style update:
 $A_{ij}$
denotes the adjacency matrix entry of the physical layer (
$A_{ij}$
denotes the adjacency matrix entry of the physical layer (
 $L_{2}$
) and
$L_{2}$
) and
 $g_{j}$
represents the degree of node j lower-bounded by one to avoid division by zero. This term is weighted by the damping parameter
$g_{j}$
represents the degree of node j lower-bounded by one to avoid division by zero. This term is weighted by the damping parameter
 $\alpha _{A}\in (0,1)$
controls the probability of following network links. The second term incorporates the prior score
$\alpha _{A}\in (0,1)$
controls the probability of following network links. The second term incorporates the prior score
 $y_{i}$
, derived from the virtual (awareness) layer, and weighted by
$y_{i}$
, derived from the virtual (awareness) layer, and weighted by
 $1-\alpha _{A}$
. In practice
$1-\alpha _{A}$
. In practice
 $y_{i}$
can be computed using a context-appropriate centrality measure (e.g., closeness centrality), thereby injecting awareness-layer importance into the infection-layer ranking.
$y_{i}$
can be computed using a context-appropriate centrality measure (e.g., closeness centrality), thereby injecting awareness-layer importance into the infection-layer ranking.
Because each node receives its initial value from its neighbors in the original nature of PageRank centrality, when the initial value of the nodes is taken from another layer, the value of the nodes in this layer affects the final value of a node in the physical layer and the value of its neighbors.
Each node’s value is proportional to the value of the same node and its neighbors in the previous layer (using any type of centrality measure), the node’s degree, the node’s neighbors’ PageRank, and the node’s neighbors’ inverse degree in the current layer.
4. Simulation results
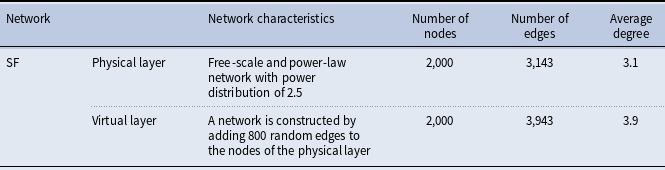
By employing a free-scale network of 2,000 nodes with a P (k) ∼ K –2.5 degree distribution, the simulations are represented as a layer of physical interactions. By adding 800 additional random links to this layer of the network, a virtual interaction layer is created (Pan and Yan, Reference Wang, Andrews, Wu, Wang and Bauch2018; Zweig, Reference Zheng, Xia, Guo and Dehmer2016). The parameters of the data set are listed in Table 4.
Structural features of the applied data

We used network epidemic size to evaluate the efficacy of immunization strategies; for example, a smaller epidemic size indicates a more effective immunization approach. The primary seeds of infected nodes were chosen at random from a pool of 0.2 network nodes. The model presented in Section 2.1 was used to simulate the transmission of infection and awareness within a network. Finally, the epidemic size was calculated using an average of more than 20 runs of the infection and awareness models (Morone and Makse, Reference Zheng, Xia, Guo and Dehmer2015; Santoro and Nicosia, Reference Tortosa, Vicent and Yeghikyan2020).
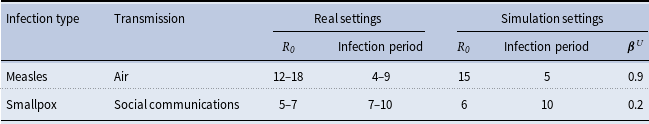
Notably, the type of infection affects the model parameter values. We selected two infections with varying parameters for our simulations. Table 5 summarizes the infections and their associated reproduction numbers (R
0
) used to calculate the infection rate (
 $\beta $
U
) for the proposed model. The infection rate was calculated using Equation (1) (Hartvigsen et al., Reference Granell, Gómez and Arenas2007; Shams and Khansari, Reference Wang, Guo, Sun and Xia2013).
$\beta $
U
) for the proposed model. The infection rate was calculated using Equation (1) (Hartvigsen et al., Reference Granell, Gómez and Arenas2007; Shams and Khansari, Reference Wang, Guo, Sun and Xia2013).
Data on multiple epidemic samples and calculating their corresponding infection rate in the target network

Knowing the network’s topology and flow enables the appropriate centrality measure for determining the nodes in the virtual interaction layer. To better understand this issue, we compared and analyzed five different measures for each node, using the rank obtained from each measure to calculate the physical interactions layer’s PR. To validate the MCPR technique’s results, we compared it to the single-layer PR method and the multiplex MPR method.
We conducted simulations with
 $\varphi$
= 0.8 and α = 0.3 and then examine the effect of changing these parameters on the simulation results.
$\varphi$
= 0.8 and α = 0.3 and then examine the effect of changing these parameters on the simulation results.
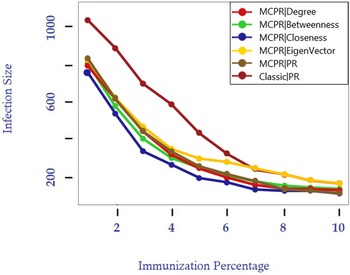
First, we ran a simulation to compare the new MCPR technique to the classical method, randomly selecting 0.2 network nodes as infected nodes solely based on their physical interaction layer relevance. In comparison to the classical technique, this method alters the priority of node selection. These changes in priority were necessary because vaccinated nodes are effectively discarded from the physical interaction layer while remaining effective as nodes that spread awareness in the virtual interaction layer. The network epidemic size was determined after discarding these nodes from the network with an average of more than 20 infection and awareness model implementations. This procedure was repeated for different immunization percentages. As discussed in Section 2.2, simulation results indicated that immunization against classical PageRank centrality is more efficient than immunization against other centralities. As a result, we compared the proposed method to the classical method based on PageRank centrality to determine the slightest difference between the two methods.
Due to the immunization of nodes at the physical interaction layer, it is possible to segment the network, thereby limiting infection spread. As a result, it is critical to have a physical layer. When the differences between nodes are minor, however, information from other layers can be used to make more informed decisions, especially when resources are limited. As a result, the network can be isolated by securing a specified number of nodes at the physical interaction layer. It is possible to incorporate data from additional layers, such as the virtual interaction layer.
To propagate awareness as a flow, we must determine which degree of centrality is the most appropriate for use in the virtual interaction layer. To discern this, we used the MCPR approach with five different centralities to rank the virtual interaction layer.
The simulation results for measles and smallpox were shown in Figures 2 and 3. We have the smallest epidemic size possible if we use close proximity to identify potential awareness nodes. According to the method used to determine the infection transmission rate for knowledgeable individuals, the higher the quality of information spread, the lower the infection transmission rate for aware individuals (Equation 2). As the awareness index increases, the quality of knowledge deteriorates. That is, the more information an individual receives, the higher the likelihood that the information will spread and the less likely the individual will respond to the infection. As a result, the awareness gained by taking a shorter path and passing it on less frequently is critical. A person can become conscious of something in a variety of ways. As a result, the evaluation function updates the individual awareness index with the lowest index value whenever an individual’s awareness reaches a path, as illustrated in Figure 1.
MCPR method vs. conventional method for measles, with the corresponding parameter values in Table 5 for an epidemiological study duration = 100, number of implementations = 20, γ = 0.1,
 $\varphi$
= 0.8, and α = 0.3.
$\varphi$
= 0.8, and α = 0.3.

MCPR method vs. conventional method for smallpox, with the corresponding parameter values in Table 5 for an epidemiological study duration = 100, number of implementations = 20, γ = 0.1,
 $\varphi$
= 0.8, and α = 0.3.
$\varphi$
= 0.8, and α = 0.3.

If the flow follows the shortest paths, the proximity measure can be used. There are two types of processes Relevant to the proximity measure: those that flow along the shortest paths and those that flow along all feasible paths concurrently (Borgatti, Reference Bockholt and Zweig2005).
Given the importance of information quality in our research, the highest level of awareness as a process follows the shortest paths and may be followed simultaneously along with any number of possible paths.
On the other hand, we demonstrated that selecting candidate nodes for knowledge propagation based on the special vector’s centrality does not produce satisfactory results. The centrality of the special vector was calculated by subtracting the importance of each node’s neighbors. Assume that an unimportant node is given the same ranking as its neighbor simply because it is adjacent to an important node. If the simulation is followed, this node is unsuitable for knowledge spread because awareness and its spread are purely haphazard. If an unimportant node is aware of an important node in its proximity, it has the option of sharing its knowledge with the neighboring node. If it shares the information with a critical neighbor, that neighbor can share it with others. However, this insignificant individual or node may prevent it from reaching its critical neighbor for whatever reason. It is possible that such centrality is not the optimal location for locating someone to disseminate information.
Additionally, awareness has a more significant effect on nodes with a higher centrality than on nodes with a lower centrality. Because higher centrality nodes are preferred in centrality calculations, it is predicted that the suggested method will exhibit a greater epidemic drop than the immunization method based on physical interaction layer information at lower immunization percentages. We understand that low immunization rates are critical due to limited resources.
On the network mentioned above, the generalized SIR-UA model was used. We used 100-time units as the length of the epidemic research period and changed the model’s fixed parameters, as shown in Table 5. The infection transmission and recovery rates were altered based on the infection type. The epidemic size was estimated using a generalized SIR-UA model.
The MPR technique, which prioritizes nodes in both the physical and virtual interaction layers, was then used to compare the proposed method to a more recent method.
L1 was used to represent the virtual interaction layer in this work, while L2 represented the physical interaction layer. To compare the MCPR and MPR methods, we used both layers as the initial layer of MPR computations. We simulated the most relevant centrality measure, namely proximity centrality, for the virtual interaction layer.
According to the findings, when the proximity centrality measure for the virtual interaction layer is used, MCPR was more efficient than MPR for network immunization with limited resources. Additionally, it reduced the size of epidemics by 20% compared to the MPR technique (Figure 4).
MCPR method vs. conventional method for smallpox (left) and measles (right) with the corresponding parameter values in Table 5 for an epidemiological study duration = 100, number of implementations = 20, γ = 0.1,
 $\varphi$
= 0.8, and α = 0.3.
$\varphi$
= 0.8, and α = 0.3.

In this study, we chose hybrid MPR because it is more efficient than the other two methods and significantly reduced the size of the epidemic.
5. Empirical validation on the real-world multiplex network
To transcend the controlled environment of synthetic networks and evaluate the MCPR strategy’s performance under realistic conditions, we conducted an empirical validation using a well-documented, real-world multiplex dataset. This step is critical to demonstrate the robustness and practical applicability of our proposed method in the face of the structural complexities and emergent behaviors inherent in genuine human social systems.
5.1 Dataset and experimentation methodology
For this validation, we leveraged the Copenhagen Networks Study dataset (Sapiezynski et al., Reference Sapiezynski, Stopczynski, Lassen and Lehmann2019). This dataset serves as an ideal empirical testbed, offering high-resolution interaction data that naturally resolves into the two-layer structure central to our model:
-
• Physical Interaction Layer (Infection Propagation): Constructed from device-to-device Bluetooth proximity scans, this layer provides a detailed proxy for the face-to-face contacts through which pathogens spread.
-
• Virtual (Awareness) Layer (Information Propagation): Derived from self-reported Facebook friendships, this layer maps the online social ties that facilitate the dissemination of information and awareness.
The raw data was carefully preprocessed to create a two-layer undirected graph. The physical layer’s edges were weighted by the frequency of Bluetooth interactions, with non-participant and environmental signals filtered as per the dataset’s documentation. The virtual layer was established as an unweighted graph representing Facebook connections.
On this multiplex network, we simulated the spread of Measles and Smallpox by using the SIR-UA model. The epidemiological parameters were kept identical to those in our synthetic network experiments Table 5 to ensure comparability. The infection was seeded and transmitted exclusively on the physical layer, while awareness spread concurrently on the virtual layer, modulating the behavior of individuals in the physical domain as detailed in Section 2.1.
5.2. Performance analysis and comparative results
We benchmarked the performance of our proposed MCPR strategy, which uses Closeness centrality for the awareness layer, against the baseline of a classical, single-layer PageRank immunization. The results, presented below, provide compelling empirical support for the advantages of a context-aware, multiplex approach.
5.2.1. Measles simulation
The simulation revealed that for a rapidly spreading pathogen like Measles, the MCPR strategy offers a consistent yet modest enhancement in containment. As illustrated in Figure 5, with a 10% immunization budget, the classical PageRank strategy resulted in a final epidemic size of approximately 1,100. In contrast, our MCPR method reduced this to nearly 1,060, a performance gain of ∼2.2%. This finding is significant as it underscores the utility of incorporating the virtual layer’s structure even when the temporal window for awareness to influence behavior is narrow.
Comparative performance of immunization strategies for the measles epidemic simulation on the Copenhagen networks study dataset.

5.2.2. Smallpox simulation
The strategic advantage of the MCPR method becomes markedly more pronounced when simulating a pathogen with slower transmission dynamics, such as Smallpox. The results, presented in Figure 6, demonstrated a substantial mitigation of the outbreak. With a 10% immunization budget, where classical PageRank contained the epidemic to 1,020 cases, our MCPR method curtailed the final size to approximately 950. This constitutes a significant improvement of 7% over the baseline. This higher performance highlights a critical insight: when disease progression is slower, the awareness dynamics propagating on the virtual layer have a greater opportunity to influence physical behavior, thus amplifying the efficacy of a context-aware immunization strategy.
Comparative performance of immunization strategies for the smallpox epidemic simulation on the Copenhagen networks study dataset.

The empirical validation on the Copenhagen Networks Study dataset provided powerful evidence for the central thesis of this research: the efficacy of an immunization strategy is significantly enhanced by adopting a context-aware, multiplex perspective.
The performance differential observed between the Measles and Smallpox simulations is particularly revealing. It suggests that the value derived from the awareness layer is directly correlated with the temporal dynamics of the pathogen. For slower diseases like Smallpox, the awareness propagation process has a sufficient temporal window to permeate the social network and enact behavioral change. This makes Closeness centrality on the virtual layer a highly effective heuristic for identifying nodes whose immunization yields a dual benefit: direct removal from the infection network and maximized disruption of awareness flow to their contacts. Conversely, for fast-moving epidemics, this effect is diminished but, critically, not eliminated. These findings confirm that MCPR is not merely a theoretical construct effective on idealized networks but a robust and practical method applicable to the inherent complexity of real-world human interaction systems.
6. Analysis of algorithm parameters
To investigate the effect of knowledge transmission rate and information quality on infection size changes, we conducted comprehensive parameter sensitivity analyses using both synthetic networks and real-world datasets. This dual method validates our findings across different network topologies and provides robust evidence for the MCPR method’s effectiveness.
6.1. Synthetic network parameter analysis
Using the synthetic scale-free networks described in Section 4, we first examined the fundamental parameter sensitivities. We varied the values of knowledge transmission rate and information quality in discrete intervals to understand their individual and combined effects on epidemic control.
Figures 7 and 8 illustrate the effect of changes in awareness transmission rate (α) for smallpox and measles, respectively. As demonstrated, the total number of infected individuals decreases as the rate of information transmission increases throughout the infection. For both diseases, higher α values consistently improve epidemic control, with the effect being more pronounced for smallpox due to its slower transmission dynamics.
Results of modifying the rate of information transfer for smallpox in order to reduce the size of the epidemic, using the corresponding parameter values from Table 5 for an epidemiological study duration of =100, number of implementations = 20, γ = 0.1, and
 $\varphi$
= 0.8.
$\varphi$
= 0.8.

Figures 9 and 10 present the results of altering the information quality parameter (
 $\varphi$
) for smallpox and measles, respectively. The epidemic size decreases more rapidly at larger
$\varphi$
) for smallpox and measles, respectively. The epidemic size decreases more rapidly at larger
 $\varphi$
values, with the reduction being greatest at
$\varphi$
values, with the reduction being greatest at
 $\varphi$
= 0.9 for both diseases. As previously stated, an individual susceptible to infection who is adjacent to an infected individual and has an awareness level of i will contract the infection at a rate of
$\varphi$
= 0.9 for both diseases. As previously stated, an individual susceptible to infection who is adjacent to an infected individual and has an awareness level of i will contract the infection at a rate of
 $(1-\varphi^i)\beta^U$
. When high-quality information is provided, infection incidence can be minimized through preventive measures.
$(1-\varphi^i)\beta^U$
. When high-quality information is provided, infection incidence can be minimized through preventive measures.
6.2. Parameter analysis on realistic network
To validate our parameter analysis findings on realistic network structures, we conducted comprehensive testing using the Copenhagen Networks Study dataset introduced in Section 5. This real-world validation provides crucial evidence that our synthetic network findings translate effectively to actual social network topologies.
6.2.1. Information quality analysis
Figures 11 and 12 present the information quality parameter analysis for measles and smallpox on the Copenhagen dataset, respectively. The real-world network demonstrates consistent trends with synthetic results while revealing the practical implications of network heterogeneity.
Results of modifying the rate of information transfer for measles in order to reduce the size of the epidemic, using the corresponding parameter values from Table 5 for an epidemiological study duration of =100, number of implementations = 20, γ = 0.1, and
 $\varphi$
= 0.8.
$\varphi$
= 0.8.

For Measles Classical PageRank achieves approximately 1,100 infections at 10% immunization, while MCPR with
 $\varphi$
= 0.9 reduces this to 1,070 cases, representing a 2.7% improvement. The relatively modest gains reflect the rapid transmission dynamics characteristic of measles, where the temporal window for awareness-driven behavioral change remains limited even in real social networks.
$\varphi$
= 0.9 reduces this to 1,070 cases, representing a 2.7% improvement. The relatively modest gains reflect the rapid transmission dynamics characteristic of measles, where the temporal window for awareness-driven behavioral change remains limited even in real social networks.
Results of altering the information quality rate for smallpox to reduce the epidemic size, with an epidemiological study duration = 100, number of implementations = 20, γ = 0.1, α = 0.3, and the corresponding parameter values in Table 5.

Results of altering the information quality rate for measles to reduce the epidemic size, with epidemiological study duration = 100, number of implementations = 20, γ = 0.1, α = 0.3, and the corresponding parameter values in Table 5.

For Smallpox MCPR with
 $\varphi$
= 0.9 achieves 940 infections compared to Classical PageRank’s 1,030 at 10% immunization, yielding an 8.7% reduction. This enhanced performance demonstrates how slower disease progression allows higher-quality information to more effectively influence protective behaviors, with the effect being amplified in realistic network structures.
$\varphi$
= 0.9 achieves 940 infections compared to Classical PageRank’s 1,030 at 10% immunization, yielding an 8.7% reduction. This enhanced performance demonstrates how slower disease progression allows higher-quality information to more effectively influence protective behaviors, with the effect being amplified in realistic network structures.
Results of altering the information quality parameter (
 $\varphi$
) for measles to reduce the epidemic size on the Copenhagen networks study dataset, with epidemiological study duration = 100, number of implementations = 20, γ = 0.1, α = 0.3, and the corresponding parameter values in Table 5.
$\varphi$
) for measles to reduce the epidemic size on the Copenhagen networks study dataset, with epidemiological study duration = 100, number of implementations = 20, γ = 0.1, α = 0.3, and the corresponding parameter values in Table 5.

Results of altering the information quality parameter (
 $\varphi$
) for smallpox to reduce the epidemic size on the copenhagen networks study dataset, with epidemiological study duration = 100, number of implementations = 20, γ = 0.1, α = 0.3, and the corresponding parameter values in Table 5.
$\varphi$
) for smallpox to reduce the epidemic size on the copenhagen networks study dataset, with epidemiological study duration = 100, number of implementations = 20, γ = 0.1, α = 0.3, and the corresponding parameter values in Table 5.

Results of modifying the awareness transmission rate (α) for measles to reduce the epidemic size on the Copenhagen networks study dataset, with epidemiological study duration = 100, number of implementations = 20, γ = 0.1,
 $\varphi$
= 0.8, and the corresponding parameter values in Table 5.
$\varphi$
= 0.8, and the corresponding parameter values in Table 5.

Results of modifying the awareness transmission rate (α) for smallpox to reduce the epidemic size on the Copenhagen networks study dataset, with epidemiological study duration = 100, number of implementations = 20, γ = 0.8,
 $\varphi$
= 0.8, and the corresponding parameter values in Table 5.
$\varphi$
= 0.8, and the corresponding parameter values in Table 5.

6.2.2. Awareness transmission rate analysis
Figures 13 and 14 examine the effects of varying awareness transmission rate (α) values on the Copenhagen dataset for measles and smallpox, respectively. These results reveal even stronger parameter sensitivity than observed in synthetic networks.
For Measles MCPR with α = 0.9 achieves approximately 950 infections compared to 1,020 infections for Classical PageRank at 10% immunization, representing a 6.9% improvement. The steeper gradient observed with α variations suggests that the rate of awareness dissemination has a more immediate impact than information quality for rapidly spreading diseases, particularly in realistic social structures.
For Smallpox the improvement is even more substantial, with MCPR α = 0.9 reducing infections to 760 compared to 840 infections for Classical PageRank, yielding a 9.5% improvement. The convergence of MCPR curves at higher immunization percentages indicates that awareness transmission becomes less critical when sufficient immunization coverage is achieved.
6.3. Discussion on cross-dataset parameters
The comparative analysis across synthetic and real-world datasets reveals that awareness transmission rate (α) consistently exerts stronger influence on epidemic outcomes than information quality (
 $\varphi$
), particularly for rapidly spreading diseases. This finding holds robustly across different network topologies, confirming that the velocity of awareness dissemination may be more critical than information fidelity in emergency response scenarios.
$\varphi$
), particularly for rapidly spreading diseases. This finding holds robustly across different network topologies, confirming that the velocity of awareness dissemination may be more critical than information fidelity in emergency response scenarios.
The real-world Copenhagen dataset generally shows larger effect sizes than synthetic networks, likely due to the heterogeneous clustering patterns and community structures inherent in actual social networks. This validates that MCPR’s advantages are not merely artifacts of idealized network models but are enhanced in realistic social structures.
As demonstrated across both datasets, the larger the constant values of
 $\varphi$
and α, the greater the difference between the proposed and classical methods, and thus the smaller the pandemic. As these parameters increase, the virtual interaction layer becomes increasingly critical for knowledge dissemination, making the proposed method more efficient compared to classical methods.
$\varphi$
and α, the greater the difference between the proposed and classical methods, and thus the smaller the pandemic. As these parameters increase, the virtual interaction layer becomes increasingly critical for knowledge dissemination, making the proposed method more efficient compared to classical methods.
7. Conclusions and future work
This study underscores the importance of the context functional to multiplex networks, which, in turn, shapes the identification of key nodes for immunization. Leveraging a two-layer network with disease spreading and awareness propagation features, we showed that each layer requires a distinct centrality measure: PageRank works best in the infection (physical) layer, gripping its potential in minimizing epidemic size, while closeness centrality performed better for supporting awareness flow in the virtual layer.
With that insight in mind, we proposed the MCPR method to inject centralities from both layers into a composite score to rank nodes for immunization. Simulation results incorporating measles and smallpox scenarios found that MCPR performed better than classical single-layer PageRank immunization and other multiplex ranking methods (e.g., MPR), particularly at lower immunization rates a crucial scenario when resources are scarce.
The effectiveness of our method was further validated through empirical testing on the Copenhagen Networks Study dataset, demonstrating that the advantages observed in synthetic networks translate effectively to real-world social structures with even more pronounced benefits. Specifically, on the real-world dataset, MCPR achieved a 2.2% improvement for measles and a substantial 7% improvement for smallpox compared to classical PageRank at 10% immunization coverage, with optimal parameter configurations (α = 0.9,
 $\varphi$
= 0.9) yielding even greater performance gains of up to 9.5% for awareness transmission rate optimization alone. Of particular significance was that the greater the rate of transmission of information, and the greater the quality of information (reflected in a larger awareness-index parameter), the greater the benefit of our method, illustrating the synergistic effect of combining infection and awareness dynamics.
$\varphi$
= 0.9) yielding even greater performance gains of up to 9.5% for awareness transmission rate optimization alone. Of particular significance was that the greater the rate of transmission of information, and the greater the quality of information (reflected in a larger awareness-index parameter), the greater the benefit of our method, illustrating the synergistic effect of combining infection and awareness dynamics.
These results demonstrate that MCPR outperforms both single-layer PageRank immunization and the existing MPR method, effectively reducing epidemic size by 30–37% over single-layer strategies and 13–19% over MPR implementations in limited immunization budgets. The real-world validation confirms these findings with measles epidemic reductions from 1,100 to 950 infections and smallpox reductions from 1,020 to 760 infections under optimal parameter settings, demonstrating practical applicability beyond synthetic network assumptions. These findings highlight the need for proper context-based centrality selection and for awareness layers in addressing immunization strategies on multiplex networks.
Incorporating layer-specific contexts in centrality definitions lays the groundwork for targeted immunization. Future research may focus on additional layers, inter-layer interactions, and finer behavioral assumptions, and eventually, real-world datasets once they become available. We hope that the context-centric method to multiplex network analysis described here inspires further developments in both theoretical modeling and practical strategies for epidemic containment.
Supplementary material
The supplementary material for this article can be found at https://doi.org/10.1017/nws.2026.10026.
Data availability statement
The data that support the findings of this study are available from the corresponding author, Mohammad Khansari, upon reasonable request.
Funding statement
This research received no specific grant from any funding agency, commercial or not-for-profit sectors.
Competing interests
The author(s) declare none


 Open access