


1. Introduction
Suppose an NGO would like to launch a drug prevention campaign in schools or a politician competes for votes in towns. Due to limited resources, only few high schools can be visited in the prevention campaign or few speeches can be held before elections. How should they select a handful set of audiences to achieve the widest reach through word-of-mouth?
Targeting individuals in a marketing campaign to trigger a cascade of influence has been in the spotlight of research in the past two decades. In their seminal paper, Kempe et al. (Reference Kempe, Kleinberg and Tardos2003) formulate the Influence Maximization problem (IM) as follows: Given a diffusion model $D$
, a network
$D$
, a network $G$
and a positive integer
$G$
and a positive integer $k$
, find the most influential
$k$
, find the most influential $k$
nodes in
$k$
nodes in $G$
whose activation results in the largest spread in the network.
$G$
whose activation results in the largest spread in the network.
However, it is less understood how the IM method can be applied in traditional marketing settings, like public event organization. Marketing campaigns typically include group targeting in the form of commercials or public events but the message of these potentially spreads further in the social networks of the initial audience (Shi et al., Reference Shi, Wang, Chen, Feng and Chen2019; Yan et al., Reference Yan, Huang, Gao, Lu and He2017; Saleem et al., Reference Saleem, Kumar, Calders, Xie and Pedersen2017).
Motivated by the frequent combination of target group selection and viral marketing, which is difficult to address in the original IM setting, we formulate the Audience Selection (AS) problem. Given a diffusion model $D$
, a network
$D$
, a network $G=(V,E)$
and an activation mechanism
$G=(V,E)$
and an activation mechanism $f:2^V\rightarrow 2^V$
assess the collection of possible node sets (audiences)
$f:2^V\rightarrow 2^V$
assess the collection of possible node sets (audiences) $S_i \subset V,\ i=1,\dots,n$
according to the spread that their activation generates in order to find
$S_i \subset V,\ i=1,\dots,n$
according to the spread that their activation generates in order to find $S_{\hat{i}}$
of maximum spread. We pose no restriction on the subsets, they might be of varying sizes and some might even overlap. At the beginning of the campaign, one
$S_{\hat{i}}$
of maximum spread. We pose no restriction on the subsets, they might be of varying sizes and some might even overlap. At the beginning of the campaign, one $S_i$
is targeted. The activation mechanism denotes the individuals
$S_i$
is targeted. The activation mechanism denotes the individuals $f(S_i)\subseteq S_i$
who were successfully persuaded to participate in the campaign. The diffusion model is applied on
$f(S_i)\subseteq S_i$
who were successfully persuaded to participate in the campaign. The diffusion model is applied on $f(S_i)$
, and the influence spread is determined.
$f(S_i)$
, and the influence spread is determined.
Note that $f$
and
$f$
and $D$
are different in nature. The activation mechanism is the result of a campaign event that consists of various marketing elements (speeches, ads, or distributed product samples), while the diffusion mechanism imitates the personal interactions between users, commonly referred to as word-of-mouth.
$D$
are different in nature. The activation mechanism is the result of a campaign event that consists of various marketing elements (speeches, ads, or distributed product samples), while the diffusion mechanism imitates the personal interactions between users, commonly referred to as word-of-mouth.
In the AS problem, we do not seek to construct the best seed set, but to compare available seed sets. Each $S_i$
set represents an audience that could be reached through a campaign involving several public events. There are two inherent difficulties involved. Firstly, the number of sets that need to be evaluated can be astronomical. Secondly, the seed sets are relatively large and contain a wide variety of people—not only opinion leaders, but ordinary folk too.
$S_i$
set represents an audience that could be reached through a campaign involving several public events. There are two inherent difficulties involved. Firstly, the number of sets that need to be evaluated can be astronomical. Secondly, the seed sets are relatively large and contain a wide variety of people—not only opinion leaders, but ordinary folk too.
Although ordinary individuals do not have much influence on their own, they can be pivotal collectively. This stands in contrast to influencers, who in turn can be powerful even if there are only a few of them. The roles of both groups are illustrated by Wang et al. (Reference Wang, Lan and Xiao2019) who found that complex news stories spread much more effectively via “ordinary people.” Influencers only play an important role in disseminating simple messages.
In order to evaluate the potential of the possible audiences we need to understand what ordinary agents bring to the table. Influence in networks can be proxied by the centrality of the individuals, but certain centrality indices might be better in ranking ordinary agents than others. Put it differently, an influence measure that is successful in identifying the best spreaders on the whole node set might be less efficient in classifying agents of average or low influence.
In this paper, we devise a statistical test to uncover the real ranking of influence maximization proxies under the AS model. The situation is somewhat similar to polling. When a survey agency wants to predict the outcome of an election it takes a random, representative sample from the population. Our aim is to observe the performance of the measures on “average” nodes; thus, we will take samples from the node set, then compare the obtained results using a novel comparative test method: Sum of Ranking Differences (SRD or Héberger test).
SRD ranks competing solutions based on a reference point. It originates from chemistry where various properties of a substance measured in different laboratories (or by various methods) need to be compared (Héberger, Reference Héberger2010; Héberger and Kollár-Hunek, Reference Héberger and Kollár-Hunek2011). SRD is rapidly gaining popularity in various fields of applied science such as analytical chemistry (Andrić, Reference Andrić2018), pharmacology (Ristovski et al., Reference Ristovski, Janković, Borčić, Jain, Bugarčić and Mikov2018), decision-making (Lourenço and Lebensztajn, Reference Lourenço and Lebensztajn2018), machine learning (Moorthy et al., Reference Moorthy, Kumar and Poongavanam2017), political science (Sziklai and Héberger, Reference Sziklai and Héberger2020), and even sports (West, Reference West2018).
Our test method is devised as follows. Let us suppose that the diffusion model $D$
and the network
$D$
and the network $G$
are fixed. We take samples from the node set of
$G$
are fixed. We take samples from the node set of $G$
. For the sake of simplicity, we assume that the activation function is the identity function,
$G$
. For the sake of simplicity, we assume that the activation function is the identity function, $f(S)=S$
; thus, every user in the sample is activated. Although this is unrealistic in real campaigns, it is equivalent to the case of taking a bigger sample and activating only a fraction of the users. Since, in this paper, we will work with random samples, there is no difference between the two approaches.
$f(S)=S$
; thus, every user in the sample is activated. Although this is unrealistic in real campaigns, it is equivalent to the case of taking a bigger sample and activating only a fraction of the users. Since, in this paper, we will work with random samples, there is no difference between the two approaches.
We run the diffusion model with these samples as input and observe their performance, the latter will serve as a reference ranking for SRD. Then, we calculate the influence maximization proxies on the whole network. We aggregate the proxy values for each node in the sample sets. This induces a ranking among the samples: different proxies will prefer different sample sets. Finally, we compare the ranking of the sample sets made by the proxies with the reference ranking. The measured distances (SRD scores) show which proxies are the closest to the reference, that is, the most effective in predicting the spreading potential of the different audiences.
We contribute to the literature in two ways. First, we introduce the Audience Selection problem and show that it is inherently different from the Influence Maximization problem. Second, we apply a new statistical test, Sum of Ranking Differences, which enables us to compare network centrality measures. We test the efficacy of different network centralities in a social network environment under both the AS and IM frameworks.
2. Literature and research problem
Social networks became important elements of marketing campaigns. Targeting individuals based on their position in the network and their capacity to influence others is an essential marketing tool and an active area of network science (Aral, Reference Aral2011; Watts and Dodds, Reference Watts and Dodds2007). However, marketing strategies often focus on communities and not on individuals. For example, health interventions target specific groups and by changing their behavior also aim to have a wider impact that can spread in the network (Gold et al., Reference Gold, Pedrana, Sacks-Davis, Hellard, Chang, Howard and Stoove2011). Similarly, a frequently used technique of brand management is the identification of communities of customers that engage with the brand and can also influence others (Gensler et al., Reference Gensler, Völckner, Liu-Thompkins and Wiertz2013).
Here we argue that the market segmentation and influence maximization techniques should be combined in marketing campaigns run on social networks. However, such an endeavor requires a better understanding of what groups of individuals should be selected for targeting such that social influence is maximized. To demonstrate this research niche, we shortly review grouping techniques and then introduce the research niche in group targeting.
2.1 Grouping for targeting
Identifying the groups of influential individuals is a widely used technique in social network targeting. One line of literature explores how network communities, groups of nodes that are densely connected within and loosely connected across groups, interconnect and influence each other. Yan et al. (Reference Yan, Huang, Gao, Lu and He2017) introduce a statistical method to reveal the influence relationship between communities, based on which they propose a propagation model that can dynamically calculate the scope of influence spread of seed groups. Rahimkhani et al. (Reference Rahimkhani, Aleahmad, Rahgozar and Moeini2015) identify the community structures of the input graph, select the most influential communities, then choose a number of representative nodes based on the result. Weng et al. (Reference Weng, Menczer and Ahn2014) predict which memes will be successful in spreading using the network and the community structure. Hajdu et al. (Reference Hajdu, Bóta, Krész, Khani and Gardner2020) study passenger travel behavior to reveal passenger groups that travel together on a given day and model epidemic spreading risk among passengers.
Co-location of individuals is also used by many to group the users for targeting. Li et al. (Reference Li, Chen, Feng, Tan and Li2014) examine the challenge of providing new companies (e.g., restaurants) with marketing services by locating their potential customers in a region. Similarly, Song et al. (Reference Song, Hsu and Lee2016) investigate a departmental sales event where the store’s location plays a significant role in the campaign. In this scenario, individuals residing far away from the store are unlikely to be affected by the promotional efforts. Both papers aim to find $k$
users who can maximize the number of influenced users within a specific geographical region.
$k$
users who can maximize the number of influenced users within a specific geographical region.
An alternative spatial approach is presented by Cai et al. (Reference Cai, Yan and Li2016) who propose a two-layered graph framework, where one layer represents the social network and the other layer connects users who are geographically close. In this framework, particular events (e.g., exhibitions, advertisements, or sports meetings) take place in the physical world and influence multiple users located near the event’s position. These influenced users then have the potential to propagate the event further by sharing it with their friends in online social networks or with their neighbors in the physical world. Similarly, Shi et al. (Reference Shi, Wang, Chen, Feng and Chen2019) consider influence maximization from an online-offline interactive setting. They propose the location-driven Influence Maximization problem, which aims to find the optimal offline deployment of locations and durations to hold events subject to a budget, so as to maximize the online influence spread. Saleem et al. (Reference Saleem, Kumar, Calders, Xie and Pedersen2017) use geo-tagged activity data and track how users are navigating between locations and based on this information they select the most influential locations.
2.2 Audience Selection: a niche for methodological development
Targeting groups of individuals is fundamentally different from targeting influential individuals. Here, the task is to select an audience of the message that can be composed of highly influential persons and of less influential ones.
We have found only one paper, that explicitly addresses the problem of group targeting. Eftekhar et al. (Reference Eftekhar, Ganjali and Koudas2013) consider a billboard campaign that targets groups. The advertiser is allowed to select $k$
locations (that is,
$k$
locations (that is, $k$
groups) for the campaign. The individuals in the groups are activated with a certain probability. This so-called Fine-Grained Group Diffusion Model (FGD) has a similar mathematical framework as ours, although our formulation, that we will introduce in Section 3, is more general. For instance, Audience Selection can model when either three campaign events can be organized on the East coast or four on the West coast, but it is impossible to formulate this as an FGD.
$k$
groups) for the campaign. The individuals in the groups are activated with a certain probability. This so-called Fine-Grained Group Diffusion Model (FGD) has a similar mathematical framework as ours, although our formulation, that we will introduce in Section 3, is more general. For instance, Audience Selection can model when either three campaign events can be organized on the East coast or four on the West coast, but it is impossible to formulate this as an FGD.
The statistical assessment of the quality of group targeting is even scarcer. The comparison of centrality measures is accomplished by Perra and Fortunato (Reference Perra and Fortunato2008) who analyze the rankings of nodes of real graphs for different diffusion algorithms. Their focus is on spectral measures such as PageRank and HITS and they adopt Kendall’s $\tau$
index to calculate their pairwise correlation. However, they do not validate their results by ground truth of diffusion. On the other hand, the robustness of centrality measures has been studied, see Martin and Niemeyer (Reference Martin and Niemeyer2019) and the references therein. Here we propose the SRD ranking method, introduced in detail in Section 4, that can assess the quality of Audience Selection and thus can provide new insights for group targeting. SRD scores and distribution can be generated by rSRD, an
$\tau$
index to calculate their pairwise correlation. However, they do not validate their results by ground truth of diffusion. On the other hand, the robustness of centrality measures has been studied, see Martin and Niemeyer (Reference Martin and Niemeyer2019) and the references therein. Here we propose the SRD ranking method, introduced in detail in Section 4, that can assess the quality of Audience Selection and thus can provide new insights for group targeting. SRD scores and distribution can be generated by rSRD, an $\textsf{R}$
package written by Staudacher et al. (Reference Staudacher, Sziklai, Olsson, Horn, Pothmann, Ali Tugay Sen and Héberger2023) and downloadable from the Comprehensive R Archive Network. For the reliability of the employed cross-validation technique, see Sziklai et al. (Reference Sziklai, Baranyi and Héberger2022).
$\textsf{R}$
package written by Staudacher et al. (Reference Staudacher, Sziklai, Olsson, Horn, Pothmann, Ali Tugay Sen and Héberger2023) and downloadable from the Comprehensive R Archive Network. For the reliability of the employed cross-validation technique, see Sziklai et al. (Reference Sziklai, Baranyi and Héberger2022).
3. Audience Selection vs Influence Maximization
Since the proposed problem of Audience Selection is closely related to Influence Maximization, it is worth to explore the differences between the two approaches. Let us consider a small example in which grouping is based on co-location of individuals. Figure 1 depicts a social network with additional geographic information. Colors signify different locations, say towns. Each town has three inhabitants (agents). Red agents are all connected to all the orange and blue agents. The top green agent is connected to all the orange agents and two blue ones, while the bottom green is connected to all the blue agents and two orange. Finally, the middle green agent is connected to all the pink agents.
Sketch of a social network with five geographical locations (red, orange, blue, green, and pink) each accommodating three agents.

In the Audience Selection problem, we have to find the most suitable locations for a series of marketing events. Agents corresponding to the same location can be reached simultaneously. Let us assume that the linear threshold diffusion model (a standard choice in the literature, see details in Section 5) adequately represents influence spreading in this network. In our example, one event is organized and every user is activated at the selected location. Which town should be chosen?
Formulating the question like this, we are asking which town provides the best audience. In contrast, the Influence Maximization problem tries to find the $k$
most pivotal agents in a diffusion.
$k$
most pivotal agents in a diffusion.
Let us try to answer our questions from the perspective of Influence Maximization. Since each town accommodates three agents, let us fix $k=3$
. Kempe et al. (Reference Kempe, Kleinberg and Tardos2003) proposed a greedy algorithm to approximate the best set of
$k=3$
. Kempe et al. (Reference Kempe, Kleinberg and Tardos2003) proposed a greedy algorithm to approximate the best set of $k$
agents. Since then, many clever heuristics have been invented to improve either the approximation or the running time of the greedy algorithm. However, for such a small example we do not need sophisticated techniques. We can try each combination of agent triplets in a diffusion simulation. It turns out that choosing any two of the red agents, and the middle green agent is the best: On average, they can reach (activate) 78.6% of the nodes.
$k$
agents. Since then, many clever heuristics have been invented to improve either the approximation or the running time of the greedy algorithm. However, for such a small example we do not need sophisticated techniques. We can try each combination of agent triplets in a diffusion simulation. It turns out that choosing any two of the red agents, and the middle green agent is the best: On average, they can reach (activate) 78.6% of the nodes.
Since the majority of the most influential agents are red, we are inclined to choose the red town. However, that would be a mistake. Green agents can activate on average 74.0% of all the nodes, while red agents only score 63.6%. Thus, the green town outperforms the red one by a hefty 10%.
Let us approach the question from another angle. Influence Maximization techniques often suffer from computational limitations. It is difficult to even approximate a suitable $k$
set for a huge network. The usual workaround is to use proxy measures, that is, network centralities that were designed to find influential spreaders. For instance, we may calculate the average PageRank value of each agent in a town (for definition and discussion of network centralities, see Section 6). Table 1 contains the PageRank values as well as the Harmonic centrality of each node. It also lists the average centrality values for each town.
$k$
set for a huge network. The usual workaround is to use proxy measures, that is, network centralities that were designed to find influential spreaders. For instance, we may calculate the average PageRank value of each agent in a town (for definition and discussion of network centralities, see Section 6). Table 1 contains the PageRank values as well as the Harmonic centrality of each node. It also lists the average centrality values for each town.
The PageRank values and Harmonic centrality of the social network depicted in Figure 1. Agents are referred as $x_i$
, where
$x_i$
, where $x$
denotes the first letter of the towns’ color (red, orange, blue, green, pink,) and
$x$
denotes the first letter of the towns’ color (red, orange, blue, green, pink,) and $i$
denotes the agents location in the town (top, middle, bottom). Bold numbers represent the maximum value among towns
$i$
denotes the agents location in the town (top, middle, bottom). Bold numbers represent the maximum value among towns

PageRank correctly predicts the potential of the towns, in the sense, that larger PageRank values correspond to greater spreading capabilities. Harmonic centrality is far less effective, as it ranks the town with the best audience as the second worst.
From this small example, we can deduce a couple of interesting points.
-
• Influence Maximization techniques are ineffective in comparing sets of nodes, because the most influential agents might be spread over different sets.
-
• Although some sets contain less influential agents (top and bottom green agents are less influential than any of the red ones), as a group they might be more effective than any other.
-
• Aggregating network centralities at a set level can be a good predictor of the sets’ spreading potential.
-
• Some centrality measures are more effective than others. Their performance might also vary depending on the underlying graph structure and the applied diffusion model.
Based on these observations, we can formulate a hypothesis. We expect to observe a discrepancy between the rankings of the best Influence Maximization proxies and the best algorithms for the Audience Selection problem. In the next section, we will describe the ranking frameworks and present our hypothesis formally. To avoid inferring too much from a small example, we test our hypothesis on two real-life social networks.
Note that the best way to uncover the potential of an audience is by simulation. However, this might be prohibitive for various reasons. Running diffusion simulations are costly, especially since we have to do it many times—often on a very large network too—to get a reliable estimate of the set’s spreading potential.
But the real difficulty comes from the cardinality of the sets rather than the running time of one simulation. If a marketing campaign consists of a series of events, each tied to a different location, the number of sets we need to assess can grow excessively. For instance, if we have to pick five towns among 100, that already means more than 75 million combinations that each need an evaluation by simulation. Calculating influence proxy measures, that is, network centralities that were specifically designed with the underlying problem in mind, is a much cheaper and sometimes the only feasible solution. In the example at hand, the analyst would select the five towns with the highest average node centrality.
4. Methodology
In this section—following a brief overview of the data and the SRD method—we introduce our hypothesis and the proposed testing framework.
4.1 Data
For demonstration, we use two real-life social networks. iWiW was the most widely used social network in Hungary before the era of Facebook (Lengyel et al., Reference Lengyel, Bokányi, Di Clemente, Kertész and González2020). Over its life cycle, it had more than 3 million subscribers (nearly one-third of the population of Hungary) who engaged in over 300 million friendship ties. For computational reasons, we use a 10% sample of the node set of this network chosen uniformly at random but stratified by towns and network community structure. Pokec is a Slovakian dating and chatting website. Similarly, we took a random sample of the users of Pokec.
The iWiW graph sample contains 271,913 users and 2,712,587 friendship ties, while the Pokec is somewhat scarcer featuring 277,695 nodes and 2,122,778 edges. The iWiW dataset is accessible upon request from the Databank of the HUN-REN Centre of Economic and Regional Studies,Footnote 1 while the Pokec dataset is downloadable from the Stanford Large Network Dataset Collection.Footnote 2
4.2 SRD
SRD is a statistical test method that compares solutions via a reference. The input of an SRD analysis is an $n \times m$
matrix where the first
$n \times m$
matrix where the first $m-1$
columns represent the methods we would like to compare, while the rows stand for the different input instances of the solutions. In our context, columns are centrality measures (influence proxies) and the rows are the samples we have taken from the node set (potential audiences). The last column of the matrix has a special role. It contains the benchmark values, called references, which form the basis of comparison. From the input matrix, we compose a ranking matrix by replacing each value in a column—in order of magnitude—by its rank. Ties are resolved by fractional ranking, i.e., by giving each tied value the arithmetic average of their ranks. SRD values are obtained by computing the Manhattan distances (or
$m-1$
columns represent the methods we would like to compare, while the rows stand for the different input instances of the solutions. In our context, columns are centrality measures (influence proxies) and the rows are the samples we have taken from the node set (potential audiences). The last column of the matrix has a special role. It contains the benchmark values, called references, which form the basis of comparison. From the input matrix, we compose a ranking matrix by replacing each value in a column—in order of magnitude—by its rank. Ties are resolved by fractional ranking, i.e., by giving each tied value the arithmetic average of their ranks. SRD values are obtained by computing the Manhattan distances (or $\ell _1$
-norm) between the column ranks and the reference ranking. In our paper, the reference values are given externally (they are the average spread of the sample sets in the simulation), but in some applications, the reference values are extracted from the first
$\ell _1$
-norm) between the column ranks and the reference ranking. In our paper, the reference values are given externally (they are the average spread of the sample sets in the simulation), but in some applications, the reference values are extracted from the first $m-1$
columns, this process is called data fusion (Willett, Reference Willett2013). Depending on the type of data, this can be done by a number of ways (taking the average, median, or minimum/maximum). Since we have an external benchmark, we do not delve into the intricacies of data fusion. A more detailed explanation with a numerical example can be found in Sziklai and Héberger (Reference Sziklai and Héberger2020).
$m-1$
columns, this process is called data fusion (Willett, Reference Willett2013). Depending on the type of data, this can be done by a number of ways (taking the average, median, or minimum/maximum). Since we have an external benchmark, we do not delve into the intricacies of data fusion. A more detailed explanation with a numerical example can be found in Sziklai and Héberger (Reference Sziklai and Héberger2020).
SRD values are normalized by the maximum possible distance between two rankings of size $n$
. In this way, SRD values corresponding to problems of different sizes can be compared. A small SRD score indicates that the solution is close to the reference (ranks the rows almost or entirely in the same order as the latter). The differences in SRD values induce a ranking between the solutions. SRD calculation is followed by two validation steps.
$n$
. In this way, SRD values corresponding to problems of different sizes can be compared. A small SRD score indicates that the solution is close to the reference (ranks the rows almost or entirely in the same order as the latter). The differences in SRD values induce a ranking between the solutions. SRD calculation is followed by two validation steps.
-
i. The permutation test (sometimes called randomization test, denoted by CRRN = comparison of ranks with random numbers) shows whether the rankings are comparable with a ranking taken at random. SRD values follow a discrete distribution that depends on the number of rows and the presence of ties. If $n$
exceeds 13 and there are no ties, the distribution can be approximated with the normal distribution. By convention, we accept those solutions that are below 0.05, that is, below the 5% significance threshold. Between 5% and 95% solutions are not distinguishable from random ranking, while above 95% the solution seems to rank the objects in a reverse order (with 5% significance).
$n$
exceeds 13 and there are no ties, the distribution can be approximated with the normal distribution. By convention, we accept those solutions that are below 0.05, that is, below the 5% significance threshold. Between 5% and 95% solutions are not distinguishable from random ranking, while above 95% the solution seems to rank the objects in a reverse order (with 5% significance). -
ii. The second validation option is called cross-validation and assigns uncertainties to the SRD values. Cross-validation enables us to statistically test whether two solutions are essentially the same or not, that is, whether the induced column rankings come from the same distribution. We assume that the rows are independent in the sense that removing some rows from the matrix does not change the values in the remaining cells (in our setting this is trivially true). Cross-validation proceeds by taking
$\ell$
samples from the rows and computing the SRD values for each subset. Different cross-validation techniques (Wilcoxon, Dietterich, Alpaydin) sample the rows in different ways (Sziklai et al., Reference Sziklai, Baranyi and Héberger2022). Here we opted for 8-fold cross-validation coupled with the Wilcoxon matched pair signed rank test (henceforward Wilcoxon test). For small row sizes
$(n\le 7)$
leave-one-out cross-validation is applied, each row is left out once. For larger row sizes (as in this paper), a reasonable choice is leaving out
$\lceil n/\ell \rceil$
rows uniformly and randomly in each fold. The obtained SRD values are then compared with the Wilcoxon test with the usual significance level of 5% for each pair of solutions.


4.2.1 Example
Table 2 features a toy example. Suppose we would like to compare two solutions along five input instances for which we have reference values. The input table shows how the two solutions perform according to the different data. The ranking matrix converts these values to ranks. Note that there is a three-way tie for Solution 2. Since these are the 2nd, 3rd, and 4th largest values in that column, they all get the average rank of 3. Similarly, in the reference column the 3rd and 4th largest value coincide, thus they get an average rank of 3.5.
SRD computation. nSRD stands for normalized SRD

We compute the SRD scores by calculating the distances between the ranking vectors of the solution vector and the reference ranking vector in $\ell _1$
-norm. For the first solution, this is calculated as follows:
$\ell _1$
-norm. For the first solution, this is calculated as follows:
 \begin{equation*}6=|1-2|+|2-1|+|3-5|+|5-3.5|+|4-3.5|.\end{equation*}
The maximum distance between two rankings that rank objects from 1 to 5 is 12. Thus, we divided the SRD scores by 12 to obtain the normalized SRD values. In the permutation test, we compare these values to the 5% thresholds of the discrete distribution that SRD follows. For $n=5$
, we accept those solutions (with 5% significance) which have a normalized score of
$n=5$
, we accept those solutions (with 5% significance) which have a normalized score of $0.25$
or less. This value comes from the discrete SRD distribution which depends on the number of rows and the presence of ties. Compared to the reference Solution 1 seems to rank the properties randomly, while Solution 2 passes the test.
$0.25$
or less. This value comes from the discrete SRD distribution which depends on the number of rows and the presence of ties. Compared to the reference Solution 1 seems to rank the properties randomly, while Solution 2 passes the test.
4.3 Testing framework for the Audience Selection problem
In the Audience Selection problem, we are presented with several possible audiences (node sets of the underlying social network) and we need to predict that, upon activation, which are spreading influence better. Spreading potential can be proxied by network centrality. Our aim is to find out which centrality has better prediction power. Now we describe a step by step a comparison method that enables us to evaluate network centralities with statistical significance.
-
1. We determine the influence measures (centralities) for each node of the network.
-
2. We take
$n$
samples of size
$q$
from the node set. -
3. For each set, we calculate its average centrality according to each measure. Depending on the data, alternative statistical aggregates, e.g., the sum (for unequal set sizes) or the median (in the presence of outliers), can be applied.
-
4. The activation function is used on the sets. In this paper, every user in the set is activated.
-
5. We run a Monte Carlo simulation multiple times with diffusion model
$D$
for each of the sample sets as seeds and observe their performance, that is, how many nodes do they manage to activate on average. -
6. We compile the ranking matrix from the values obtained in step 3 and step 4. These correspond to the solution columns and the reference column, respectively.
-
7. We compute the SRD values and validate our results.


This framework enables us to test our hypothesis. The SRD analysis results in a ranking that tells us which centrality measures perform well in the Audience Selection problem. In parallel, we also run a diffusion simulation on the centralities’ top choices, which gives us the ranking of the centralities in the Influence Maximization problem. Our hypothesis is that different measures prevail in one setting than the other.
Hypothesis 1. The ranking of centralities in the Audience Selection problem significantly differs from a ranking obtained in the Influence Maximization problem.
For validation, we test our hypothesis on two datasets, the iWiW and the Pokec networks. If the set size, $q$
, is chosen to be too big, then the whole graph will be activated during the diffusion simulation, if it is set too small, then hardly anybody will be infected outside the original sets. Keeping this in mind, the hypothesis should be true for a wide range of set size values. Thus, we set
$q$
, is chosen to be too big, then the whole graph will be activated during the diffusion simulation, if it is set too small, then hardly anybody will be infected outside the original sets. Keeping this in mind, the hypothesis should be true for a wide range of set size values. Thus, we set $q=500$
for iWiW, but opted for
$q=500$
for iWiW, but opted for $q= 2000$
for the Pokec graph. These correspond to
$q= 2000$
for the Pokec graph. These correspond to $0.183\%$
and
$0.183\%$
and $0.720\%$
of the total number of nodes, respectively. Note that iWiW and Pokec have approximately the same number of nodes, although Pokec is somewhat less dense.
$0.720\%$
of the total number of nodes, respectively. Note that iWiW and Pokec have approximately the same number of nodes, although Pokec is somewhat less dense.
Increasing the number of sets, $n$
, is costly as we have to run simulations for each set, but it also helps to create a clear ranking over the proxy measures. Under a high
$n$
, is costly as we have to run simulations for each set, but it also helps to create a clear ranking over the proxy measures. Under a high $n$
parameter, even small differences in performance will be statistically significant. Considering the distribution of SRD, we opted for
$n$
parameter, even small differences in performance will be statistically significant. Considering the distribution of SRD, we opted for $n=24$
. SRD already follows approximately normal distribution if
$n=24$
. SRD already follows approximately normal distribution if $n\ge 13$
provided there are no ties in the rankings. As
$n\ge 13$
provided there are no ties in the rankings. As $n$
becomes larger than 13, the distribution becomes sufficiently dense to detect small differences. In the presence of a few ties, the distribution is even denser, although it moves away slightly from normality. Thus, we use the empirical distribution, provided by the rSRD package, to determine
$n$
becomes larger than 13, the distribution becomes sufficiently dense to detect small differences. In the presence of a few ties, the distribution is even denser, although it moves away slightly from normality. Thus, we use the empirical distribution, provided by the rSRD package, to determine $p$
-values.
$p$
-values.
5. Diffusion models
A central observation of diffusion theory is that the line that separates a failed cascade from a successful one is very thin. Granovetter (Reference Granovetter1978) was the first to offer an explanation for this phenomenon. He assumed that each agent has a threshold value, and an agent becomes an adopter only if the amount of influence it receives exceeds the threshold. He uses an illuminating example of how a peaceful protest becomes a riot. A violent action triggers other agents who in turn also become agitated and a domino effect ensues. However, much depends on the threshold distribution. Despite the similarities, network diffusion can substantially differ depending on the type of contagion we deal with. A basic difference stems from the possible adopting behaviors. In most models, agents can adopt two or three distinct states: susceptible, infected, and recovered. Consequently, the literature distinguishes between SI, SIS, and SIR types of models.
In the conventional Influence Maximization setup, a seed set of users are fixed as adopters (or are infected), then the results of diffusion are observed. In the SI model, agents who become adopters stay so until the end of simulation (Carnes et al., Reference Carnes, Nagarajan, Wild and van Zuylen2007; Chen et al., Reference Chen, Wang and Yang2009; Kim et al., Reference Kim, Lee, Park, Lee, Hong, Meng, Chen, Winiwarter and Song2013). A real-life example of such a diffusion can be a profound innovation that eventually conquers the whole network (e.g., mobile phones, internet). In SIS models, agents can change from susceptible to adopter and then back to susceptible again (Kitsak et al., Reference Kitsak, Gallos, Havlin, Liljeros, Muchnik, Stanley and Makse2010; Barbillon et al., Reference Barbillon, Schwaller, Robin, Flachs and Stone2020). For example, an innovation or rumor that can die out behaves this way. Another example would be of a service that agents can unsubscribe from and subscribe again if they want. In SIR models, agents can get “cured” and switch from adopter to recovered status (Yang et al., Reference Yang, Wang, Ren, Bai, Shi, Wang and Zhou2007; Gong and Kang, Reference Gong and Kang2018; Bucur and Holme, Reference Bucur and Holme2020). Recovered agents enjoy temporary or lasting immunity to addictive misbehavior (e.g., to online gaming). Other models allow users to self-activate themselves through spontaneous user adoption (Sun et al., Reference Sun, Chen, Yu and Chen2020).
In this paper, we feature a classical SI diffusion model: the Linear Threshold (LT) framework. We represent our network $G$
with a graph
$G$
with a graph $(V,E)$
, where
$(V,E)$
, where $V$
is the set of nodes and
$V$
is the set of nodes and $E$
is the set of arcs (directed edges) between the nodes. In LT, each node,
$E$
is the set of arcs (directed edges) between the nodes. In LT, each node, $\mathbf{v}$
chooses a threshold value
$\mathbf{v}$
chooses a threshold value $t_{\mathbf{v}}$
uniform at random from the interval
$t_{\mathbf{v}}$
uniform at random from the interval $[0,1]$
. Similarly, each edge
$[0,1]$
. Similarly, each edge $e$
is assigned a weight
$e$
is assigned a weight $w_e$
from
$w_e$
from $[0,1]$
, such that, for each node the sum of weights of the entering arcs add up to 1, formally
$[0,1]$
, such that, for each node the sum of weights of the entering arcs add up to 1, formally
 \begin{equation*}\sum _{\{e\in E| e=(\mathbf {u},\mathbf {v}), \mathbf {u}\in V\}}w_e=1. \quad \quad \mbox { for all } \mathbf {v}\in V.\end{equation*}
One round of simulation for a sample set $S_i$
took the following steps.
$S_i$
took the following steps.
-
1. Generate random node thresholds and arc weights for each
$\mathbf{v}\in V$
and
$e \in E$
. -
2. Activate each node in
$V$
that belongs to
$S_i$
. -
3. Mark each leaving arc of the active nodes.
-
4. For each
$\mathbf{u}\in V\setminus S_i$
sum up the weights of the marked entering arcs. If the sum exceeds, the node’s threshold activate the node. -
5. If there were new activations go back to step 3.
-
6. Output the spread, i.e., the percentage of active nodes.


We ran 5000 simulations and took the average of spread, that is, the expected percentage of individuals that the campaign will reach if $S_i$
is chosen as initial spreaders.
$S_i$
is chosen as initial spreaders.
In this setup, we can think of node thresholds as a measure of innovativeness or risk attitude of the users, while edge weights represent how much influence they bear on each other. Randomization of the parameters is useful in two ways. First, it is difficult to measure peer influence and individual thresholds. There are much more data available, since Kempe et al. (Reference Kempe, Kleinberg and Tardos2003) introduced this diffusion model, so there is room for potential improvements in this aspect. For instance, a strong argument can be made that the parameters for innovators and early adopters should be chosen from different intervals, as they play a key role in the diffusion (Sziklai and Lengyel, Reference Sziklai and Lengyel2022). Nevertheless, randomization is also essential for obtaining multiple observations needed for statistical inference. Perturbing parameter values is a standard technique to achieve this.
6. Influence Maximization proxies
In this section, we give a brief overview of the measures we employed in our analysis.
Among the classical centrality measures, we included Degree and Harmonic Centrality. The former is a self-explanatory benchmark, and the latter is a distance-based measure proposed by Marchiori and Latora (Reference Marchiori and Latora2000). Harmonic centrality of a node, $\mathbf{v}$
is the sum of the reciprocal of distances between
$\mathbf{v}$
is the sum of the reciprocal of distances between $\mathbf{v}$
and every other node in the network. For disconnected node pairs, the distance is infinite; thus, the reciprocal is defined as zero. A peripheral node lies far away from most of the nodes. Thus, the reciprocal of the distances will be small which yields a small centrality value.
$\mathbf{v}$
and every other node in the network. For disconnected node pairs, the distance is infinite; thus, the reciprocal is defined as zero. A peripheral node lies far away from most of the nodes. Thus, the reciprocal of the distances will be small which yields a small centrality value.
PageRank, introduced by Page et al. (Reference Page, Brin, Motwani and Winograd1999), is a spectral measure and a close relative of Eigenvector centrality (Bonacich, Reference Bonacich1972). Eigenvector centrality may lead to misleading valuations if the underlying graph is not strongly connected. PageRank overcomes this difficulty by (i) connecting sink nodes (i.e., nodes with no leaving arc) with every other node through a link and (ii) redistributing some value uniformly among the nodes. The latter is parameterized by the so-called damping factor, $\alpha \in (0,1)$
. The method is best described as a stochastic process. Suppose we start a random walk from an arbitrary node of the network. If anytime we hit a sink node, we restart the walk by choosing a node uniform at random from the node set. After each step, we have a
$\alpha \in (0,1)$
. The method is best described as a stochastic process. Suppose we start a random walk from an arbitrary node of the network. If anytime we hit a sink node, we restart the walk by choosing a node uniform at random from the node set. After each step, we have a $(1-\alpha )$
probability to teleport to a random node. The probability that we occupy node
$(1-\alpha )$
probability to teleport to a random node. The probability that we occupy node $\mathbf{v}$
as the number of steps tends to infinity is the PageRank value of node
$\mathbf{v}$
as the number of steps tends to infinity is the PageRank value of node $\mathbf{v}$
. The idea was to model random surfing on the World Wide Web. PageRank is a core element of Google’s search engine, but the algorithm is used in a wide variety of applications. The damping value is most commonly chosen from the interval
$\mathbf{v}$
. The idea was to model random surfing on the World Wide Web. PageRank is a core element of Google’s search engine, but the algorithm is used in a wide variety of applications. The damping value is most commonly chosen from the interval $(0.7,0.9)$
, here we opted for
$(0.7,0.9)$
, here we opted for $\alpha =0.8$
. For an axiomatic characterization of PageRank, see Was and Skibski (Reference Was and Skibski2023).
$\alpha =0.8$
. For an axiomatic characterization of PageRank, see Was and Skibski (Reference Was and Skibski2023).
Generalized Degree Discount (GDD) introduced by Wang et al. (Reference Wang, Zhang, Zhao and Yi2016) is a suggested improvement on Degree Discount (Chen et al., Reference Chen, Wang and Yang2009) which was developed specifically for the independent cascade model. The latter is an SI diffusion model where each active node has a single chance to infect its neighbors, transmission occurring with the probability specified by the arc weights. Discount Degree constructs a spreader group of size $q$
starting from the empty set and adding nodes one by one using a simple heuristic. It primarily looks at the degree of the nodes but also takes into account how many of their neighbors are spreaders. GDD takes this idea one step further and also considers how many of the neighbors’ neighbors are spreaders. The spreading parameter of the algorithm was chosen to be
$q$
starting from the empty set and adding nodes one by one using a simple heuristic. It primarily looks at the degree of the nodes but also takes into account how many of their neighbors are spreaders. GDD takes this idea one step further and also considers how many of the neighbors’ neighbors are spreaders. The spreading parameter of the algorithm was chosen to be $0.05$
.
$0.05$
. $k$
-core, sometimes referred to as,
$k$
-core, sometimes referred to as, $k$
-shell exposes the onion-like structure of the network (Seidman, Reference Seidman1983; Kitsak et al., Reference Kitsak, Gallos, Havlin, Liljeros, Muchnik, Stanley and Makse2010). First, it successively removes nodes with only one neighbor from the graph. These are assigned a
$k$
-shell exposes the onion-like structure of the network (Seidman, Reference Seidman1983; Kitsak et al., Reference Kitsak, Gallos, Havlin, Liljeros, Muchnik, Stanley and Makse2010). First, it successively removes nodes with only one neighbor from the graph. These are assigned a $k$
-core value of 1. Then it removes nodes with two or less neighbors and labels them with a
$k$
-core value of 1. Then it removes nodes with two or less neighbors and labels them with a $k$
-core value of 2. The process is continued in the same manner until every node is classified. In this way, every node of a path or a star graph is assigned a
$k$
-core value of 2. The process is continued in the same manner until every node is classified. In this way, every node of a path or a star graph is assigned a $k$
-core value of 1, while nodes of a cycle will have a
$k$
-core value of 1, while nodes of a cycle will have a $k$
-core value of 2.
$k$
-core value of 2.
Linear Threshold Centrality (LTC) was, as the name suggests, designed for the Linear Threshold model (Riquelme et al., Reference Riquelme, Gonzalez-Cantergiani, Molinero and Serna2018). Given a network, $G$
with node thresholds and arc weights, LTC of a node
$G$
with node thresholds and arc weights, LTC of a node $\mathbf{v}$
represents the fraction of nodes that
$\mathbf{v}$
represents the fraction of nodes that $\mathbf{v}$
and its neighbors would infect under the Linear Threshold model. In the simulation, we derived the node and arc weights that is needed for the LTC calculation from a simple heuristics: each arc’s weight is defined as 1 and node thresholds were defined as
$\mathbf{v}$
and its neighbors would infect under the Linear Threshold model. In the simulation, we derived the node and arc weights that is needed for the LTC calculation from a simple heuristics: each arc’s weight is defined as 1 and node thresholds were defined as $0.7$
times the node degree. Note that we ran LTC and GDD under various parameters and chose the one which performed the best during the CRRN test (see Fig. A1 in the Appendix).
$0.7$
times the node degree. Note that we ran LTC and GDD under various parameters and chose the one which performed the best during the CRRN test (see Fig. A1 in the Appendix).
Suri and Narahari (Reference Suri and Narahari2008) define a cooperative game on graphs and derive node centrality by computing the Shapley value. Nodes are considered players who cooperate to compose the best $k$
-element set, for some given
$k$
-element set, for some given $k$
. The Shapley value is the expected marginal contribution of each player when players are added to the set one by one and each order of the players is equally likely. Marginal contribution of a node
$k$
. The Shapley value is the expected marginal contribution of each player when players are added to the set one by one and each order of the players is equally likely. Marginal contribution of a node $\mathbf{u}$
is just the difference between the value of the node set with and without
$\mathbf{u}$
is just the difference between the value of the node set with and without $\mathbf{u}$
. Depending on how we define the value of a node set, we can derive different cooperative games. Here we use the G1 game variant proposed by Michalak et al. (Reference Michalak, Aadithya, Szczepański, Ravindran and Jennings2013) who also gave a polynomial-time algorithm to compute the corresponding Shapley(G1)-value. In G1, the characteristic function value of a node set
$\mathbf{u}$
. Depending on how we define the value of a node set, we can derive different cooperative games. Here we use the G1 game variant proposed by Michalak et al. (Reference Michalak, Aadithya, Szczepański, Ravindran and Jennings2013) who also gave a polynomial-time algorithm to compute the corresponding Shapley(G1)-value. In G1, the characteristic function value of a node set $C$
, is the number of nodes in
$C$
, is the number of nodes in $C$
plus the number of distinct neighbors of
$C$
plus the number of distinct neighbors of $C$
.
$C$
.
Top candidate (TC) algorithm originates from the field of social choice. It is a group identification method designed to find experts on recommendation networks (Sziklai, Reference Sziklai2018, Reference Sziklai2021). The algorithm takes a graph as an input and outputs a list of experts. The size of the output can be adjusted with a parameter, $\alpha \in [0,1]$
. The smallest set
$\alpha \in [0,1]$
. The smallest set $(\alpha =0)$
corresponds to the elite, while the largest set
$(\alpha =0)$
corresponds to the elite, while the largest set $(\alpha =1)$
is composed by anyone who could conceivably considered as expert. The algorithm works as follows. In the beginning, each node is considered as an expert and asked to nominate
$(\alpha =1)$
is composed by anyone who could conceivably considered as expert. The algorithm works as follows. In the beginning, each node is considered as an expert and asked to nominate $\alpha$
fraction of its most popular neighbors. Popularity is measured by the number of recommendations the node received, that is, in the number of entering arcs. The nodes that receive no nominations are surely not experts; hence, they are removed from the expert set and their nominations are withdrawn. This in turn might leave some other nodes without nominations. The removal of experts continues until the set stabilizes. The
$\alpha$
fraction of its most popular neighbors. Popularity is measured by the number of recommendations the node received, that is, in the number of entering arcs. The nodes that receive no nominations are surely not experts; hence, they are removed from the expert set and their nominations are withdrawn. This in turn might leave some other nodes without nominations. The removal of experts continues until the set stabilizes. The $\alpha$
parameter is what makes TC suitable as a centrality index for strongly connected graphs. We run the algorithm multiple times, incrementing the
$\alpha$
parameter is what makes TC suitable as a centrality index for strongly connected graphs. We run the algorithm multiple times, incrementing the $\alpha$
parameter by 0.01. Each node is assigned the largest
$\alpha$
parameter by 0.01. Each node is assigned the largest $1-\alpha$
value for which the node first becomes expert. This can be considered as a measure of exclusivity. For strongly connected graphs, every node becomes an expert at
$1-\alpha$
value for which the node first becomes expert. This can be considered as a measure of exclusivity. For strongly connected graphs, every node becomes an expert at $\alpha =1$
the latest, but those nodes will have an exclusivity value of 0. Note that social networks consisting of one component become strongly connected when the undirected link between the users (the “friendship”) is converted into two opposing directed edges.
$\alpha =1$
the latest, but those nodes will have an exclusivity value of 0. Note that social networks consisting of one component become strongly connected when the undirected link between the users (the “friendship”) is converted into two opposing directed edges.
This is by no means a comprehensive list, there are other proxy and centrality measures, e.g., HITS (Kleinberg, Reference Kleinberg1999), LeaderRank (Lü et al., Reference Lü, Zhang, Yeung and Zhou2011), DegreeDistance (Sheikhahmadi et al., Reference Sheikhahmadi, Nematbakhsh and Shokrollahi2015), IRIE (Jung et al., Reference Jung, Heo and Chen2012), GroupPR (Liu et al., Reference Liu, Xiang, Chen, Xiong, Tang and Yu2014), Attachment centrality (Skibski et al., Reference Skibski, Rahwan, Michalak and Yokoo2019) for more see the survey of Li et al. (Reference Li, Fan, Wang and Tan2018). Announcing a clear winner falls outside the scope of this manuscript. A real ranking analysis should always consider the diffusion model and a network characteristics carefully, as different algorithms will thrive in different environments.
7. Ranking analysis
The performance of the sample sets according to the various influence measures is displayed in Tables A1 (for iWiW) and A3 (for Pokec). The last column shows the percentage of nodes that the samples managed to activate on average in the diffusion simulation. The ranking matrix together with the SRD values is displayed in Tables A2 and A4. The tables can be found in the Appendix. The SRD score of a centrality is the distance between the ranking induced by the measure and the reference ranking, that is, the last column. In the CRRN test (Comparison of Ranks with Random Numbers), we compare the SRD scores with those of random rankings. Figures 2 and 3 show the result of the CRRN test. The SRD distribution is generated by observing the distances of random rankings from the reference. We accept a solution if the distance between the solution’s ranking and the reference ranking falls left to the 5% significance thresholds.
For both networks, all of the methods pass the test, that is, they rank the sample sets more or less correctly. The performances vary, although degree and PageRank rank high, while $k$
-core and Harmonic centrality rank low on both networks. The first places of degree should be taken with a grain of salt. A possible reason behind its exceptional performance might come from the fact that sample sets were created by random sampling. It remains to be seen how degree performs compared to other measures when sets are generated in a more realistic way, e.g., based on location data.
$k$
-core and Harmonic centrality rank low on both networks. The first places of degree should be taken with a grain of salt. A possible reason behind its exceptional performance might come from the fact that sample sets were created by random sampling. It remains to be seen how degree performs compared to other measures when sets are generated in a more realistic way, e.g., based on location data.
iWiW CRRN test. The order of the centrality measures in the legend (from top to bottom) follows the same order as the colored bars in the figure (from left to right). The bars’ height is equal to their normalized SRD values. The black curve is a continuous approximation of the cumulative distribution function of the random SRD values. All (normalized) SRD values fall outside the 5% threshold (XX1: 5% threshold, Med: Median, XX19: 95% threshold).

Pokec CRRN test. The order of the centrality measures in the legend (from top to bottom) follows the same order as the colored bars in the figure (from left to right). The bars’ height is equal to their normalized SRD values. The black curve is a continuous approximation of the cumulative distribution function of the random SRD values. All (normalized) SRD values fall outside the 5% threshold (XX1: 5% threshold, Med: Median, XX19: 95% threshold).

Cross-validation reveals how the methods are grouped. Multiple SRD scores are generated by sampling the data and recalculating the rankings. We create 8-folds, by repeatedly removing three random rows (sample sets) and recalculating the rankings. Then, an 8-fold Wilcoxon test compares the median values. Figures 4 and 5 show the boxplots of the attained SRD values. On the iWiW network, there is no significant difference between Harmonic centrality, Shapley G1 and GDD. On the Pokec network, Linear Threshold Centrality and Shapley G1 are tied for the 4th place.
Cross-validation on iWiW data. The boxplot shows the median (black diamond), Q1/Q3 (blue box), and min/max values. The measures are ranked from left to right by the median values. The ‘ $\sim$
’ sign between two neighboring measures indicates that the Wilcoxon test found no significant difference between the rankings induced by the measures.
$\sim$
’ sign between two neighboring measures indicates that the Wilcoxon test found no significant difference between the rankings induced by the measures.

Cross-validation of Pokec data. The boxplot shows the median (black diamond), Q1/Q3 (blue box), and min/max values. The measures are ranked from left to right by the median values. The ‘ $\sim$
’ sign between two neighboring measures indicates that the Wilcoxon test found no significant difference between the rankings induced by the measures.
$\sim$
’ sign between two neighboring measures indicates that the Wilcoxon test found no significant difference between the rankings induced by the measures.

Our main goal was to show that Audience Selection and Influence Maximization are two different problems. So let us take a look at how the top choices of these measures perform in the simulation. In case of iWiW, we took the 500 highest-ranked agents for each measure. If the 500th and 501st agents tied with each other, we discarded agents with the same score one by one randomly until the size of the set became 500. We ran 5000 simulations to obtain the average spread of the measures. The same procedure was repeated on the Pokec data, but there the top 2000 nodes were considered. Tables 3 and 4 display the results.
In case of iWiW, there is a significant disparity in the performances of GDD under the Influence Maximization and Audience Selection problems. In Influence Maximization, GDD is the best-performing method, while in Audience Selection, it performs poorly compared to other methods. In case of Pokec, the rank difference between methods is not as massive as in iWiW. However, there are many smaller differences in the performance of methods.
Are these differences statistically significant? Luckily, the same CRRN test, that we used before can be applied, but now our input data is different. When we compared centralities, we looked at how they rank the sample sets. Now we want to compare Influence Maximization with Audience Selection, therefore we look at how they rank centralities. We can set either the ranking of IM or that of AS as the reference and compare their distance to the empirical SRD distribution of size $n=8$
(since there are 8 centrality measures).
$n=8$
(since there are 8 centrality measures).
In case of iWiW, the distance between the IM and the AS ranking equals to a normalized SRD value of 0.375. In the SRD distribution, this corresponds to a $p$
-value of 0.0685. If we consider ties the distance remains the same, however, the
$p$
-value of 0.0685. If we consider ties the distance remains the same, however, the $p$
-value becomes 0.07104 due to the change in the distribution. Assuming the usual 5% significance level, these two
$p$
-value becomes 0.07104 due to the change in the distribution. Assuming the usual 5% significance level, these two $p$
-values mean that the AS ranking is indistinguishable from a random ranking compared to the IM ranking. In other words, the rankings significantly differ from each other and Hypothesis 1 holds.
$p$
-values mean that the AS ranking is indistinguishable from a random ranking compared to the IM ranking. In other words, the rankings significantly differ from each other and Hypothesis 1 holds.
Comparing the rankings of centralities induced by the Audience Selection (AS) and Influence Maximization (IM) problem on iWiW. Ranks in brackets show the tied ranks according to the cross-validation

Comparing the rankings of centralities induced by the Audience Selection (AS) and Influence Maximization (IM) problem on Pokec. Ranks in brackets show the tied ranks according to the cross-validation

In case of Pokec, the SRD values are 0.375 (in the strict ranking case) and 0.34375 (when ties are considered). The first value corresponds to a $p$
-value of 0.0688, while the second to
$p$
-value of 0.0688, while the second to $p=0.0380$
. In other words, statistical significance depends on whether we allow ties or not. Nevertheless, an SRD score of 0.34375 is substantial even if it is not statistically significant. Considering that both Influence Maximization and Audience Selection are optimization problems, the difference is too big to treat them the same—especially, since they do not agree on the best method.
$p=0.0380$
. In other words, statistical significance depends on whether we allow ties or not. Nevertheless, an SRD score of 0.34375 is substantial even if it is not statistically significant. Considering that both Influence Maximization and Audience Selection are optimization problems, the difference is too big to treat them the same—especially, since they do not agree on the best method.
In conclusion, both our example and simulations on real data point toward that Hypothesis 1 holds: different methods perform well under the Influence Maximization model and the Audience Selection model.
8. Conclusion
We described a realistic decision situation that occurs in viral marketing campaigns. A company that organizes a series of public events wants to maximize social influence by selecting suitable locations/audiences. For this reason, the company must evaluate the collective impact of the selected audiences. As exact computation is infeasible, the potential is estimated by influence proxies (e.g., network centralities). The question is which measure suits our needs the best? The Audience Selection problem resembles to the Influence Maximization at first glance. To prove that they are different, we proposed a testing framework that is capable to rank influence measures by their predictive power on sets. For this, we used a novel comparative statistical test, the Sum of Ranking Differences (SRD).
We demonstrated our results on two real-life social networks. We took samples from the node sets and created multiple rankings using various centrality measures. We compared these rankings to a reference ranking induced by the spreading potential of these sets under a Linear Threshold diffusion model. The algorithm whose ranking is the closest to the reference has the best predictive power. We compared this ranking to a ranking obtained by running a simulation with the top choices of these measures (in the manner of Influence Maximization).
In the iWiW network, the best-performing influence maximization algorithm fared relatively poorly on the Audience Selection test. On both networks, we found that the ranking of centralities in the Audience Selection problem substantially differed from a ranking obtained in the Influence Maximization problem. The discrepancy between the two rankings implies that we cannot blindly assume that the algorithm that finds the top spreaders in a network is the best in predicting the potential of an arbitrary set of agents.
The innovative use of SRD is one of the novelties of this paper. The test proved to be an excellent tool for comparing network centralities. Its use is not restricted to Influence Maximization, it can be applied in a wide variety of settings.
To examine the influence of ordinary users on the diffusion process, we utilized random sampling and compared Audience Selection and Influence Maximization on the randomly selected sample sets. All centrality measures pass the CRRN test, indicating that they order the sets significantly better than a random ranking. However, not every centrality is equally effective. PageRank and degree perform well on both networks. The effectiveness of degree may be attributed to the nature of the model. In a more realistic setting, sample sets should be based on locations, demographic groups, or other social traits. It remains to be seen how degree performs under a more realistic sampling technique.
Another simplifying assumption we had was to fix the activation function as the identity function, that is, every user in the seed set was activated. Although with random sampling this assumption imposes no bias, it becomes less realistic if the seed sets are composed in a more reasonable way (e.g., based on location). A simplistic approach is to activate only a fix fraction of the targeted group. An even better way is to consider the adopter classification of users—innovators and early adopters in the seed set should become active with a higher probability.
Similarly to the activation function, different diffusion mechanisms need to be tested. Another popular diffusion model is independent cascade where each newly activated agent has one opportunity to infect its neighbors. We conjecture that Audience Selection and Influence Maximization rank centralities differently under other diffusion frameworks. Nevertheless, it would be interesting to examine the AS problem under the independent cascade model too.
Finally, we focused on comparing the Audience Selection to the Influence Maximization problem and also proposed a statistical framework to rank centralities in the former. A more comprehensive comparison study is needed to find the best method in the Audience Selection problem.
Competing interests
None.
Funding
The authors acknowledge financial help received from National Research, Development, and Innovation Office grant numbers KH 130502, K 138970, K 128573, K 138945. Balázs R. Sziklai is the grantee of the János Bolyai Research Scholarship of the Hungarian Academy of Sciences.
Data availability statement
The iWiW dataset is accessible upon request from the Databank of the Centre of Economic and Regional Studies,Footnote 1 while the Pokec dataset is downloadable from the Stanford Large Network Dataset Collection.Footnote 2
Appendix A: Tables
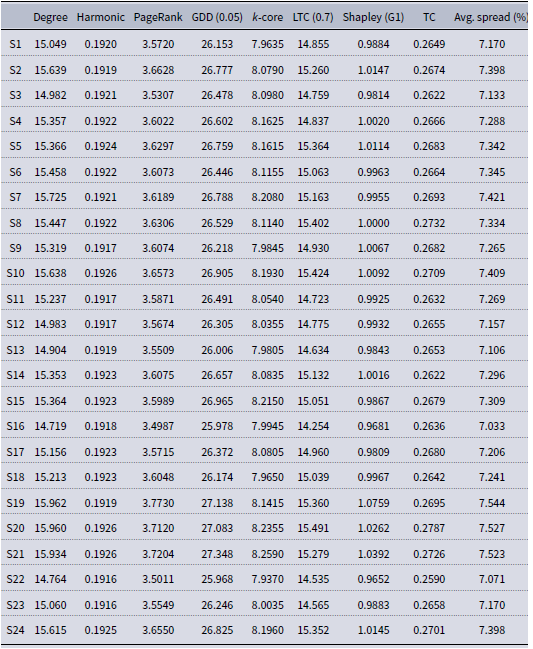
Average centrality values of the 24 randomly selected seed sets of iWiW. Avg. spread denotes the percentage of nodes the sample sets managed to infect on average over 5000 runs

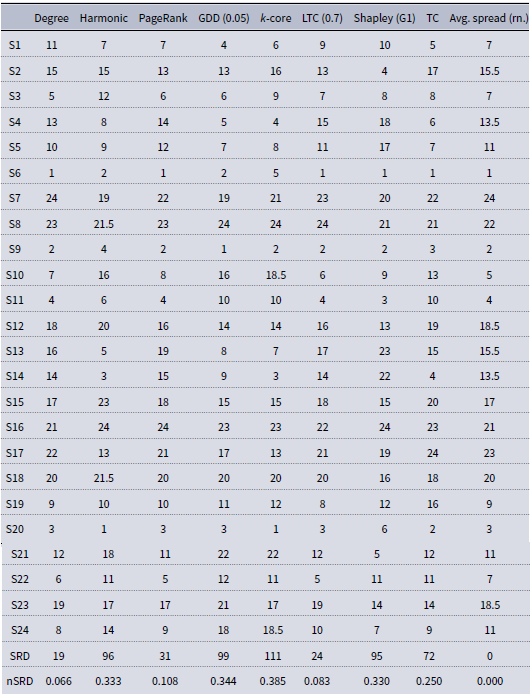
iWiW ranking matrix. Data compiled from Table A1. Spreads closer than 0.005% to each other were considered as a tie. nSRD stands for normalized SRD
Average centrality values of the 24 randomly selected seed sets of Pokec. Avg. spread denotes the percentage of nodes the sample sets managed to infect on average over 5000 runs
Pokec ranking matrix. Data compiled from Table A3. Spreads closer than 0.005% to each other were considered as a tie. rSRD stands for normalized SRD

Parameter selection for Linear Threshold Centrality and Generalized Degree Discount. Smaller SRD values indicate better alignment with the reference, which was the spreading potential of the sample sets on iWiW (XX1: 5% threshold, Med: Median, XX19: 95% threshold).


 Open access