


1. Introduction
Recent research suggests that political polarization is a present and increasing problem globally, fragmenting societies into partisan groups (Hetherington, Reference Hetherington2009; Iyengar et al., Reference Iyengar, Sood and Lelkes2012; Bochsler et al., Reference Bochsler, Gerber and Zumbach2016; Reiljan, Reference Reiljan2020). Some authors conclude that this has come to the point of a “culture war” in some Western societies, such as the US (Bishop and Cushing, Reference Bishop and Cushing2008; Hunter, Reference Hunter1991), the UK (Cammaerts, Reference Cammaerts2022), or Italy (De Blasio and Selva, Reference De Blasio and Selva2024). Though the terminology is probably hyperbolic (Praet et al., Reference Praet, Guess, Tucker, Bonneau and Nagler2022), partisan groups do appear somewhat incongruous not only in their political views, but also in cultural consumption and general lifestyle (DellaPosta et al., Reference DellaPosta, Shi and Macy2015). This is accompanied by growing antagonism and the social rejection of political identity-based outgroups in favor of the ingroup (i.e. ingroup bias, Iyengar et al., Reference Iyengar, Sood and Lelkes2012; Hewstone et al., Reference Hewstone, Rubin and Willis2002; Hobolt et al., Reference Hobolt, Leeper and Tilley2021; Reiljan, Reference Reiljan2020). Combined with increasing inequalities, polarization threatens to amplify social divisions and lead to large-scale conflicts and disarray in society.
Currently, there is a lack of consensus in the scientific community about the conceptualization, extent, and causes of social divisions. Dominant perspectives in political science, social psychology, and sociology emphasize ideological polarization (e.g., Hetherington Reference Hetherington2009; Fiorina and Abrams, Reference Fiorina and Abrams2008; Abramowitz and Saunders, Reference Abramowitz and Saunders2008) and various forms or relational segregation (e.g. Iyengar et al., Reference Iyengar, Sood and Lelkes2012; Conover et al., Reference Conover, Ratkiewicz, Francisco, Gonçalves, Menczer and Flammini2011; Iyengar et al., Reference Iyengar, Lelkes, Levendusky, Malhotra and Westwood2019; Reiljan, Reference Reiljan2020) as two key aspects of political division. Recent studies point out that ideological and social processes may work in conjunction to amplify initial differences between people, extending political divides to the realms of cultural and social life (DellaPosta et al., Reference DellaPosta, Shi and Macy2015). However, few integrative approaches to the study of these two processes exist (for a recent review, see Jost et al., Reference Jost, Baldassarri and Druckman2022).
We propose a joint examination of ideological polarization and relational segregation by conceptualizing societies, and smaller communities within them, as multilevel social networks. In these networks, people may be connected to each other by social ties, such as friendships. At the same time, people are also linked to various political topics by attitude ties, such as supporting or opposing certain issues. While we focus on political topics, the concept of attitudinal ties can be naturally extended to other social objects to represent cultural consumption and lifestyle choices.
The multilevel network approach enables us to understand the extent and causes of social divisions. First, we define and quantify “network polarization,” which captures the extent to which the network of a community is characterized by ideological and relational polarization. A set of metrics is proposed based on weighted counts of triads (two people, their social tie, and their attitude towards one topic) and four-cycles (two people and their attitudes towards two topics) in the multilevel network. Second, by extending existing statistical models for dynamic multilevel networks, we explore the role of three network processes, social selection, social influence, and latent-cause reinforcement, in creating and maintaining the observed level of network polarization—that is, we can study how communities become polarized.
We apply these techniques to a unique longitudinal network dataset of two Swiss undergraduate student cohorts. We measured friendship and positive and negative political attitude networks of students in these cohorts over three years. We calculate the network polarization metrics and assess how well they are explained by an empirically-calibrated stochastic actor-oriented model that considers the co-evolution of friendships and attitudes.
2. Network polarization: theory and concepts
Polarization is a frequently discussed topic in popular debate about the growing divisions in Western societies. What polarization means is often left unclear in the public realm. Academic works have offered more clarity, but they use a variety of concepts and measures. Dominant perspectives focus on either the ideological or the interpersonal facets of polarization.
The first perspective on polarization focuses on political ideology. In this approach, a community is considered polarized if its members have divergent political attitudes and opinions. Studies examining single political issues use the shape of the attitude distribution of people to gauge the level of polarization (DiMaggio et al., Reference DiMaggio, Evans and Bryson1996). Researchers who consider multiple political issues also refer to polarization as the increase in correlations between people's attitudes towards different issues (Baldassarri and Gelman, Reference Baldassarri and Gelman2008; Abramowitz and Saunders, Reference Abramowitz and Saunders2008). This is sometimes described as the level of “alignment” or “constraint” in attitudes (Converse, Reference Converse2006).
The second perspective on polarization focuses on interpersonal relations. Relational polarization is defined here as the clustering of social ties so that people preferentially associate with their political ingroups. A possible measure of this form of polarization is the extent to which individuals are socially tied to others who share their political views (Conover et al., Reference Conover, Ratkiewicz, Francisco, Gonçalves, Menczer and Flammini2011; Guerra et al., Reference Guerra, Meira, Cardie and Kleinberg2013). The central assumption of such an operationalization of polarization is that the pattern of social ties should reflect underlying opinion similarity. Past research has explored the roots of relational polarization in feelings of affection towards political in- and outgroups in the US (Iyengar et al., Reference Iyengar, Sood and Lelkes2012, Reference Iyengar, Lelkes, Levendusky, Malhotra and Westwood2019) and Europe (Reiljan, Reference Reiljan2020; Gidron et al., Reference Gidron, Adams and Horne2020; Hobolt et al., Reference Hobolt, Leeper and Tilley2021). Studying affect offers insight into how much people from different political factions may be willing to constructively interact and form social ties. For this reason, we consider relational polarization as the behavioral outcome of affective processes and study social ties and affect in a single, relational dimension of polarization.
We argue that ideological and relational polarization should be studied jointly to understand social divisions. Ideological polarization—the alignment, or constraint, of political attitudes—indicates the absence of a common ground for consensus between individuals. Relational polarization—the occurrence or absence of social ties between individuals with aligned or opposed political attitudes—reflects the absence of opportunities for finding or creating such common ground between people of different political views. We propose an approach rooted in social network analysis to integrate these two concepts of polarization.
2.1 Representing political attitudes and social ties as a multilevel network
A central idea behind our approach is that political attitudes and social ties can be represented as a multilevel network (Lazega and Snijders, Reference Lazega and Snijders2015). One set of nodes in this network are people, who are connected to each other by social ties, such as friendships. Political issues form the second set of nodes. People may be linked to any issue by one of two ties, expressing either a positive or a negative attitude, or have no tie to the issue if their opinion is neutral. Representing actor-issue attributes as a two-mode network allows the analysis of sets of opinions and their changes in one coherent network model, rather than treating single issues separately (see Schweighofer et al. (Reference Schweighofer, Schweitzer and Garcia2020) for a similar network conceptualization).
Table 1. Stylized representations of multilevel network structures that relate to the ideological (rows 1–3) and relational dimension (rows 4–7) of network polarization. Arrows indicate whether they are related to high ( $\uparrow$
) or low (
$\uparrow$
) or low ( $\downarrow$
) outcomes of the respective dimension
$\downarrow$
) outcomes of the respective dimension
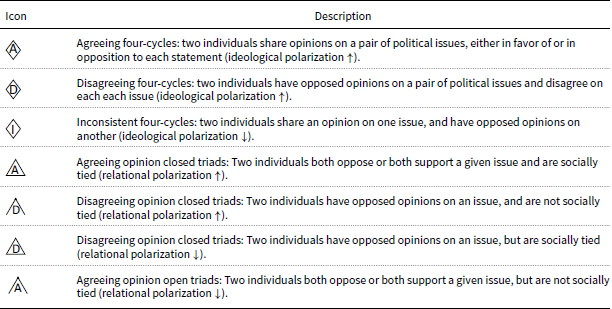
Based on the concepts of polarization discussed above, we argue that certain structural configurations, or motifs, in the multilevel network of social ties and attitudes will occur more or less frequently depending on how polarized a community is. By identifying and counting these structures, we can assess the extent of polarization in a community. The relevant network structures are shown as pictograms in Table 1 and as subgraph structures in Figure 1. Their counts resemble a subgraph census (Wasserman and Faust, Reference Wasserman and Faust1994). An ideologically polarized community will be characterized by higher counts of four-cycle structures in which pairs of individuals either agree on two given issues by sharing negative or positive opinions (structure ![]() in Table 1) or disagree (
in Table 1) or disagree (![]() ). In case of low polarization they may regularly hold inconsistent views and agree on one issue but disagree on the other (
). In case of low polarization they may regularly hold inconsistent views and agree on one issue but disagree on the other (![]() ). These structures are represented by the first three rows in Table 1.
). These structures are represented by the first three rows in Table 1.
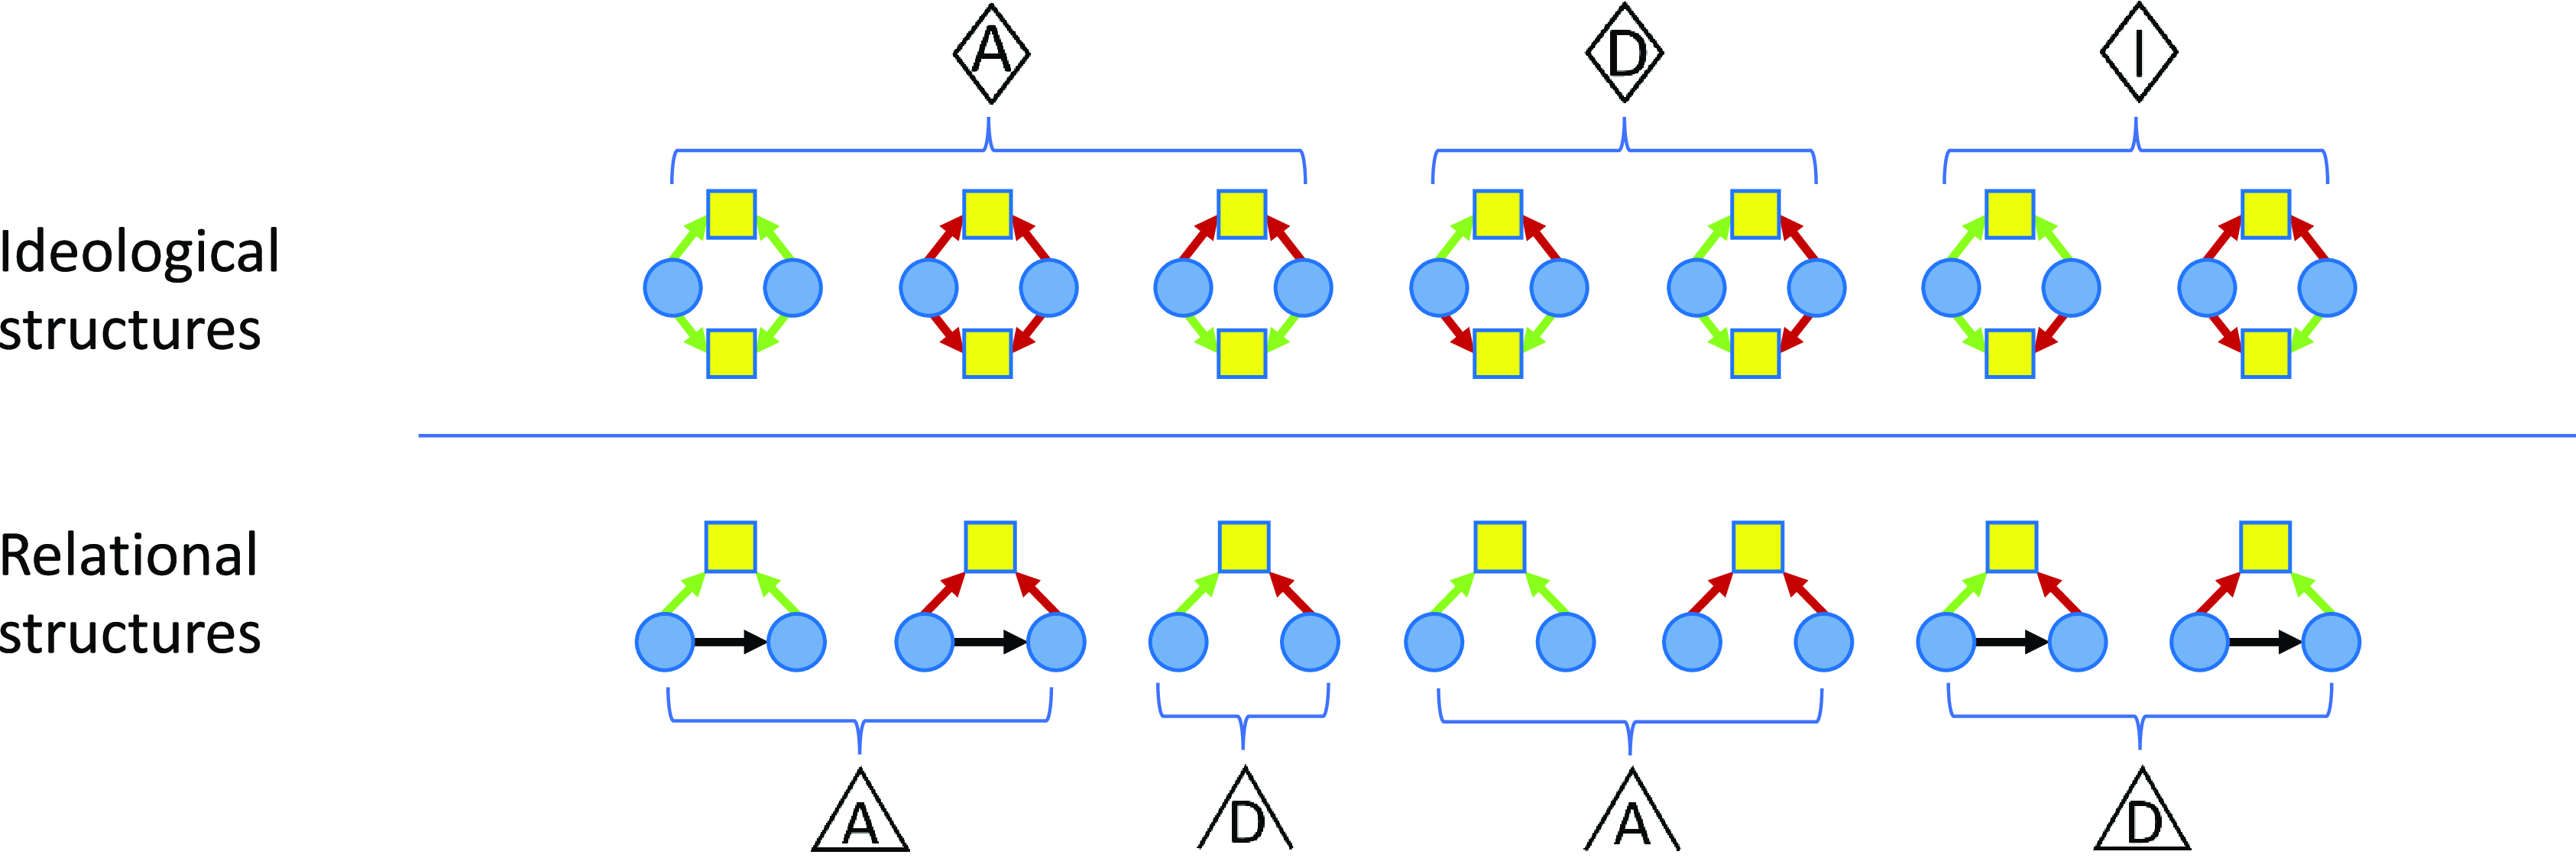
Figure 1. Structures used in defining polarization. Four-cycles (upper half) are used in defining ideological, triads in the lower half are used in defining relational polarization. ”A” and ”D” indicate agreeing and disagreeing structures. ”I” indicates structures which are incongruent. The icon to which each structure belongs is indicated by their grouping in the blue braces.
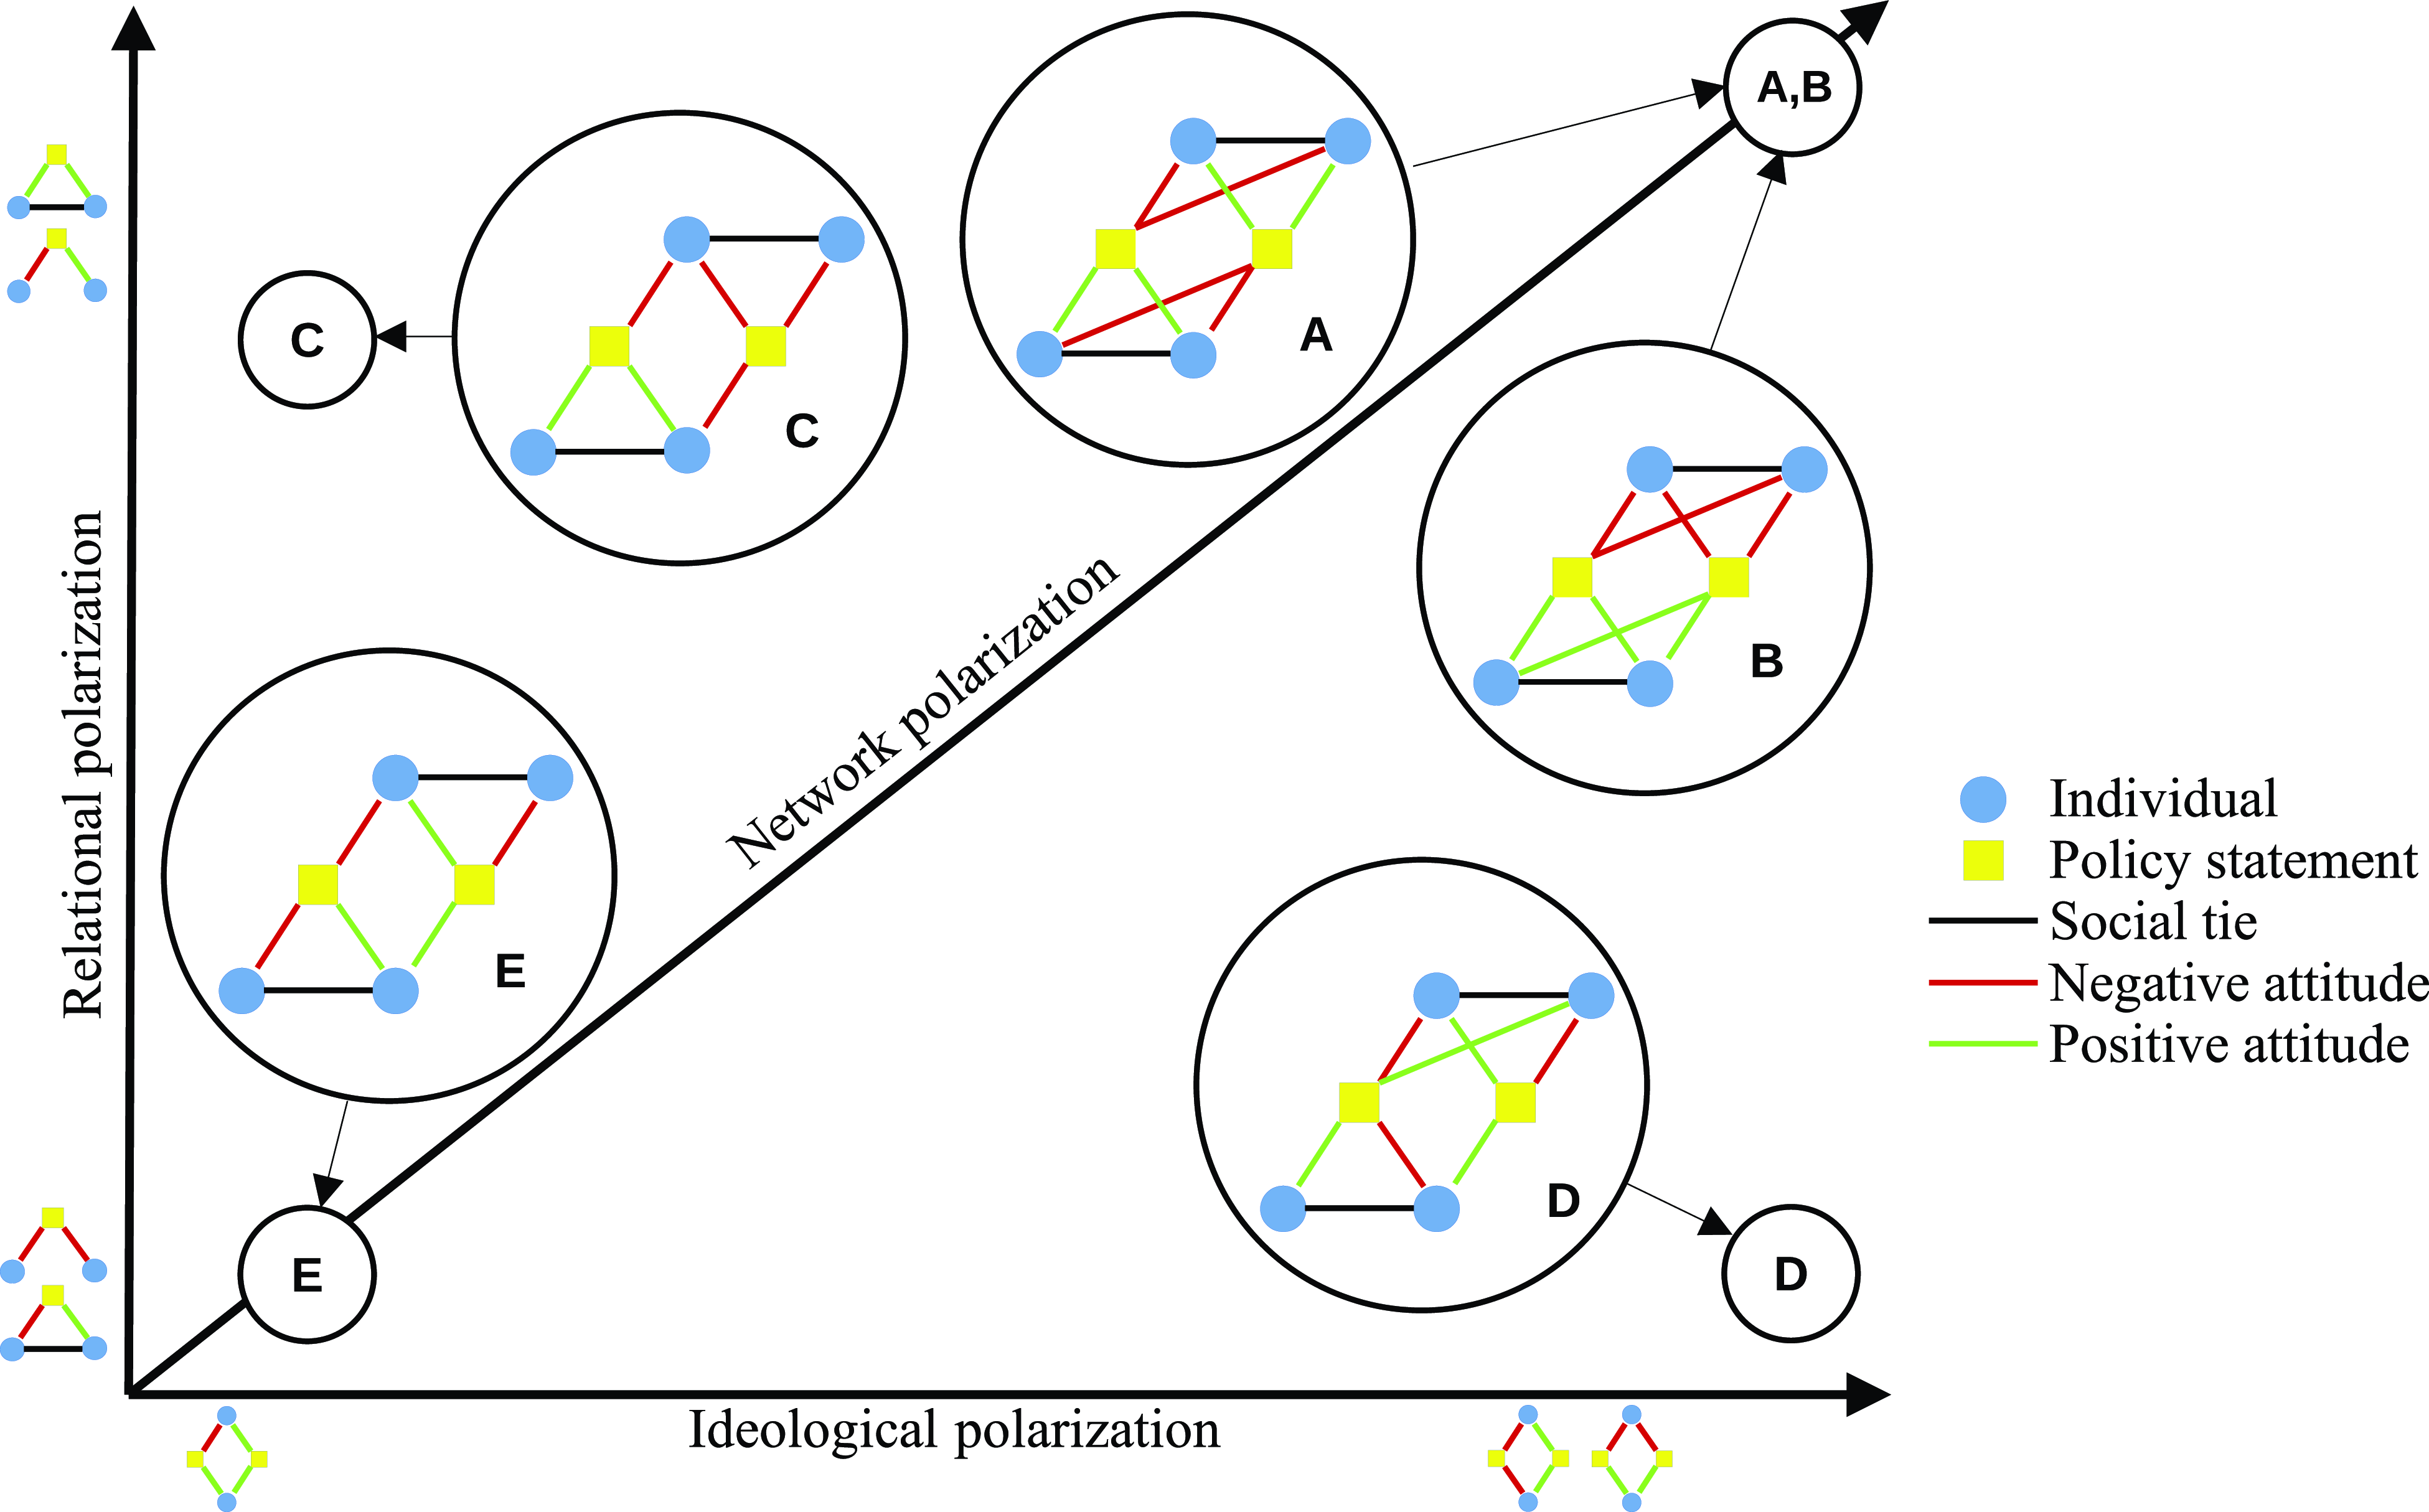
Figure 2. Stylized representation of the two-dimensional space of network polarization with five example networks. Icons on the x and y axes are example structures from the network census that correspond to cases of high and low polarization outcomes.
Similarly, relational polarization will be reflected in the degree to which pairs of individuals and their attitudes towards one issue node form certain triadic structures. In a relationally polarized community, individuals will be regularly socially tied when they agree on a given issue (![]() ) and not be tied when they disagree (
) and not be tied when they disagree (![]() ). In case of low relational polarization, individuals will be more frequently tied to others with whom they disagree (
). In case of low relational polarization, individuals will be more frequently tied to others with whom they disagree (![]() ) and not be tied to those who share their views (
) and not be tied to those who share their views (![]() ). These structures are represented by the last four rows in Table 1. Figure 1 includes a full overview of the network configurations that constitute the census. It considers that certain structures are counted across multiple networks (for example, in structure
). These structures are represented by the last four rows in Table 1. Figure 1 includes a full overview of the network configurations that constitute the census. It considers that certain structures are counted across multiple networks (for example, in structure ![]() the two individuals can agree with regards to positive and negative attitudes; shown as the first three icons in the first row). Appendix A includes mathematical definitions of the structural census.
the two individuals can agree with regards to positive and negative attitudes; shown as the first three icons in the first row). Appendix A includes mathematical definitions of the structural census.
Figure 2 presents five hypothetical networks (A–E) with different degrees of ideological and relational polarization. Each network consists of four individuals (circles), their social ties (black arrows) and positive and negative attitudes (light green and darker red arrows) to two issues (squares). Two example networks, A and B in the upper right corner, exhibit a maximum degree of polarization: socially connected individuals consistently agree while unconnected individuals consistently disagree in their attitudes. Two given nodes will either completely agree or disagree about their view on the two issues. The other networks exhibit lower levels of relational and/or ideological polarization. In network C, individuals tend to agree with those whom they are socially tied with (high relational polarization) but no consistent agreement or disagreement of actor pairs is found on issue pairs (low ideological polarization). Network D exemplifies the opposite case of consistent attitudes between pairs of individuals (high ideological polarization) but lack of agreement among those who are socially tied (low relational polarization). Lastly, network E is low on both aspects of polarization. Networks D and E are not at the theoretical minimum level of relational polarization as they include cases of individuals disagreeing on issues without being socially tied (![]() ). The diagonal arrow across the figure indicates that network polarization in our study will be defined as a linear combination of the ideological and relational dimensions represented by the two axes in the figure.
). The diagonal arrow across the figure indicates that network polarization in our study will be defined as a linear combination of the ideological and relational dimensions represented by the two axes in the figure.
2.2 Defining a macro-level measure of network polarization
We introduce the concept of network polarization, which expresses how much a multilevel network of political attitudes and social ties is polarized, and propose a new measure to quantify it. This is based on the theoretical discussions and the structural census introduced above. The network polarization metric is constructed as the average of two sub metrics. First, the ideological polarization metric refers to the extent to which pairs of individuals in the network consistently agree or disagree in their attitudes. Second, the relational polarization metric expresses the extent to which social ties are present between agreeing, but not disagreeing, individuals. Higher levels of polarization on each dimension will lead to the formation of distinct sub groups of individuals—groups of individuals who agree with each other, but disagree with individuals in other groups, and groups of individuals who are socially tied to others they agree with, but not to those they disagree with. Each sub metric separately considers network structures that relate to in-group cohesion (attraction) and structures that relate to between-group boundaries (repulsion; building upon the attraction-repulsion model of Stadtfeld et al., Reference Stadtfeld, Takács and Vörös2020).
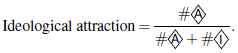
Ideological polarization. The metric of ideological polarization has two components, one relating to ideological attraction, one related to ideological repulsion. Each is based on counts of complete four-cycles (see the first three items in Table 1). The first two structures may be seen as indicators for consistency of agreement (![]() ), or ideological attraction, and consistency of disagreement (
), or ideological attraction, and consistency of disagreement (![]() ), or ideological repulsion. The first component ideological attraction is defined as the proportion of cases where two people consistently agree on two issues rather than having views that are inconsistent with ideological polarization (measured by inconsistent four-cycles
), or ideological repulsion. The first component ideological attraction is defined as the proportion of cases where two people consistently agree on two issues rather than having views that are inconsistent with ideological polarization (measured by inconsistent four-cycles ![]() ):
):
The second component ideological repulsion is similarly defined as the proportion of cases where two people consistently disagree on two issues rather than having inconsistent views on those issues:
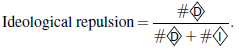
The two components can be interpreted as analogous to the probability of two individuals to agree (disagree) on one issue if they agree (disagree) on another. We consider the mean of the two component metrics to measure the level of ideological polarization as the probability of observing consistent attitudes (either disagreeing or agreeing) in pairs of individuals. It is noteworthy at this point that the baseline probability of two individuals to agree is affected by various factors, such as the general prevalence of positive and negative attitudes (the attitude network densities) and the different tendencies of items to attract positive or negative attitudes (the item degrees). The final measure proposed therefore corrects for such baseline probabilities.
Relational polarization. The metric of relational polarization also has two components that relate to within-group attraction and between-group repulsion. The relevant structures are shown in the last four rows of Table 1. Structures ![]() and
and![]() represent attraction and repulsion structures, respectively, while
represent attraction and repulsion structures, respectively, while ![]() and
and![]() are structures inconsistent with the presence of ideologically separated social groups. The first component relational attraction is defined as the ratio of triads in which two individuals who agree on a given issue are also socially tied:
are structures inconsistent with the presence of ideologically separated social groups. The first component relational attraction is defined as the ratio of triads in which two individuals who agree on a given issue are also socially tied:
The second component relational repulsion is defined as the ratio of triads in which two individuals who disagree on an issue are not tied:
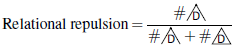
The two components can be interpreted as the empirical probabilities that a) i is connected to j given they agree on an issue and that b) i is not connected to j given they disagree on an issue. The expected value of these probabilities will be affected by the general prevalence of social ties in the sampl (Eq. 3 and 4 are expected to equal the density and $1-$
density of the social network, respectively, if no relational attraction and repulsion exist) and the equations are thus later normalized with the network density. Undefined ratios in Equations 1–4 are assumed to be zero.
$1-$
density of the social network, respectively, if no relational attraction and repulsion exist) and the equations are thus later normalized with the network density. Undefined ratios in Equations 1–4 are assumed to be zero.
Network polarization. Finally, we take the arithmetic mean of the two pairs of attraction and repulsion statistics to define sub metrics of ideological polarization and relational polarization. The maximum value for each metric is 1, which represents perfect polarization when more than one group existsFootnote 1 (e.g., as seen in networks A and B in Figure 2). Their minimum values are zero. Each of the sub dimensions is normalized considering certain topological features of the network, such as their density and degree distributions. The metrics are thereby re-scaled so that the random expectation of Equations 1–4 lies at the mid point of 0.5. Further details are provided in Section 5.1.
The network polarization metric can then be considered a tuple of the two sub metrics or represented by the mean of ideological polarization and relational polarization (which also ranges from 0 to 1 with a random expectation of 0.5). The metrics defined here may be useful for the comparison of polarization levels in different communities. Further, the approach is applicable to following temporal changes in polarization in a single community. Beyond that, the metrics allow us to explore the social processes that may explain observed levels of network polarization when we use is as a macro-level target or benchmark in agent-based simulations. Similar to the studies of consensus or bipolarization outcomes in single issue settings (Flache et al., Reference Flache, Mäs, Feliciani, Chattoe-Brown, Deffuant, Huet and Lorenz2017), we may use the new metrics to understand through which micro-level processes attraction and repulsion outcomes are likely generated with regards to ideological or relational polarization.
2.3 Related measures of polarization
Our network polarization metric draws inspiration from a series of prior conceptualizations that were proposed for data collected in different empirical contexts or generated by agent-based models. Some metrics are concerned with the degree of attitudinal extremity and/or intergroup difference (with or without a definition of a group based on the attitudinal variable of interest). Within this class, many different unidimensional metrics exist (for a review, see Bramson et al., Reference Bramson, Grim, Singer, Fisher, Berger, Sack and Flocken2016). Of particular interest in the current context, however, are measures incorporating multidimensionality, such as the weighted balance model of polarization (Schweighofer et al., Reference Schweighofer, Schweitzer and Garcia2020; Schweighofer and Garcia, Reference Schweighofer and Garcia2024), or the inter-issue correlation metric applied by others (Baldassarri and Gelman, Reference Baldassarri and Gelman2008; Abramowitz and Saunders, Reference Abramowitz and Saunders2008; Kozlowski and Murphy, Reference Kozlowski and Murphy2021). Similar to these models, our use of four-cycles of opposition or consistency in opinions between individuals accounts for opinion alignment.
Other metrics are concerned with the degree to which social ties and group boundaries are defined along political lines. Particularly in the case of affective polarization (Iyengar et al., Reference Iyengar, Sood and Lelkes2012), this has been examined as the difference between political ingroup like and outgroup dislike or other differences in social distance measures. However, defining exactly the boundaries of ingroups and outgroups is more complicated in a multiparty system (Wagner, Reference Wagner2021). While self-reinforcing mechanisms of ideological polarization, which assume an influence of politics on social ties and vice versa, are considered important in Schweighofer et al. (Reference Schweighofer, Schweitzer and Garcia2020) and Schweighofer and Garcia (Reference Schweighofer and Garcia2024), these are not explicitly considered part of the static measurement of polarization.Footnote 2 We therefore build on network-based measures of segregation such as the E-I index (Krackhardt and Stern, Reference Krackhardt and Stern1988), but incorporating multiple opinions rather than singular categorical variables. Drawing on the above studies, we use multilevel triads of agreement and disagreement between socially tied individuals to account for the social embeddedness of multiple political opinions.
The above proposed approaches are reasonable conceptualizations in specific empirical contexts. None, however, is suitable for empirical settings in which information on the social ties and individuals' positive and negative attitudes towards multiple issues are considered important features of polarization. Such settings can be conceptualized as multilevel networks to which our new measures are tailored.
2.4 Micro-level processes generating network polarization
We have introduced a set of metrics which allow us to describe the level of network polarization in society or smaller sub communities. Network polarization can be considered a macro-level feature. But through which processes does the network become polarized in the first place? Our network approach accommodates a number of potential micro-level social mechanisms that may generate different levels of ideological and relational polarization on the macro-level. Three general processes have been proposed in the network literature to explain the sorting of individuals by certain characteristics (such as their political attitudes): homophilous selection, social influence, and latent similarity or exposure to similar contextual effects (Shalizi and Thomas, Reference Shalizi and Thomas2011). Here, we review theoretical arguments and empirical evidence suggesting how each of these mechanism may be at play in ideological and relational polarization. We then discuss their interpretation as network mechanisms – structural processes in social networks that can be linked to multiple causal explanations (Stadtfeld and Amati, Reference Stadtfeld and Amati2021).
Homophilous selection. People generally tend to form ties with similar others (McPherson et al., Reference McPherson, Smith-Lovin and Cook2001). In a review of primarily social psychological literature, Huston and Levinger (Reference Huston and Levinger1978) suggest that interpersonal attraction, leading to ties such as friendship, may be related to attitudinal similarity. Indeed, there is evidence of homophily in the political domain. Social ties are suggested to be subject to homophilous selection on political attributes in the offline (e.g. romantic, marriage, informational discussion, and friendship ties, respectively; Huber and Malhotra Reference Huber and Malhotra2017; Alford et al., Reference Alford, Hatemi, Hibbing, Martin and Eaves2011; Huckfeldt and Sprague, Reference Huckfeldt and Sprague1987; Kandel, Reference Kandel2017) and online (primarily researched on Twitter networks, e.g., Conover et al., Reference Conover, Ratkiewicz, Francisco, Gonçalves, Menczer and Flammini2011; Boutyline and Willer, Reference Boutyline and Willer2017; Colleoni et al., Reference Colleoni, Rozza and Arvidsson2014) realms. However, a few studies have produced contradictory findings (e.g., Lazer et al., Reference Lazer, Rubineau, Chetkovich, Katz and Neblo2010; Wang et al., Reference Wang, Lizardo and Hachen2020) and others suggest that people tend not to disclose their political attitudes to their social connections, in particular if those may potentially be causing interpersonal conflict (Cowan and Baldassarri, Reference Cowan and Baldassarri2018; Goel et al., Reference Goel, Mason and Watts2010; Kitts, Reference Kitts2003).
Social influence. Another phenomenon examined more closely in the political and cultural domains is (assimilative) social influence. Several theories predict assimilative influence on political attitudes between connected individuals. The complexities of political issues may inhibit our ability to form consistent systems of beliefs ourselves (Converse, Reference Converse2006). This may lead to the use of actively shared information (Downs, Reference Downs1957) and influence from arguments expressed by others (Parker et al., Reference Parker, Parker and McCann2008). Furthermore, adopting similar opinions to ones' friends may help fulfill relational goals such as a need for a shared reality or to enjoy smoother interactions and more balanced relationships with others (Jost et al., Reference Jost, Ledgerwood and Hardin2008, Reference Jost, Federico and Napier2009; Heider, Reference Heider1946). There is some empirical support for social influence on political attitudes. Experimental evidence of networked communication of strangers suggests that individuals may have assimilative influence on one another (e.g., Friedkin Reference Friedkin1999). Some findings point to influence from persistent social ties on college students' left-right political identification (Lazer et al., Reference Lazer, Rubineau, Chetkovich, Katz and Neblo2010), although this has been debated (Wang et al., Reference Wang, Lizardo and Hachen2020), and stability of their issue attitudes (Levitan and Visser, Reference Levitan and Visser2009). Further, the vote choices of citizens have been shown to be affected by the choices of connected others (Huckfeldt and Sprague, Reference Huckfeldt and Sprague1987; Bello and Rolfe, Reference Bello and Rolfe2014).Footnote 3
Past work using agent-based simulation models suggest that social influence may contribute to polarization (e.g. DellaPosta et al., Reference DellaPosta, Shi and Macy2015). Agent-based models of opinion dynamics consider various types of influence and possible end states of the simulated systems (consensus, bipolarization, multi-polar clustering; Flache et al., Reference Flache, Mäs, Feliciani, Chattoe-Brown, Deffuant, Huet and Lorenz2017). Such micro-macro linkages are the mainstay of theoretically-defined agent-based models, and increasingly, methods are being developed to unite empirical micro-models for networks to macro-level outcomes (e.g., Duxbury, Reference Duxbury2024; Snijders and Steglich, Reference Snijders and Steglich2015).
Latent-cause reinforcement. Next to interpersonal processes, unobserved individual or contextual factors may contribute to the reinforcement of similar or opposed attitudes between individuals Shalizi and Thomas (Reference Shalizi and Thomas2011). Here we refer to this tendency as latent-cause reinforcement. Latent individual characteristics may cause people's attitudes about various political issues to be consistently similar or opposed over time. For example, the consumption of ideologically similar media may induce similar attitudes on multiple issues. This has been summarized in the concepts of filter bubbles and echo chambers in online spaces (Sunstein, Reference Sunstein2001; Pariser, Reference Pariser2011). Further, increasing polarization of the political elites to whom the mass public may look via such media for cues (Druckman et al., Reference Druckman, Peterson and Slothuus2013) may also contribute to polarization in society. However, studies have questioned the impact of these processes on polarization (Boxell et al., Reference Boxell, Gentzkow and Shapiro2017; Guess, Reference Guess2021; Weeks and Gil de Zúñiga, Reference Weeks and Gil de Zúñiga2021).
Similarly, unobserved social interactions between individuals could cause reinforcement of attitude similarity or dissimilarity. The role of latent individual and relational factors is in line with cultural sociological theory suggesting that perceptions of how sets of behaviors and beliefs fit together are affected by observations of their co-occurrence (Goldberg and Stein, Reference Goldberg and Stein2018).Footnote 4 Individuals may learn the associations between attitudes on multiple issues both in the context of media consumption and direct interpersonal communication, and adjust their own beliefs to these patterns.
Lastly, shared context may induce similarity in attitudes as well. For example, in the sample of university students which we use in this study, many may have recently moved away from culturally homogeneous neighborhoods into a more heterogeneous city, similarly affecting their perceptions on issues related to ethnic attitudes. This could, for example, make their attitudes towards other ethnic groups more favorable (Pettigrew, Reference Pettigrew1998).
The three processes—homophily, social influence, latent-cause reinforcement—can be interpreted as network mechanisms (Stadtfeld and Amati, Reference Stadtfeld and Amati2021). A network mechanism is defined by its structural position—local network structures and attributes that a focal actor or tie is embedded in—and its consequence, that a tie or a specific individual attribute is more likely to be present in that position. The homophily mechanism, for example, suggests that similarity of two nodes (a structural position) will be associated with a higher probability of observing a tie between them. Typically, multiple causal explanations can be linked to one network mechanism. This is also the case in our examples. The homophily mechanism is indeed not a single causal explanation in itself, but rather reflects a collection of causal mechanisms, including individual preferences, opportunity structures, and preferences on correlated confounding attributes.
3. Research questions and hypotheses
We aim to answer three research questions. These are formulated at different levels of analysis, ranging from micro processes to macro outcomes:
-
(1) What is the extent and trajectory of network polarization in two empirically observed communities? (macro level)
-
(2) Do three types of process—social selection, social influence, and latent-cause reinforcement—affect the evolution of the multilevel networks of social ties and political attitudes? (micro level)
-
(3) Do these three types of process explain the observed levels of network polarization? (linking micro and macro level)
To answer the first question, we examine network polarization in our empirical data using the network polarization metric and its sub dimensions introduced above. To answer the second question, we apply statistical models for dynamic networks on our dataset to explore the interpersonal and latent processes shaping political attitudes and social ties. We answer our third question by examining how the micro model fits the macro outcome using simulations: we assess how much our models from question two are able to explain the observed levels of polarization established in question one.
In our empirical study, we focus on friendships as social ties, which is motivated by an extensive literature demonstrating their often reciprocal relation with a variety of individual outcomes, such as cultural tastes (Lomi and Stadtfeld, Reference Lomi and Stadtfeld2014; Lewis and Kaufman, Reference Lewis and Kaufman2018; Lizardo, Reference Lizardo2006), mental health (Schaefer et al., Reference Schaefer, Kornienko and Fox2011), physical health (Salvy et al., Reference Salvy, de la Haye, Bowker and Hermans2012) and delinquent behaviors (Brechwald and Prinstein, Reference Brechwald and Prinstein2011).
In answering the second question, we test three hypotheses. First, in line with the aforementioned theory and evidence suggesting homophilous social selection occurs on political variables, we hypothesize that:
H1: social selection
H1a (attraction of attitude similarity): the more individuals agree on political topics,
the more likely they are to be friends over time.
H1b (repulsion of attitude dissimilarity): the more individuals disagree on political topics,
the less likely they are to be friends over time.
In terms of our multilevel network approach, this would be represented as shown in Figure 3 with the correspondingly-marked hypotheses: The probability of a friendship tie between two individuals is expected to increase with the number of shared, same-valenced connections to any political issue node (H1a), and decrease with the number of shared, opposed valence connections to any political node (H1b).
Second, in line with research suggesting influence between individuals on political variables, we hypothesize that
H2: social influence
H2a (influence of friends): individuals who are friends
are more likely to share attitudes over time.
H2b (non-opposition to friends): individuals who are friends
are less likely to have opposed attitudes over time.
As depicted in Figure 3, the hypotheses suggest that the probability of an attitude tie of a given valence is expected to increase with the number of friends having the same attitude to the political issue node. For H2a, we would expect individuals sharing a friendship tie to have a higher probability to create or maintain an attitude which is the same as that of their friends. For H2b, we expect a decreased probability of maintaining or forming an attitudinal tie in opposition to that of their friends.
Third, we recognize that there may be important unobserved and/or contextual factors which may lead to the reinforcement of (dis)similarity over time. We thus formulate the hypothesis that:
H3: latent-cause reinforcement
H3a (latent-cause convergence): the more similar individuals are in some political attitudes,
the more likely they are to be similar in others.
H3b (latent-cause divergence): the more dissimilar individuals are in some political attitudes,
the more likely they are to be dissimilar in others.
Figure 3 illustrates that the probability of an attitude tie of a given valence is expected to increase with the number of others having the same attitude to the issue and the number of further issues on which they agree with the focal individual, whose attitude tie is considered (H3a). In the diverging formulation, the attitudinal tie is expected to be more likely if more others who have opposite attitudes on different issues have opposite attitudes on the issue at hand as well (H3b).Footnote 5
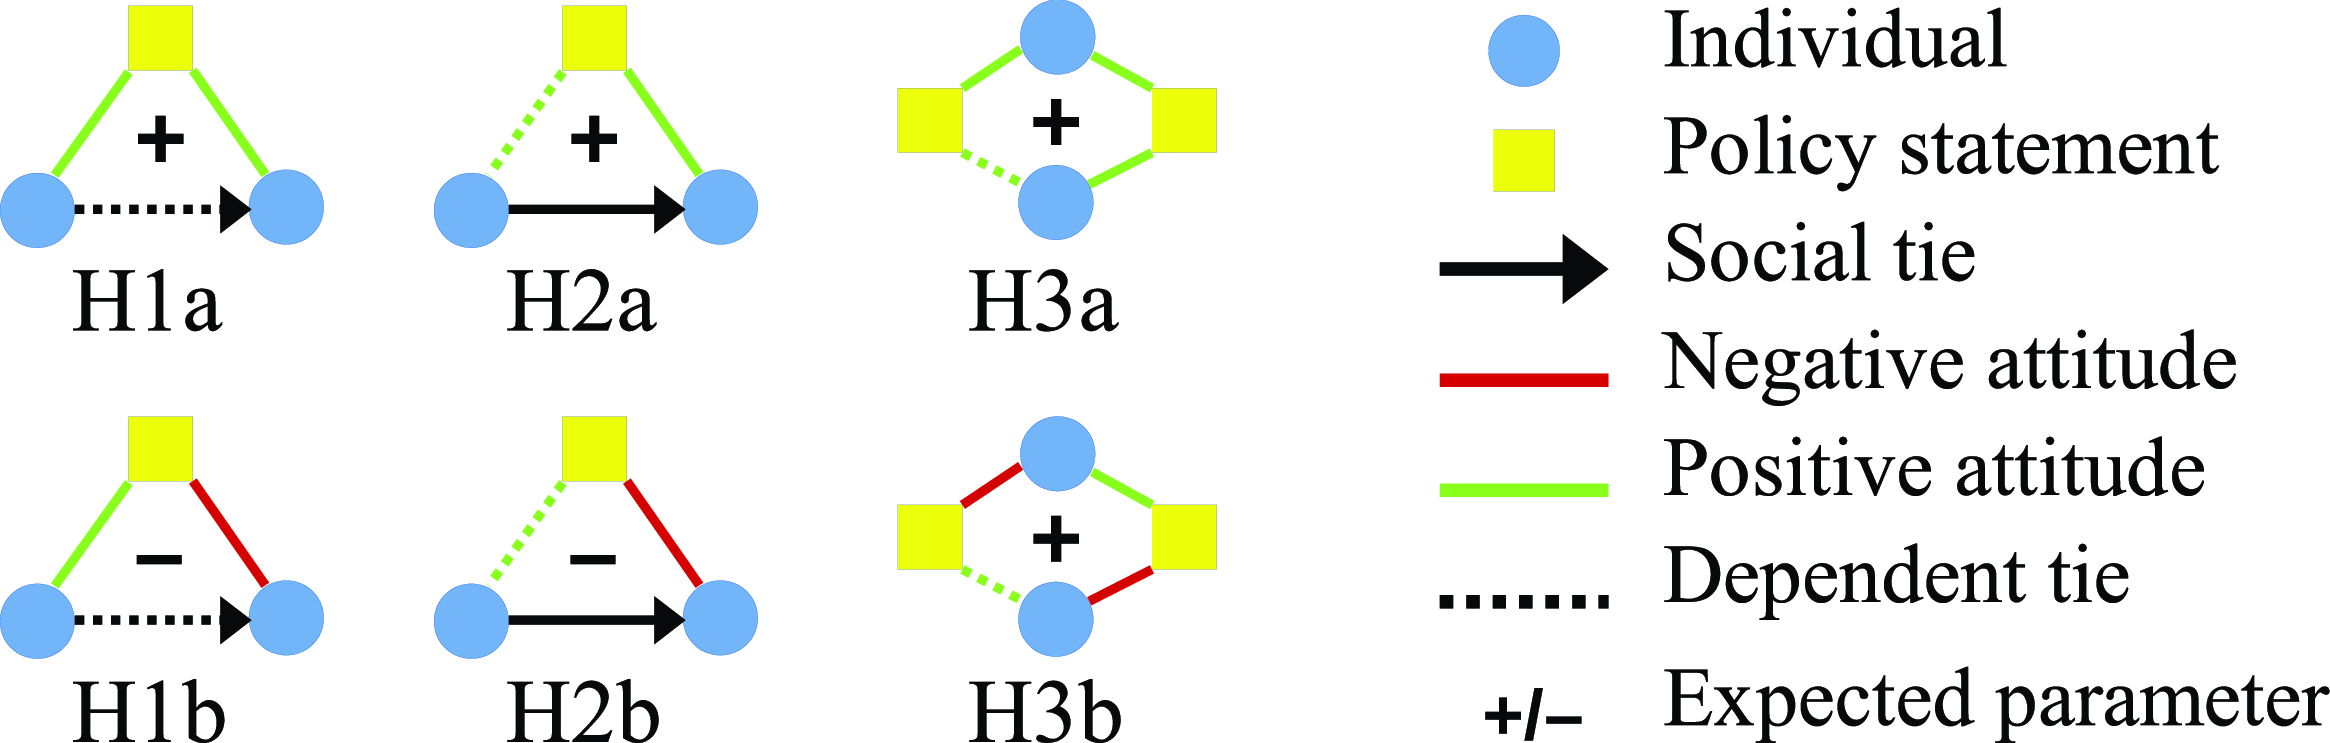
Figure 3. Depiction of multilevel network hypotheses. H1: selection. H2: influence. H3: latent-cause reinforcement.
4 Data
To answer our research questions, we collected longitudinal survey data on friendships and political attitudes in two student communities in the scope of the Swiss StudentLife (Vörös et al., Reference Vörös, Boda, Elmer, Hoffman, Mepham, Raabe and Stadtfeld2021) study. The data come from two undergraduate student cohorts, majoring in two different STEM subjects, at a technical university in Switzerland. We use data from the first five survey waves of the study (denoted W1–W5), which were collected between September 2017, the first week of the degree program, and May 2018, the end of the first academic year. We will refer to the two cohorts as Cohort 1 and Cohort 2 from here onward.
The cohorts comprise respectively a total of $N_{1}$
= 261 and
$N_{1}$
= 261 and $N_{2}$
= 660 registered students, of whom 72% and 75% participated in any of the five surveys. Response rates amongst students belonging to the cohorts at the time of each survey varied between 77% and 60% for Cohort 1, and 76% and 48% for Cohort 2.Footnote
6
For demographic details including year of birth, gender proportion, political orientation, and nationality, see Table 2. The surveys were administered online, in German, using the Qualtrics platform. Details of the data collection and ethical considerations are discussed extensively in Vörös and colleagues (Reference Vörös, Boda, Elmer, Hoffman, Mepham, Raabe and Stadtfeld2021). A visualization of the final observation used in Cohort 1 is presented in Figure 4. Zooming in on two social cliques, we can see some interesting variations; clique A shows opinion clustering between members in their opposition on items related to a nationalized banking system, abolishing TV and radio license fees, and providing a universal basic income. Clique B contains generally less opinionated individuals. Nonetheless, there is both disagreement and agreement between cliques: there exists both support and opposition for mandatory vaccination of children in clique A, and support in B. A requirement for website owners to combat fake news was opposed in clique A but supported in clique B, and both cliques agree on issues relating to state financed renewable energy and improving bicycle infrastructure.
$N_{2}$
= 660 registered students, of whom 72% and 75% participated in any of the five surveys. Response rates amongst students belonging to the cohorts at the time of each survey varied between 77% and 60% for Cohort 1, and 76% and 48% for Cohort 2.Footnote
6
For demographic details including year of birth, gender proportion, political orientation, and nationality, see Table 2. The surveys were administered online, in German, using the Qualtrics platform. Details of the data collection and ethical considerations are discussed extensively in Vörös and colleagues (Reference Vörös, Boda, Elmer, Hoffman, Mepham, Raabe and Stadtfeld2021). A visualization of the final observation used in Cohort 1 is presented in Figure 4. Zooming in on two social cliques, we can see some interesting variations; clique A shows opinion clustering between members in their opposition on items related to a nationalized banking system, abolishing TV and radio license fees, and providing a universal basic income. Clique B contains generally less opinionated individuals. Nonetheless, there is both disagreement and agreement between cliques: there exists both support and opposition for mandatory vaccination of children in clique A, and support in B. A requirement for website owners to combat fake news was opposed in clique A but supported in clique B, and both cliques agree on issues relating to state financed renewable energy and improving bicycle infrastructure.
Table 2. Individual descriptives

Note. Political orientation ranged from 0 to 10, and was assessed by a standard left-right self-placement scale adapted from the European Social Survey: “In politics people sometimes talk of ‘left’ and ‘right’. Where would you place yourself on this scale, where 0 means the left and 10 means the right?” (European Social Survey ERIC, Reference European Social Survey2017).
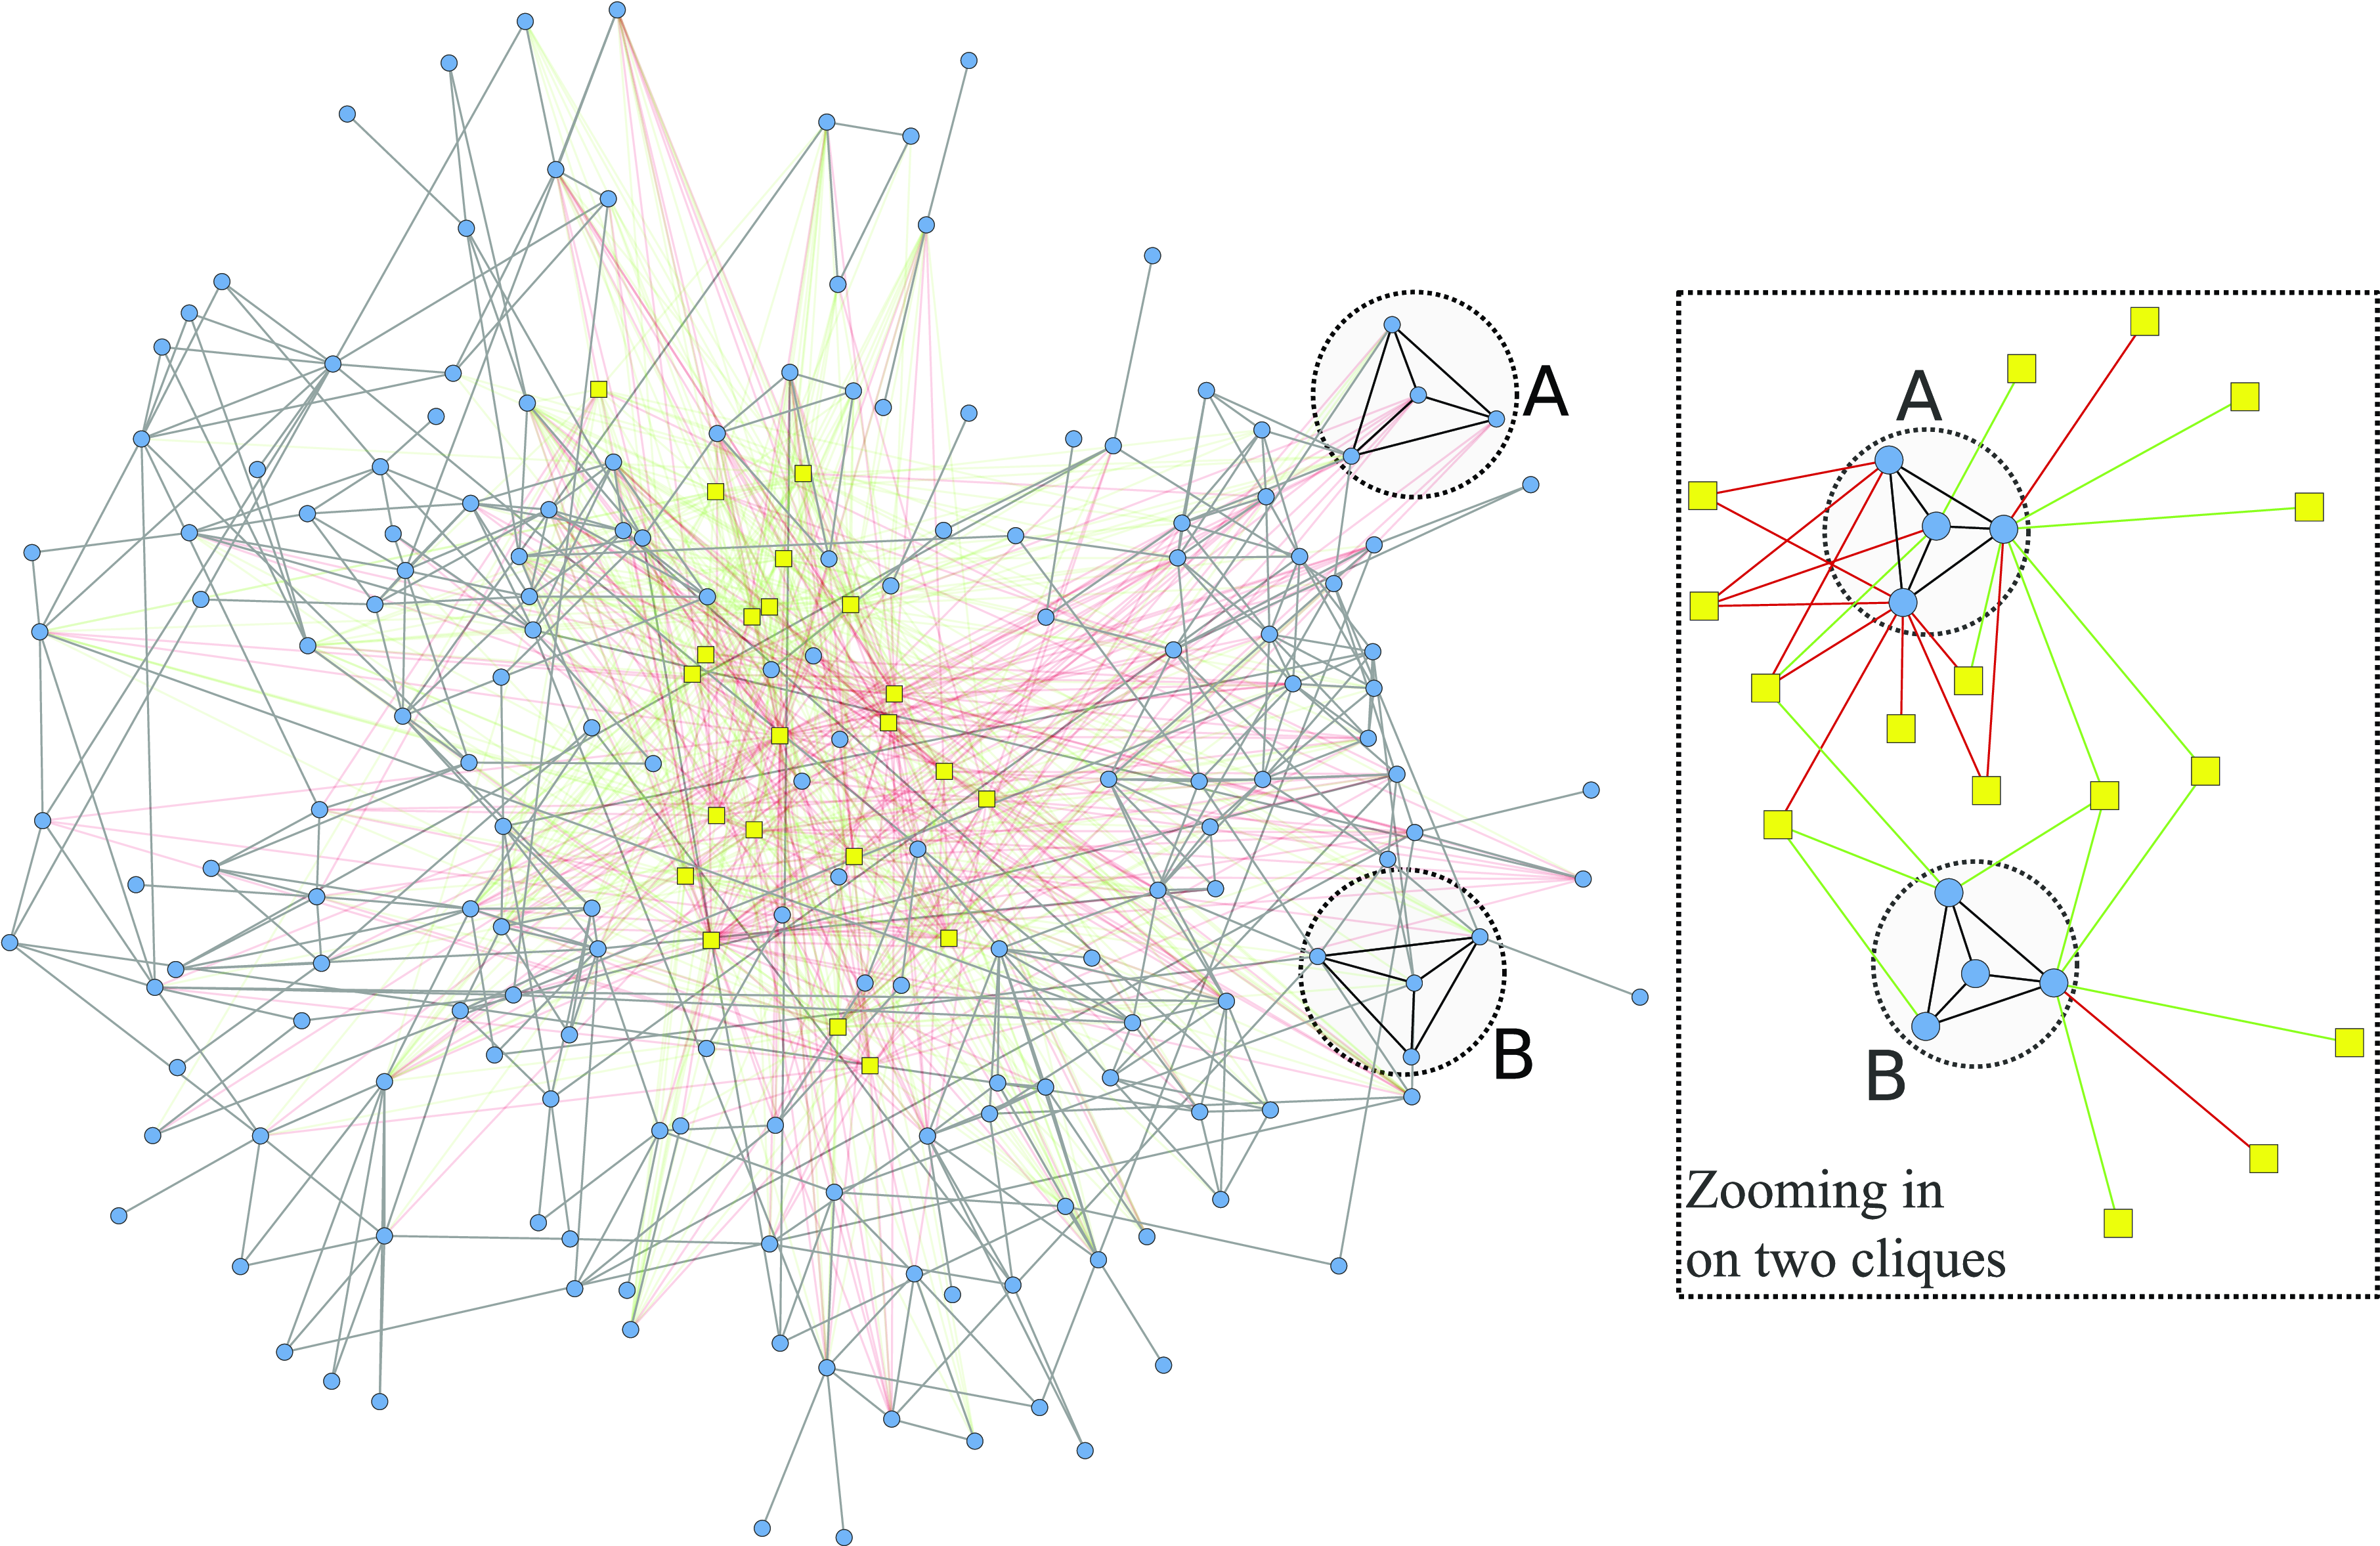
Figure 4. Multilevel network of individuals and attitudes at wave 5, in Cohort 1. Circles represent individuals, squares political attitudes. Dark-gray ties are symmetrized friendship nominations, dark-red and light-green ties represent negative and positive attitudes, respectively. The friendship ties within two cliques of individuals as well as their members' non-neutral attitudes towards 16 items are shown on the right. Layout by backbone algorithm (Nocaj et al., Reference Nocaj, Ortmann and Brandes2015). Arrowheads representing tie direction omitted for clarity.
4.1 Friendship networks
The friendship networks were collected in every survey wave by a hybrid roster-name generator approach (see e.g., Robins Reference Robins2015, chapter 5). Individuals were asked the question: “Whom do you consider a friend?”. They could name up to 20 people in their answer. The names were limited to those of fellow students, and could be chosen from an auto-completing list. Each reported name at a given time point was coded as a binary, directed friendship tie. The friendship data have been analyzed in prior publications (Stadtfeld et al., Reference Stadtfeld, Vörös, Elmer, Boda and Raabe2019; Elmer and Stadtfeld, Reference Elmer and Stadtfeld2020; Raabe, Boda and Stadtfeld, Reference Raabe, Boda and Stadtfeld2019; Boda et al., Reference Boda, Elmer, Vörös and Stadtfeld2020).
4.2 Political attitude networks
The political attitude networks were constructed from answers to a 22-item battery of political statements asked in every survey wave. We provide a summary of the topics covered by these statements here and report the full list of items in Appendix B. These items have been developed for the purpose of this study and were not used in prior publications. We therefore describe them in some more detail.
The attitude statements were taken from two sources. First, from an online tool created by the German Federal Agency for Civic Education, which was designed to give individuals advice on the German political parties best representing their views—the Wahl-O-Mat (Bundeszentrale für politische Bildung [Federal Agency for Civic Education], 2017). We selected a subset of the items that applied to the Swiss political system, but were face-valid issues for much of Western Europe at the time. For example, items covered whether there should be mandatory child vaccination against contagious diseases, government-regulated cannabis sales, increased state support for social housing, and expansion of video surveillance in public spaces.
The second source of our attitude statements was the list of upcoming national referenda in Switzerland, sourced from the Swiss Federal Chancellery (Bundeskanzlei 2017a; 2017b).Footnote 7 The referendum topics at the time of our study included, for instance, whether mandatory radio and television fees should be replaced by commercial financing, more bike paths should be added to public roads, and imported foods should be held to standards set for Swiss-cultivated products.
Each statement taken from these two sources comprised a position that a policy should attempt to fulfill. Participants indicated their (dis)agreement with each statement on a 7-point Likert scale: “strongly disagree” (= 1), “disagree,” “somewhat disagree” through the midpoint, “neither agree nor disagree,” to “somewhat agree,” “agree” and “strongly agree” (= 7). An additional option was provided for “no opinion,” which we recoded to the same value as the midpoint of the scale for the present analysis. This decision was supported by robustness checks.Footnote 8 Appendix C shows means and standard deviations of these variables by cohort at first and last observation.
Based on these items, we defined two two-mode political attitude networks for each survey wave. In one network, ties connect students to statements if they reported support for them, in the other if they indicated their opposition to them. Neutral opinions are indicated by tie absence in both networks.
We used the following thresholds to recode the original 7-point attitude scales to the two binary attitude networks. The three middle options (“somewhat agree,” “neither agree nor disagree,” and “somewhat disagree”) represented a neutral attitude and were coded as “0” in both networks. The two outer options on either end of the scale (“agree,” “strongly agree” vs. “disagree,” “strongly disagree”) were treated as a tie and were coded as “1” in the positive and negative two-mode network, respectively. Robustness checks with alternative trichotomizations were performed.Footnote 9 Thus, towards each of the 22 political statements per wave, each individual could have either a “1” in the positive network and a “0” in the negative network, a “0” in the positive network and a “1” in the negative network, or a “0” in both networks.
4.3 Individual background variables
In the dynamic network model, we accounted for the impact of various individual attributes on the changes in the friendship network. These included gender, age, and language spoken with one's family. Further, we used a categorical variable to represent the four different sub-majors of Cohort 1 (Cohort 2 consisted of a single major). Gender and age were included as they are fundamentally important in social networks research (McPherson et al., Reference McPherson, Smith-Lovin and Cook2001:417). In the empirical context, where a variety of languages were spoken both by Swiss students and those from abroad, language had a clear potential to help or hinder friendships. Finally, sub-major was included in our analyses since students in the same sub-major they shared more classes in Cohort I, which affected their opportunities to become friends. In robustness analyses we further considered a single-item variables indicating participants' self placement on a left-right political spectrum.Footnote 10
5. Methods
5.1 Assessing the extent of macro-level network polarization
The ideological and relational polarization metrics of network polarization defined in Formulas 1 to 4 can be used to assess the extent of macro-level network polarization in a multilevel networks. As the number of ties in each network may affect the theoretical maximum level of polarization, we normalize each term in each metric by its expectation given the distribution of ties in the network, yielding a metric distributed between zero and one that further conditions on some observed network features with 0.5 being the expectation under randomness.
In case of ideological polarization, normalization is achieved by rewiring the attitude network randomly (thus conditioning on the observed in- and outdegrees of all nodes in the positive and negative attitude networks; missing data are not rewired). In case of relational polarization this is achieved by permuting the friendship network (thus conditioning on its exact structure) and recalculating the relevant terms, holding the attitude network constant. We take the average of each formula term from 1,000 permutations, generated separately for each observed network and not counting structures involving missing tie data.
The resulting metrics range from zero to one, with values above the midpoint of 0.5 being more polarized, and values below less polarized, than the expectation. To test whether the observed level of polarization is significantly different from the midpoint, we compare it to the distribution of random outcomes generated by the rewiring/permutation procedure above, thereby generating non-parametric p-values. This procedure is essentially a conditional uniform graph test (CUG, Stadtfeld and Amati Reference Stadtfeld and Amati2021:438–440).
5.2 Modelling micro-level friendship-attitude dynamics
We apply stochastic actor-oriented models (SAOMs), which are suited to examine the co-evolution of the multilevel network (Snijders et al., Reference Snijders, Lomi and Torló2013) of friendships between individuals, i.e. a one-mode network, and positive and negative attitudes from individuals to political statements, i.e. two two-mode networks. We used the implementation of this model in RSiena (Ripley et al., Reference Ripley, Snijders, Boda, Vörös and Preciado2019), version 1.2–16, modified with new structural effects that were implemented for this article as described below. The model was estimated by the Method of Moments (Snijders, Reference Snijders2001) and model convergence was ensured.Footnote 11 Missing data in all networks were treated by the default method in RSiena: if available, the last observation is carried forward, otherwise the tie is imputed as zero.
The SAOM is a statistical model for tie changes in dynamic networks. It aims to estimate the change in relative probability of actors' choice of ties to create and maintain, given the relevant local network structures specified by the modeler. It is assumed that the network observation at time $T_n$
transitions to the the network observation at time
$T_n$
transitions to the the network observation at time $T_{n+1}$
by a process in which individuals take turns to update their outgoing ties to other entities (in our case, other individuals and political items) based on the current state of their local network.
$T_{n+1}$
by a process in which individuals take turns to update their outgoing ties to other entities (in our case, other individuals and political items) based on the current state of their local network.
Model specification. In our main model, we include all parameters that are necessary to test our hypotheses. In addition, we include standard structural terms for friendship networks: reciprocity, a three-parameter specification to capture clustering, outdegree popularity, indegree popularity, and outdegree activity to capture mechanisms generating degree distributions, as well as effects of gender on sending and receiving ties. Finally, we included terms for homophily on the background variables (gender, age and language spoken with family). Similarly to the friendship network, we include terms for indegree popularity on the attitude networks, accounting for the fact that individuals may be more likely to have stronger attitudes on some topics than others.
Due to the high level of change in friendships between waves 1 and 2 (wave 1 was collected during the first university week when few friendship relations had been established, wave 2 after one month), we estimate the models for change in the networks from waves 2–5 separately from wave 1–2. As the negative and positive attitude networks are treated as separate networks, all hypotheses are represented by duplicate parameters: once for each pairing of the two attitudinal tie valences. From Figure 3, all hypothesized structures pictured are thus also included with each positive or negative two-mode tie swapped to the alternate valence. As a concrete example, a friendship is dependent on individuals sharing a positive attitude of some political statement (homophily from pos. opin.), and on a sharing negative attitudes of another political statement (homophily from neg. opin.). See Appendix D for two tables with a graphical depiction of the main parameters, and Appendix E for standard RSiena notation for all parameters.
As the conceptual approach to the model is novel, several effects were newly implemented in RSiena. These are described in detail in Appendix F. The first new effect represents the tendency against having friendships in which disagreement occurs (corresponding to H1b), the second represented the expected tendency against having contrary attitudes to ones' friends (corresponding to H2b). Furthermore, two effects were implemented to capture the tendency to become less similar to others with whom one disagrees (corresponding to H3b). These effects are also indicated in the aforementioned tables in Appendix D.
5.3 Linking micro processes and macro outcomes of polarization
Finally, we assess through simulations in how far the process-based micro-level model is able to reproduce the observed macro-level outcome of network polarization (Snijders and Steglich, Reference Snijders and Steglich2015). To study the micro-to-macro link, we follow the goodness-of-fit method proposed for SAOMs in Lospinoso and Snijders (Reference Lospinoso and Snijders2019). This method first populates distributions of selected structural statistics from networks simulated from the model over a fixed period, starting from the observed data at the earlier time point. The simulated distributions are then compared with the same statistics in the observed network at the later time point.
In our case, we calculate the level of polarization in each simulated network, following the same procedure applied to the observed data. We can then compare the distribution of levels of polarization in these simulated networks to the level of polarization in our observations. Since the simulations are generated from the estimates of micro-level processes, they help us to understand if the estimated micro-level model produces, at the macro-level, polarization similar to the macro-level observation.
6. Results
Both studied cohorts are made up of students who are typically young Swiss males with a slightly left-leaning political orientation (Table 2). Further, students in both cohorts reported having few friends on average in the first week of their studies (0.9 in Cohort 1 and 1.5 in Cohort 2). This rose to around two friends per student by the second wave of data collection and stabilized at that level. Friendship ties themselves became fairly stable over time: 37% (Cohort 1) and 55% (Cohort 2) of the friendships that were reported in the first or second waves were reported in both, while tie stability increased to 66-76% between later waves. Out of the 22 political statements, students reported agreeing with 3–4 and disagreeing with 2–3 on average throughout the observation period in both cohorts. Attitude ties were largely, but not completely, stable over time, with around 70% of positive and negative attitudes towards specific statements remaining unchanged between subsequent data collection waves. See Appendix G for detailed descriptive statistics of the friendship and political attitude networks.
6.1 How polarized are the two cohorts?
To answer our first research question, we explore the development of the normalized metrics for relational and ideological polarization in the two networks over time. Figure 5 presents the values of the two metrics at each of the five data collection waves in each cohort. The lines in the figure connect subsequent waves to highlight the “trajectory” of the communities in the polarization space. Network polarization is consistently higher than the random expectation of 0.5 on both the relational and ideological dimensions. There is also a slight increase in polarization between the first and last waves. However, there is no clear trend in intermediate observations and all statistics are close to the midpoint of the scale. Overall, the communities appear to become more polarized over the year, but only to a small extent and through a noisy process.
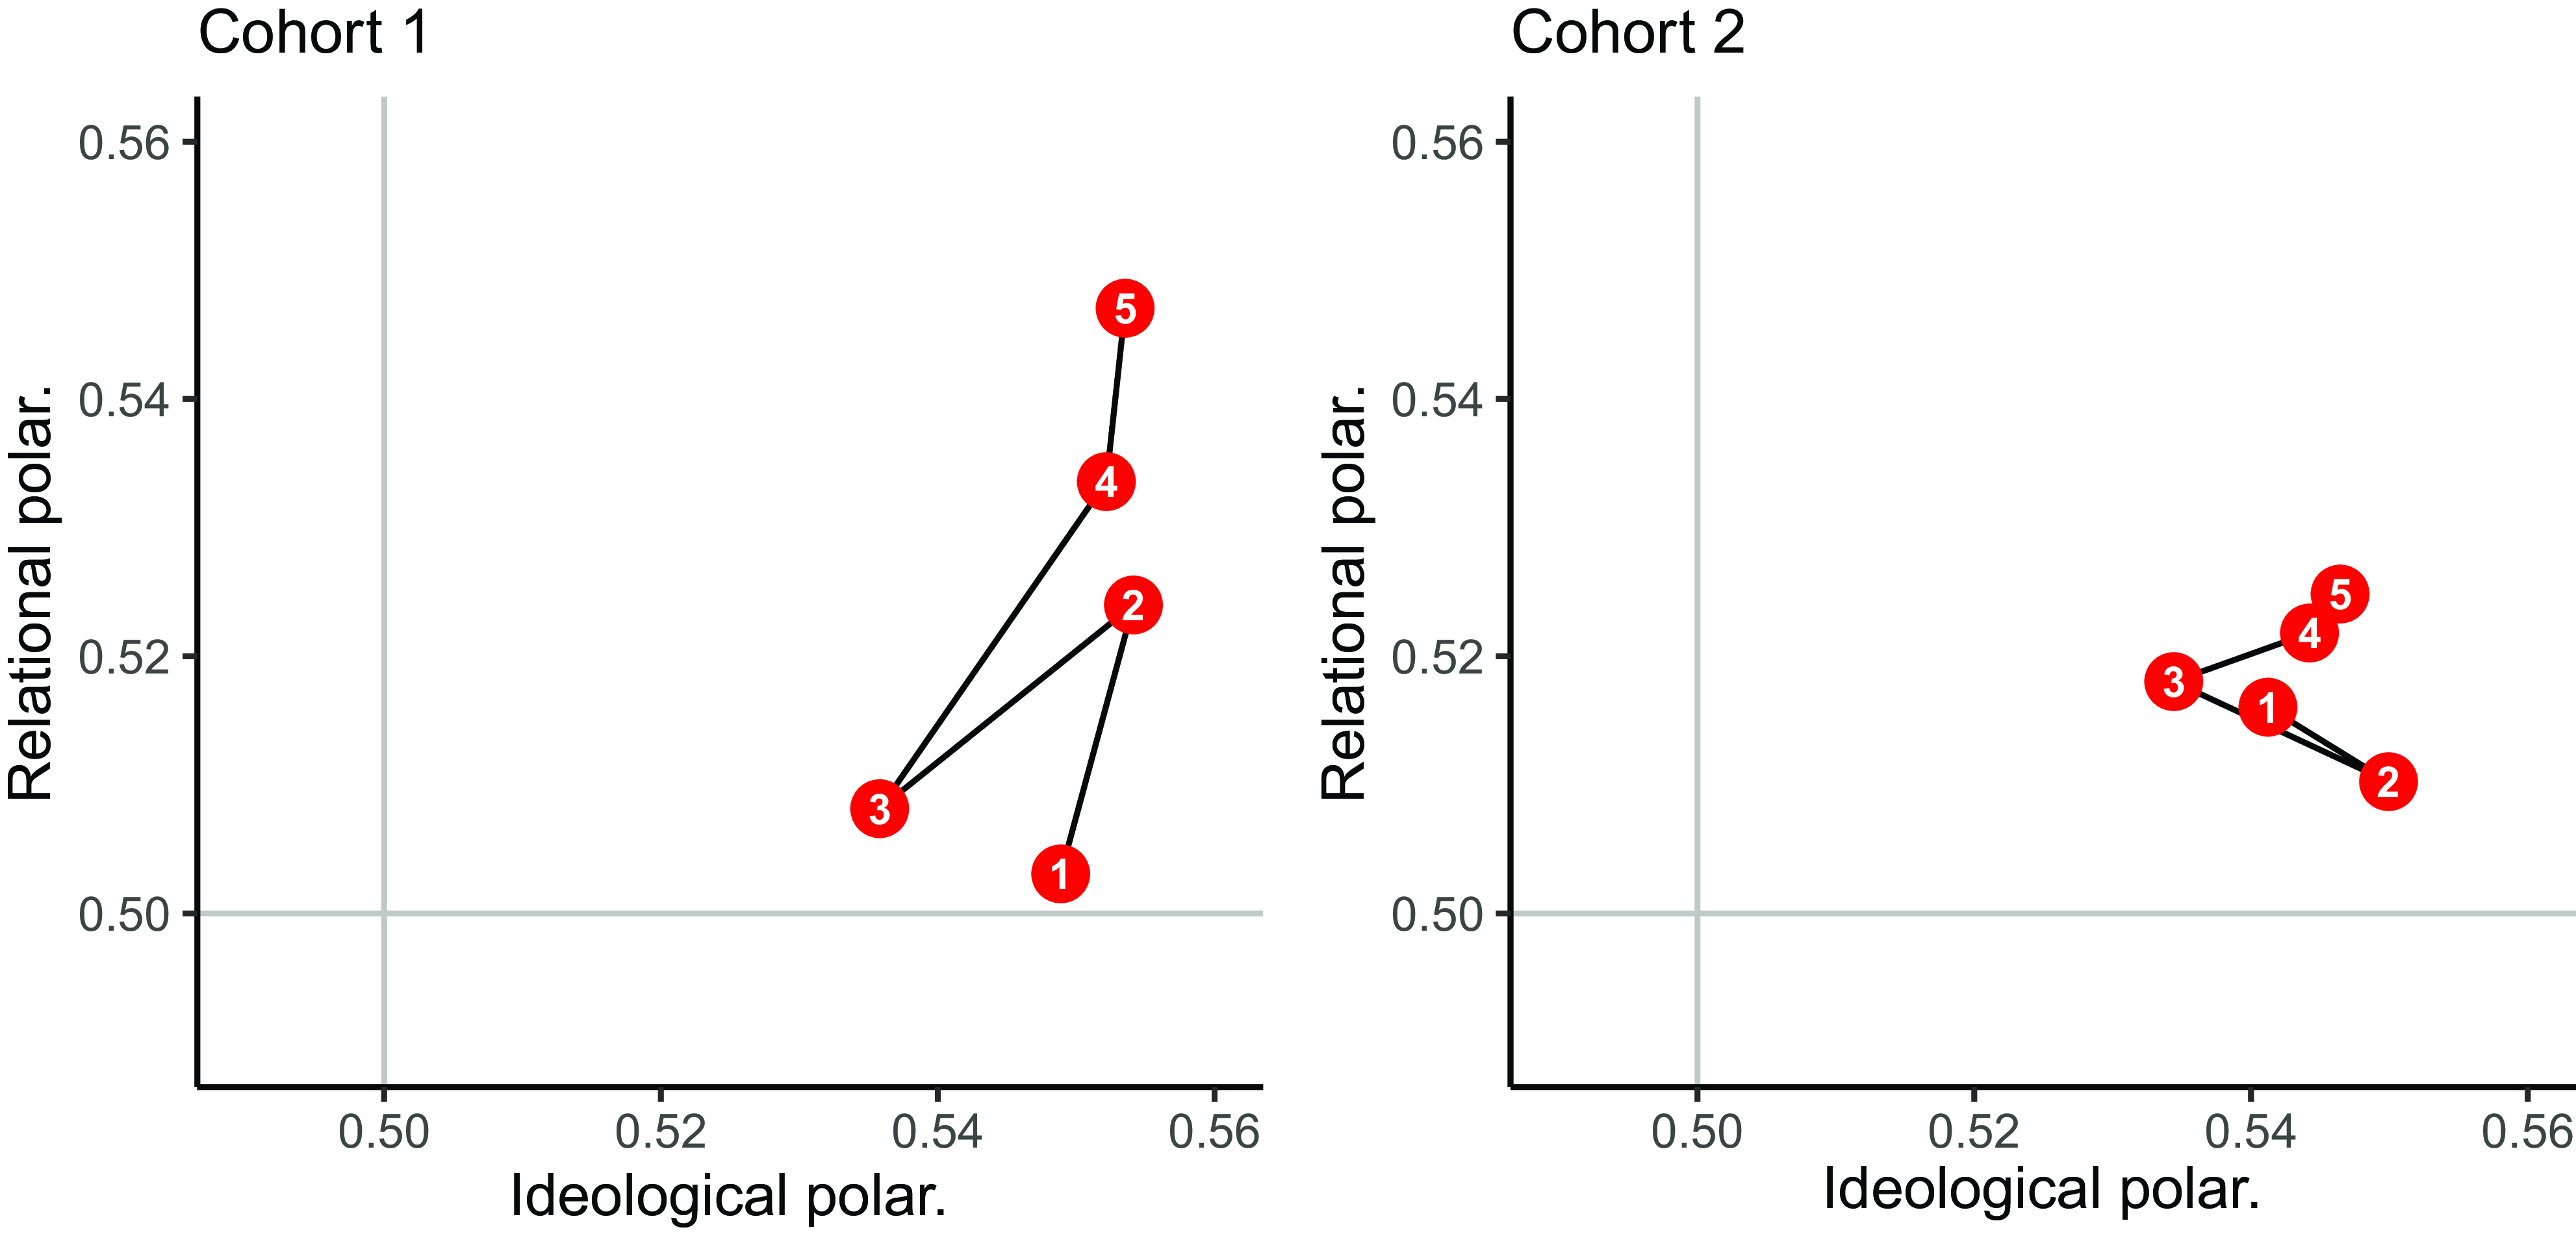
Figure 5. Two-dimensional network polarization in two cohorts, with each circle representing one observation point, indicated by the digit in the circle. Axes are truncated. There is no clear trend towards polarization over time in our data, and the data are tightly clustered relative to the range of the measure.
Following the interpretation of the observed levels of polarization, Figure 6 presents results from statistical tests of the differences between the observed metrics and their expected value at the first and last wave in each cohort. In each figure panel, the large red circle indicates the observed values of the two metrics. The cloud of smaller gray circles represents values from random draws from the null distributions (as explained in the Methods section), with the blue diamond marking their means. In all cases, observed ideological polarization lies clearly to the right of the vertical dotted line, showing that its value is significantly above expectation ( $p\lt .001$
in all cases). Results for relational polarization are mixed: at wave 1, the metric in Cohort 1 is close to the expected value (
$p\lt .001$
in all cases). Results for relational polarization are mixed: at wave 1, the metric in Cohort 1 is close to the expected value ( $p=.480$
), while it is significantly above it in Cohort 2 (
$p=.480$
), while it is significantly above it in Cohort 2 ( $p=.011$
). By wave 5, however, relational polarization is significantly above expectation in both cohorts (Cohort 1:
$p=.011$
). By wave 5, however, relational polarization is significantly above expectation in both cohorts (Cohort 1: $p\lt .001$
; Cohort 2:
$p\lt .001$
; Cohort 2: $p=.002$
).
$p=.002$
).
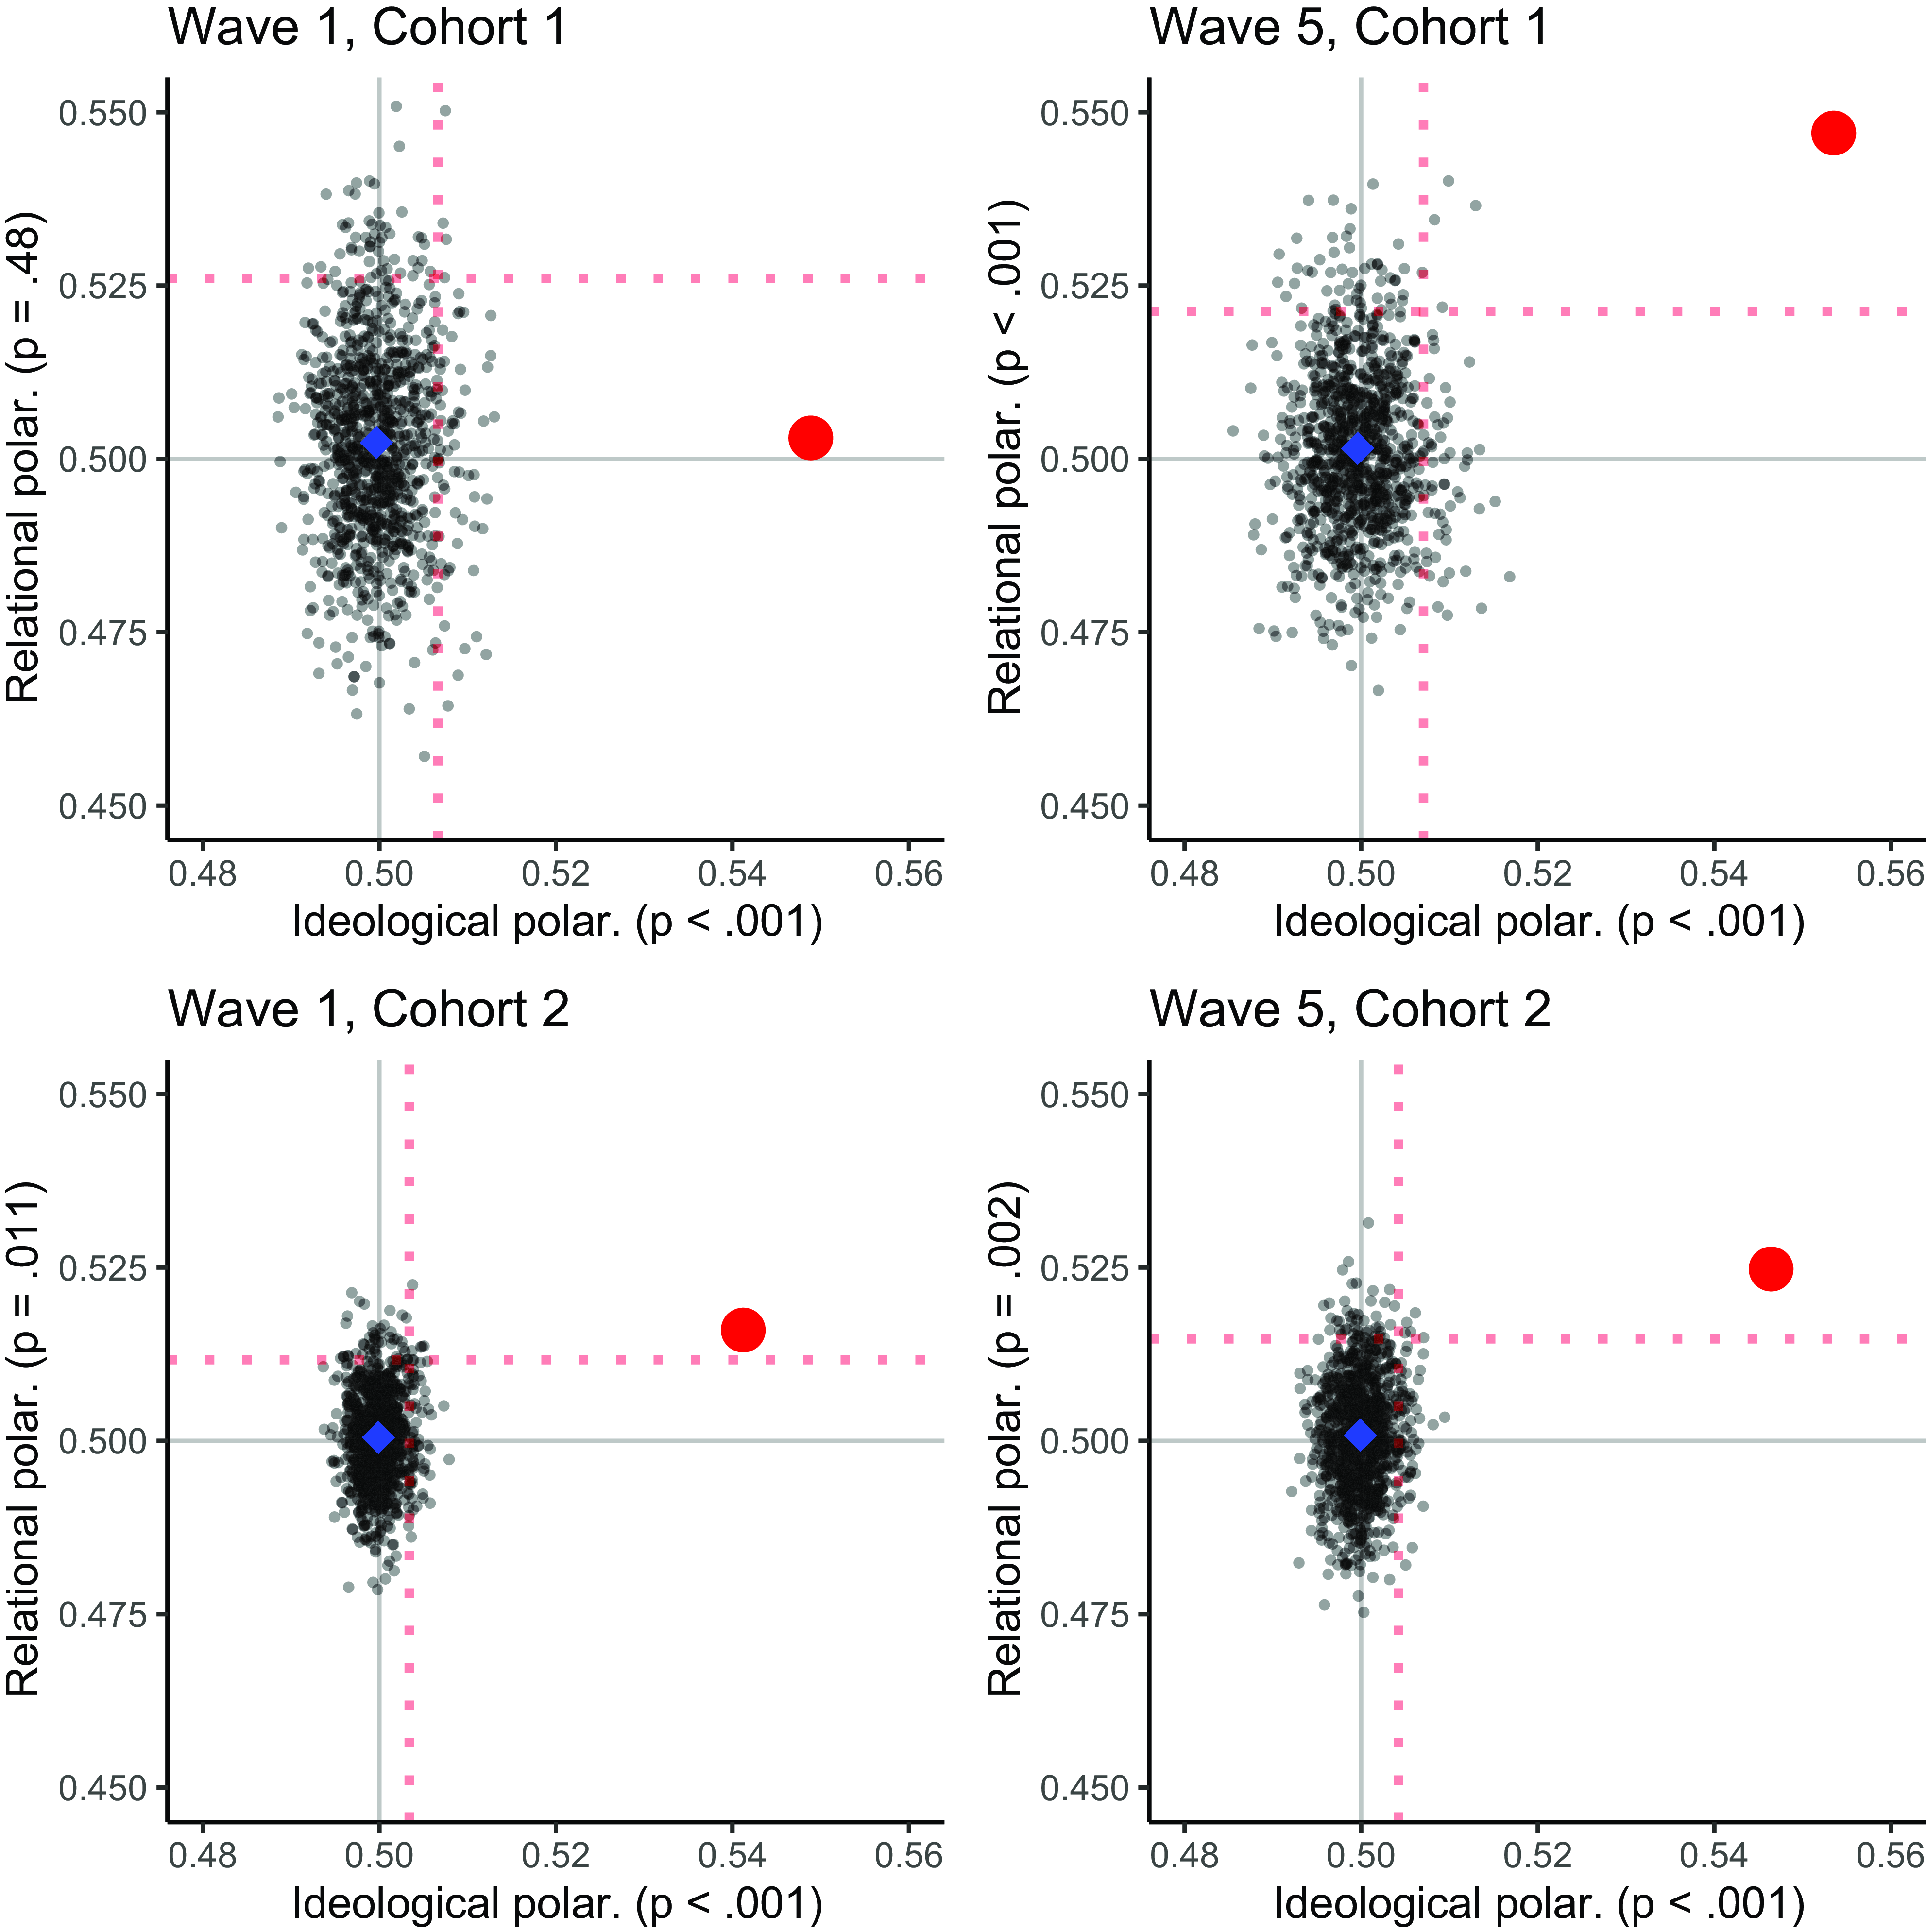
Figure 6. Two-dimensional observed network polarization (red circle) relative to expectation in two cohorts (blue diamond centered in the point cloud). Dotted lines indicate the boundary for $p\lt .05$
(one-tailed). The horizontal line indicates relational polarization, while the vertical line indicates ideological polarization.
$p\lt .05$
(one-tailed). The horizontal line indicates relational polarization, while the vertical line indicates ideological polarization.
6.2 Which hypothesized processes affect the evolution of the cohort networks?
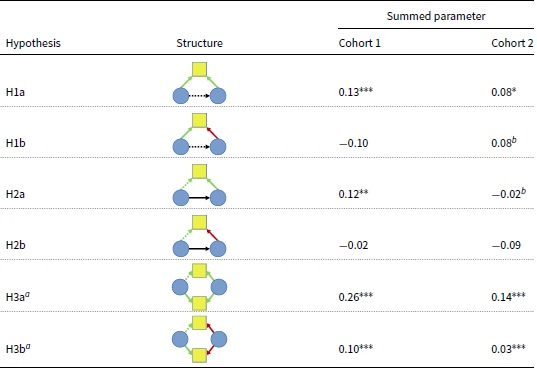
To evaluate our three hypotheses and answer the second research question, we now present dynamic stochastic actor-oriented models explaining changes in the multilevel networks of the two cohorts. These models provide an adequate fit to the data from both cohorts across a range of relevant model fit statistics (see Appendix H–Appendix J for details). We focus our attention to the results pertaining to our hypotheses. As explained above, our models include further individual and network structural variables (see Appendix E for full parameter tables). Due to the coding of positive and negative attitudes as two separate networks, each hypothesis needs to be evaluated based on multiple (2–4) model parameters. We summarize parameters per hypothesis using Wald tests of their linear combinations (see Appendix D for separate parameter estimates for each hypothesis).
The main results are shown in Table 3. Although not identical, the results are consistent in the two cohorts and are robust to alternative variable definitions and model specifications (see Appendix K). The findings partly confirm the social selection hypothesis (H1). Wald tests in both cohorts support H1a: individuals are more likely to form and maintain friendships with others with whom they share more political attitudes. On the contrary, we do not find evidence for H1b, that individuals would avoid to be friends with those with whom they disagree, in either cohort.
Table 3. Joint tests of stochastic actor-oriented model estimates by hypothesis
p-value from Wald tests of summed parameters. $^{***}p\lt 0.001$
,
$^{***}p\lt 0.001$
, $^{**}p\lt 0.01$
,
$^{**}p\lt 0.01$
, $^*p\lt 0.05$
. Dependent tie is dotted line.
$^*p\lt 0.05$
. Dependent tie is dotted line. $^{a}$
Parameter multiplied by 10.
$^{a}$
Parameter multiplied by 10. $^{b}$
contra-hypothesis parameter direction.
$^{b}$
contra-hypothesis parameter direction.
Further, the models provide weak confirmation that social influence shapes the network over time (H2). For H2a, that friends are more likely to adopt and maintain similar attitudes, results are mixed. There is evidence for this social influence process in Cohort 1, but not in Cohort 2. In turn, we do not find evidence for H2b, that individuals would avoid attitudes that oppose those of their friends, in either cohort. Finally, there is strong an consistent support for latent-cause reinforcement (H3). In both cohorts, individuals with similar attitudes tend to sustain or increase their similarity over time, supporting H3a. Likewise, those with dissimilar attitudes tend to sustain or increase their disagreement, supporting H3b.
Overall, we see consistent evidence of ideological structuring, but weaker evidence of relational processes contributing to polarization. This is in line with the macro-level patterns of weak network polarization presented earlier above. Positive social selection (H1a) and latent cause reinforcement (H3a and H4b) are consistently supported. Positive influence (H2a) is supported only in Cohort 1, while negative selection (H1b) and negative influence (H2b) are not supported in either cohort.
6.3 Do the micro-level processes explain network polarization?
To answer our last research question, we calculate the ideological and relational polarization metrics (the two sub metrics of network polarization) in 400 networks randomly drawn from the stochastic actor-oriented model of each cohort presented previously (see Appendix E for the full models). We get 400 networks from 100 simulation sequences, drawing one network at the end of each of the four observation periods (waves 2–5; wave 1 is excluded as the model is conditional on the initial state of the network). We compare the polarization metrics from the simulated networks with those observed in each cohort to assess how well the micro-level models reproduce macro-level polarization patterns.
Figure 7 presents the results of the comparison. Numbered circles in the figure indicate the observed polarization metric values at different time points (similar to Figure 5), with a red diamond (labeled “M”) showing their mean. The simulated metric values are shown in gray, with the smaller blue diamond in the center of the point cloud representing their mean. Simulated polarization values are typically higher than the random expectation of 0.5, indicating that the model generates networks that are somewhat polarized. The observed network polarization metrics tend to lie within the cloud of simulated values, which shows that the model reproduces the observed macro-level outcome reasonably well. However, some of the observed values are found in the periphery of the distribution. In Cohort 1, the model generates less relational polarization than observed in wave 5. In Cohort 2, the model produces too little ideological polarization in waves 2, 4, and 5. Detailed results for the attraction and repulsion aspects for each sub dimension are presented in Appendix L.
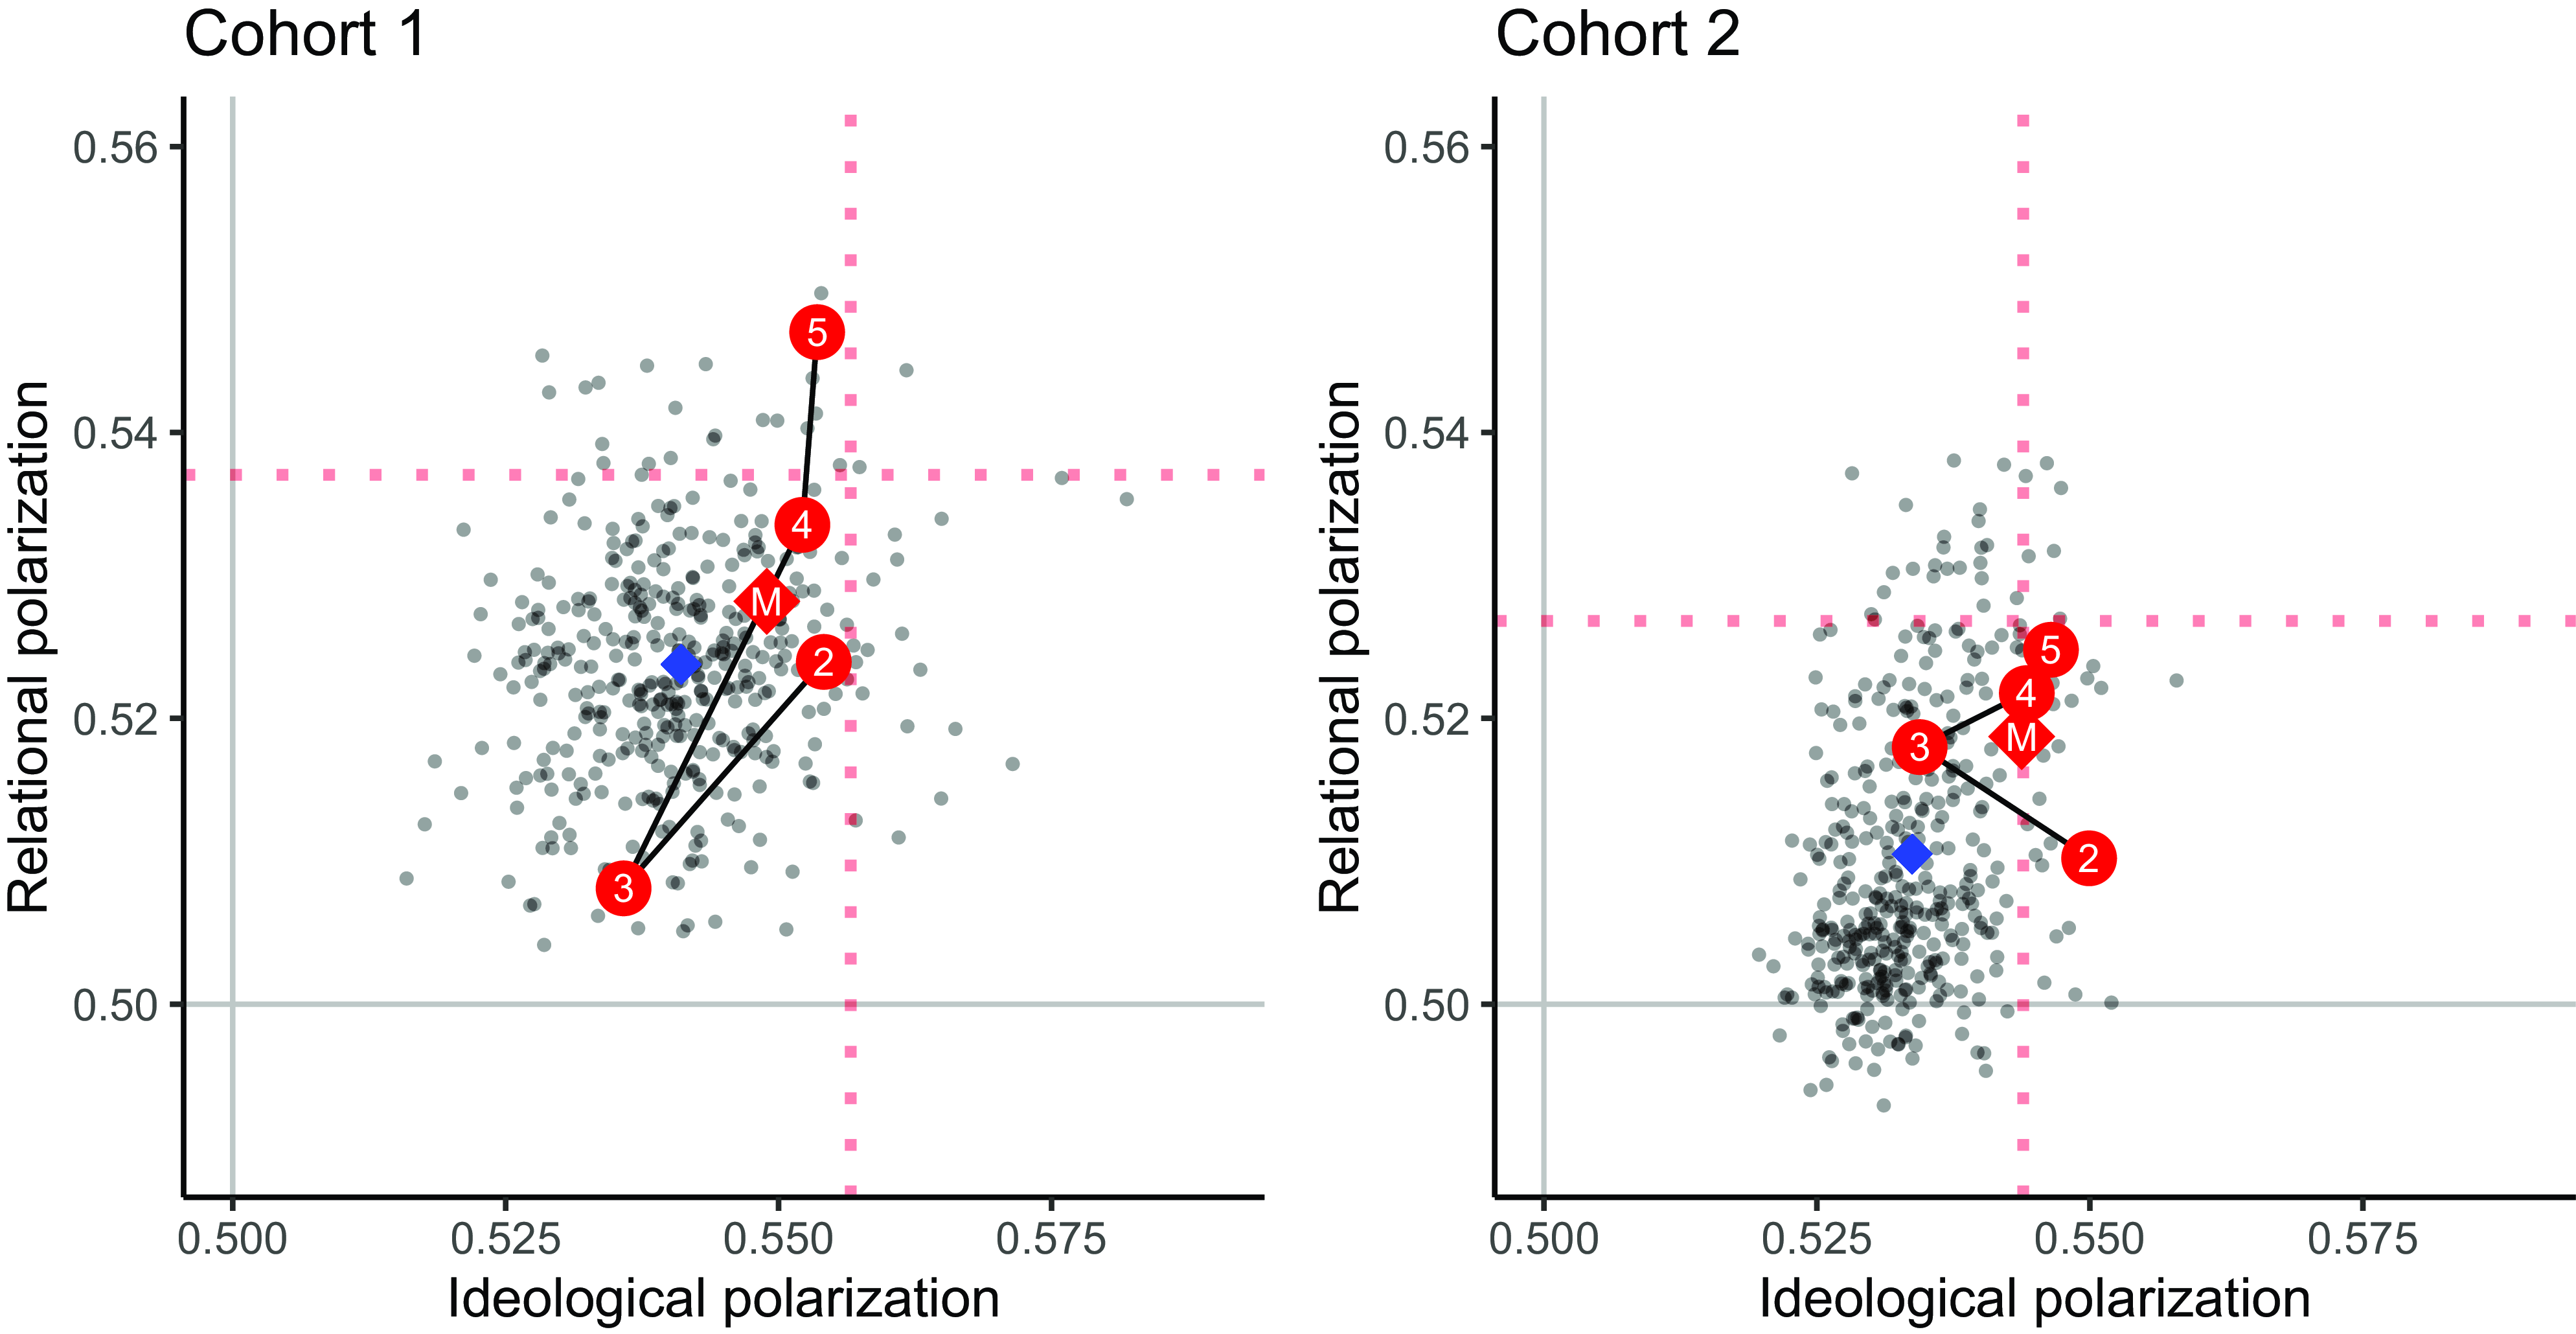
Figure 7. Polarization in observation and from micro-model simulation. The former is represented by larger connected red circles, while the latter is represented by separate light gray dots. The mean of the simulated values is represented by the blue diamond centered in the point cloud. The larger red diamond (M) presents the mean of the observed statistics. Micro simulations included are a random sample of 100 simulations for each period, for a total of 400 points, horizontal and vertical dotted lines indicate one-tailed p-values from this distribution.
7. Discussion
In this paper, we introduced a dynamic multilevel network framework for the study of political polarization in society. We defined the novel concept of network polarization, encompassing current perspectives on political division as an ideological and relational phenomenon (e.g. Hetherington 2009; Iyengar et al., Reference Iyengar, Sood and Lelkes2012). We proposed a set of measures to quantify the extent of network polarization in a multilevel network of political attitudes and social ties at a given moment in time. The measures consider two sub dimensions: ideological polarization is based on the alignment of actors' attitudes (Converse, Reference Converse2006), and relational polarization is based on the co-occurrence of aligned attitudes and social ties (Conover et al., Reference Conover, Ratkiewicz, Francisco, Gonçalves, Menczer and Flammini2011). We explored the new concept and measures in a novel longitudinal dataset of two cohorts of Swiss undergraduate students. In these communities, friendship relations and political attitudes were assessed five times within one year, enabling us to take a dynamic multilevel perspective.
We studied network polarization in the student communities in three empirical analyses. First, we assessed the degree to which the two communities were polarized and found weak but significant levels of ideological and relational polarization on the macro level. Second, we estimated dynamic network models to investigate if micro-level processes of social selection, social influence, and latent-cause reinforcement shaped the evolution of the two networks. We found robust evidence for friend selection based on attitude similarity and latent-cause reinforcement, alongside weaker evidence for social influence. Finally, we assessed whether these micro-level processes could reproduce the observed degrees of macro-level network polarization. We concluded that the models could largely explain the moderate levels of network polarization found in this context. Overall, the models tended to slightly underestimate polarization, which may be due to unobserved heterogeneity in individuals' opinion formation, such as from personality traits, and suggests that the models could be fine-tuned with additional data.
Our polarization measures are rooted in past research into social division and encompass key dimensions of polarization (Jost et al., Reference Jost, Baldassarri and Druckman2022). While they describe the extent of polarization on the network level, they are defined based on micro-level structural configurations observed in the network. This creates a natural connection between the measures and the interpersonal processes that can explain the extent of polarization in a community, enabling the analysis of micro-macro links (Snijders and Steglich, Reference Snijders and Steglich2015; Duxbury, Reference Duxbury2024). Our dynamic network model explores this connection while taking into account the endogeneity of network ties (Snijders et al., Reference Snijders, Lomi and Torló2013): that social ties can shape attitudes and vice versa. What our approach cannot account for are emergent phenomena beyond what is expressed in the polarization metrics. For example, strong polarization may change the political climate, making people more entrenched and thereby altering the micro-level processes that explain polarization (cf. Bishop and Cushing, Reference Bishop and Cushing2008). Such contextual effects could be examined in our approach by studying changes in micro-level processes over time periods or comparing a larger number of communities. These issues were beyond the scope of our paper.
The core micro-level network mechanisms discussed in this article are classes of multiple causal social mechanisms (Stadtfeld and Amati, Reference Stadtfeld and Amati2021). This is most apparent in our conceptualization of latent-cause reinforcement in the dynamic model. Contextual factors (e.g., media consumption), as well as latent inter- and intra-individual variables can all contribute to our estimated effect. Future empirical research could aim at dissecting those in more detail, using additional individual, relational and behavioral measures. As a feature of the model, the set of latent-cause parameters helps capture residual variance that may otherwise be attributed to selection and influence processes (Shalizi and Thomas, Reference Shalizi and Thomas2011), and contributes to the fit of the model in terms of macro-level polarization. Explicit incorporation of additional, theoretically derived variables would improve the specification of this aspect of the model.
One of our aims was to examine whether we could sufficiently explain network polarization with a parsimonious network model. In recent years, a number of methods have been proposed to estimate the impact of individual or group processes on macro-level outcomes in network models. The framework of Snijders and Steglich (Reference Snijders and Steglich2015) proposes simulations from SAOMs with manual adjustments made to parameters of interest to examine their effects on macro-level outcomes. The MEMS method (Duxbury, Reference Duxbury2024) follows a similar approach but simulates from a broader set of models, incorporating parameter variances. The relative importance method of Indlekofer and Brandes (Reference Indlekofer and Brandes2013) assesses the impact of SAOM parameters on actor choices occurring in simulations. Applying such methods to our current model, while beyond the scope of this paper, could provide further insight into the processes explaining the level of polarization in our data.
Further, two specific limitations of our study could be addressed in future research. Firstly, we only studied a positive social relation (friendship). Previous studies have highlighted that negative ties, such as dislike and conflict, co-evolve with positive ones in communities and impact a variety of outcomes (Harrigan et al., Reference Harrigan, Labianca and Agneessens2020), such as group boundaries (Stadtfeld et al., Reference Stadtfeld, Takács and Vörös2020). Group differentiation in itself could then contribute to political polarization (Bail et al., Reference Bail, Argyle, Brown, Bumpus, Chen, Hunzaker and Volfovsky2018). Nonetheless, direct evidence for linking negative ties to opinions in offline settings is thus far lacking (Takács et al., Reference Takács, Flache and Mäs2016). Our approach could be generalized to allow both positive and negative ties between individuals in a similar way as it incorporates positive and negative attitudes to topics. Such an extension can enable researchers to explore further processes that may explain polarization, such as the appearance of negative ties as a result of opposing views on political issues (cf. Reiljan 2020).
Secondly, we note that our approach does not explicitly incorporate emergent social identities, which are increasingly considered important to explaining political polarization (Iyengar et al., Reference Iyengar, Lelkes, Levendusky, Malhotra and Westwood2019; Dias and Lelkes, Reference Dias and Lelkes2022). As people interact and develop attitudes to issues, group identities emerge (Tajfel and Turner, Reference Tajfel, Turner, Austin and Worchel1979), and these identities may influence the attitudes and actions of individuals, beyond influence from specific peers—forming an important mediator between attitudes, and selection and influence processes. Although complex due to the evolution of identities in political interactions (O'Reilly et al., Reference O'Reilly, Maher, Smith, MacCarron and Quayle2024), future work could aim to account for emergent group identities in network models for a more complete understanding of political polarization.
Our work aims to contribute to the scientific study of polarization in societies and communities in real-life settings. The key theoretical strength of our network approach is that it allows the study of people's attitudes on multiple political issues and their social ties. The defined measures help to quantify and assess the level of polarization observed in a community, both in highly and in mildly polarized settings. Our unique empirical dataset presents a viable example for collecting longitudinal network data about social divisions. Such data are straightforward to analyze using the presented framework. Finally, our extension of stochastic actor-oriented models with relevant effect and goodness-of-fit statistics can be readily applied by researchers to the study of polarization.
Our approach highlights directions for future research into polarization. We elaborated our approach focusing on a specific set of political attitudes. The literature on political polarization suggests that social divides are likely to exist in and spread through other domains as well (DellaPosta et al., Reference DellaPosta, Shi and Macy2015). Our multilevel network framework allows the generalization from political topics to alternative social objects about which people may have positive and negative attitudes. This includes political issues not captured in our data, but also other objects of cultural consumption and lifestyle choices. These objects could also be fruitfully studied with a framework like the one presented here, helping to understand a number of divides and conflicts in modern societies.
The concept of network polarization could further be applied in different empirical contexts. Political interaction increasingly occurs on online social media platforms, providing solid rationale for examining possible differences of effects. Attitudes and interactions are often readily inferred in discussion communities, such as Reddit (e.g. An et al., Reference An, Kwak, Posegga and Jungherr2019; Himelboim et al., Reference Himelboim, McCreery and Smith2013). Similarly, measures of network polarization could be derived from large-scale survey studies in which information about individuals' attitudes, their interpersonal relationships, as well as the perception of attitude-agreement with their peers exist (e.g. Buck and McFall, Reference Buck and McFall2012).
Polarization is a process that, in the extreme, may disintegrate societies. We need to be able measure network polarization on the macro-level and understand the micro-level processes that create and sustain political polarization in order to be able to tackle it. Our work highlights the importance of measuring ideological and relational aspects of polarization, and enables the study of selection and influence processes in the context of polarization. If people tend to become more similar to those they talk to and dissimilar from others, ideological polarization is expected to increase. If, in turn, people tend to talk only to others with similar views, relational polarization is also expected to increase. We have a long way to go to fully understand the micro-level dynamics of polarization and its ideological and relational sub dimensions. We believe that the proposed network polarization concept in combination with a dynamic social network approach can be helpful in this endeavor.
Acknowledgements
The authors would like to thank the participants at Sunbelt and Duisterbelt for useful comments and suggestions, as well as Marion Hoffman, Alvaro Uzaheta, and Timon Elmer for continued discussions which improved the paper substantially. This research was conducted while the first author was a member of the Social Networks Lab.
Supplementary material
The supplementary material for this article can be found at https://doi.org/10.1017/nws.2025.2.
Funding statement
The collection of data used in this research was generously financed by the Swiss National Science Foundation, grants 10001A_169965 and 10DL17_183008, and the rectorate of ETH Zürich.
Competing interest
The authors declare none.
Data availability
The data used in this work can be requested via the data request form on the https://sn.ethz.ch/research/studentlife.htmlStudentLife webpage


 Open access