

A January 2021 American Enterprise Institute survey of U.S. adults found that more than one-third of Americans agree that “the traditional American way of life is disappearing so fast that we may have to use force to save it,” including 56% of Republicans, 22% of Democrats, and 35% of independents (Cox Reference Cox2021). More than an abstraction, hostility and support for political violence have measurable behavioral consequences—this was never clearer than on January 6, 2021, when hundreds of individuals forced their way into the U.S. Capitol Building, disrupting the certification of a presidential election. While few may be willing to participate in physical violence, that so many are willing to entertain or support the use of force in order to preserve the “American way of life” is disconcerting.
Although some is known about the macro-political conditions that foster political violence, as well as the social and demographic characteristics of violent extremists, less attention has been paid to extremist attitudes among the mass public. In a sense, this is for good reason—less polarized times required less attention to such a topic. Times have changed. Growing anger, at both out-groups and the government more generally, has resulted in record low levels of political trust (Webster Reference Webster2020) and a sharp increase in hostility toward out-groups (Iyengar and Krupenkin Reference Iyengar and Krupenkin2018). More Americans supported the use of tear gas on out-group protestors in 2017 than in 2014 (Westwood, Peterson, and Lelkes Reference Westwood, Peterson and Lelkes2019). A majority of Americans recognized the potential impact of heated political rhetoric on the prospect of political violence in 2019, before the pandemic, the impeachments of Donald Trump, or the Capitol riots (Drake and Kiley Reference Drake and Kiley2019). Lowering the temperature of polarization, combating uncivil attitudes, and preventing political violence all require a better understanding of the characteristics and motivations behind hostile, non-normative political attitudes and behavior.
In this paper, we examine the predictors of support for political violence in order to build a predictive profile of individuals who are likely to support violence (i.e., people who agree with statements such as, “Violence is sometimes an acceptable way for Americans to express their disagreement with the government”). The twenty-four correlates we employ span the psychological, political, and social domains. We find that feelings of victimhood, authoritarianism, populist sentiments, white identity, and military service are the strongest correlates of support for violence, though anxiety, feelings of powerlessness, conspiratorial thinking, perceived governmental corruption, racial resentment, and religiosity are also related. These results demonstrate that psychological orientations and attitudinal postures are more useful in explaining support for violence than sociodemographic-based constructs, such as socioeconomic depravation or status threat, as is sometimes assumed of those who participate in political violence. Instead, more subjective feelings that one is being unjustly victimized, as well as postures that might help resolve such injustices—like support for authoritarian and populist sentiments—are more predictive. In other words, one need not experience tangible oppression or subjugation to be supportive of extremist, violent action against perceived oppressors.
Finally, we use these results to build a profile of individuals who are most (least) likely to support political violence. To test the predictive validity of the profile, we use it to explain attitudes about the U.S. Capitol riot (e.g., “The riots at the U.S. Capitol building on January 6th were justified”). The political violence profile is effectively a summary of the foundational attitudinal and psychological antecedents of support for violence. Employing the profile allows us to avoid the circular logic of explaining support for a specific violent event with support for abstract violence; rather, we are accounting for the complex constellation of correlates that underlies support for violence. We find that the political violence profile exhibits a stronger relationship with support for the riot than any other explanatory variable, although positive feelings about Donald Trump are also an important factor. Moreover, we observe a statistically significant interaction between Trump support and the political violence profile: those who are highest on the political violence profile exhibit the strongest connection between Trump support and support for the Capitol riot. Thus, approval of real-world political violence appears to be the product of a toxic blend of partisan attachments and several non-political orientations that encourage violence.
Our results are important for several reasons. First and foremost, the specter of the January 6 attacks on the U.S. Capitol looms large. So, too, do threats like the kidnapping plot against Michigan Governor Gretchen Whitmer (Budryk Reference Budryk2020). Although few participated in the riots or kidnapping plot, relatively speaking, mass political violence may now be less abstract in the minds of ordinary Americans. Developing a robust understanding of who supports such actions—both abstractly and concretely—is useful for social scientists and law enforcement alike. Yet, our focus is not exclusively on the January 6 attacks, which were highly partisan in nature and inflamed by elected leaders. The Capitol riots were merely the starkest, most recent display of political violence that occurs in the United States, albeit on smaller stages. For instance, the 2016 election season was marked by many smaller acts of violence (Kite Reference Kite2016). Moreover, politically motivated violence is on the rise nationwide (O’Harrow, Tran, and Hawkins Reference O’Harrow, Tran and Hawkins2021). As the AEI survey referenced earlier notes, many Americans may now see violence as a legitimate form of political expression and participation, even if particular individuals would be unlikely to participate in violent acts. Thus, it is especially useful for scholars of mass political behavior to understand the constellation of factors that underwrites support for violence, particularly in a contemporary political environment characterized by extreme rhetoric and violence.
Known Correlates of Violence
Several literatures spanning academic disciplines and levels of analysis provide hints at the characteristics of individuals who are likely to support political violence, even if little work has directly examined this question. At the macro-political level, there is a correlation between economic inequality and actual political violence across political and cultural contexts (Sigelman and Simpson Reference Sigelman and Simpson1977). This relationship also manifests at the individual level: socioeconomic depravation—operationalized as low levels of education and income—is related to support for violence (Canetti et al. Reference Canetti, Hobfoll, Pedahzur and Zaidise2010).
Political violence research is overwhelmingly concerned with the impact of religion, especially as many of the instances of terrorism observed across the globe are at least partially motivated by religious principles and movements. At the individual level, however, there is contention about the precise role of religion in either participation in, or support for, political violence. Fair, Malhotra, and Shapiro (Reference Fair, Malhotra and Shapiro2012), for example, find that only Pakistanis who believe jihad can and must be waged by individuals are supportive of political violence—religious practice and support for political Islam are not, on their own, sufficient for motivating support for violent groups. Similarly, Canetti et al. (Reference Canetti, Hobfoll, Pedahzur and Zaidise2010) find that the effect of religiosity on support for political violence is mediated by socio-economic depravation. Thus, while there does appear to be some connection between religiosity and support for violence, other conditions must also be met for the relationship to take place.
Social psychological work on the nature and consequences of aggression and anger also provides insight into likely correlates of attitudes about violence. Individuals who exhibit elevated predispositions toward aggression tend to also exhibit frustration with their lives, congruent with other theories about the impact of socioeconomic depravation on support for violence (Anderson and Bushman Reference Anderson and Bushman2002). Men are also more aggressive, on average, than women (Anderson and Bushman Reference Anderson and Bushman2002). More than a “bottom up” psychological process, aggression can be activated and inflamed by violent political rhetoric, thereby increasing support for political violence (Kalmoe Reference Kalmoe2014). Strong partisans—who, by virtue of interest in and attention to politics, are most likely to be exposed to violent political rhetoric—hold the most uncivil attitudes about political out-groups (Miller and Conover Reference Miller and Conover2015). Those exhibiting the most hostile attitudes and elevated levels of anger about politics are both more likely than others to participate in politics and less committed to democratic norms and values (Webster Reference Webster2020)—a toxic blend presumably capable of fueling support for political violence.
In addition to political, socioeconomic, and purely psychological factors, a host of social-psychological orientations regarding power, authority, and trust are related to support for, or engagement in, political violence. Aggression, which underlies violence, is part and parcel of the authoritarian personality (Altemeyer Reference Altemeyer1981), a willingness to submit to authority at the expense of societal freedom (Adorno et al. Reference Adorno, Frenkel-Brunswik, Levinson and Sanford1950). Faragó, Kende, and Krekó (Reference Faragó, Kende and Krekó2019) demonstrate that authoritarianism more strongly predicts justification for violence against both symbolically threatening and physically dangerous groups than the propensity for radical action. That is, strong support for order and authority weighs more heavily on support for violence than one’s willingness to, for instance, “participate in a violent act to defend your opinion or values.” Thus, there is specific precedent for authoritarian sentiments to relate to support for violence.
In this same vein, populist sentiments, which are similar in many regards to authoritarian ones (Norris Reference Norris2005), have been connected to political violence. Populism, an “us-versus-them worldview” where “us” is the masses and “them” are the elites (Berman Reference Berman2021), is partially driven by social and economic grievances and the perceived inattention of political elites to the plight of the masses (Piketty Reference Piketty2017). These grievances are then subject to manipulation, resulting in the direction of anger and violence at a specified target (Berlet Reference Berlet1995). Additionally, support for populist sentiments is related to behavioral violence; for example, those who support the recent “America first” variant of populism are likelier to have been arrested on criminal charges throughout their lives (Levi, Sendroiu, and Hagan Reference Levi, Sendroiu and Hagan2020). Indeed, Snyder (Reference Snyder2018) notes that, historically speaking, “violence is hugely important” in the current era of populism.
Finally, conspiratorial thinking has been linked to support for violence in several ways. Uscinski and Parent (Reference Uscinski and Parent2014) find that conspiratorial thinking—the general predisposition to interpret salient events and circumstances as the product of conspiracies—is positively related to the abstract support for violence. Similarly, Imhoff, Dieterle, and Lamberty (Reference Imhoff, Dieterle and Lamberty2021) demonstrate that individuals prone to conspiratorial thinking are less likely to participate in normative political activities, like voting or contacting representatives, and are more likely to engage in non-normative activities, such as committing a violent attack on a person in power. These connections bear out even in less abstract scenarios: those who believe that 5G wireless technology was spreading COVID-19 were more likely to support violent measures to stop the spread, such as arson attacks on 5G cellular towers (Jolley and Paterson Reference Jolley and Paterson2020). Finally, beliefs in a number of specific conspiracy theories are correlated with support for political violence (e.g., Enders et al. Reference Enders, Uscinski, Klofstad, Wuchty, Seelig, Funchion, Murthi, Premaratne and Stoler2022; Uscinski et al. Reference Uscinski, Enders, Seelig, Klofstad, Funchion, Everett, Wuchty, Premaratne and Murthi2021), and others have observed a connection between positive feelings regarding the QAnon movement and support for the Capitol riot, in particular (Armaly, Buckley, and Enders Reference Armaly, Buckley and Endersforthcoming).
While disparate literatures across several disciplines have hinted at the psychological and social factors that underlie support for the use of violence, these idiosyncratic research programs typically fail to control for the full complement of psychological and social factors. By and large, the overarching goal of extant literature has been to identify individual or small groups of predictors of attitudes about violence, rather than learning who is most likely to support violence. Even though violence is fairly well studied, it is unclear which of the identified correlates matters most when it comes to supporting violence. This problem is exacerbated by the fact that many of the identified predictors are likely to overlap with one another. Populism, conspiratorial thinking, and authoritarianism, for example, tend to be highly correlated. Likewise, socioeconomic depravation is, definitionally, a confluence of personal circumstances regarding income, education, and employment. Finally, people who exhibit higher levels of conspiratorial thinking and populism tend to exhibit the kind of feelings—like helplessness and powerlessness (e.g., Jolley and Douglas Reference Jolley and Douglas2014)—that socioeconomic instability promotes.
What’s Missing?
Our central goal in this manuscript is twofold. First, we endeavor to build off previous work by expanding the list of potential explanations for support for political violence. Recent violence in the United States—most notably, the January 6, 2021, U.S. Capitol riots—has taken place in a climate of impassioned distrust and perceived corruption among a group of mostly white men who believed they were the victims of electoral fraud and democratic subversion. Thus, we see the potential for many additional predictors of support for violence. Second, we aim to determine which of these factors—many of which overlap and may interact with one another—appear to be most important to explaining support for violence.
The last few years have witnessed a sharp influx in the role of populist, authoritarian, and conspiratorial rhetoric in political communication (e.g., Hameleers and Vliegenthart Reference Hameleers and Vliegenthart2020). The predispositions at the center of these rhetorical strategies are driven by impassioned displeasure with the established political order and other out-groups—sentiments that we suspect may also lead one to be accepting of political violence, if not only for the vast array of violent anti-governmental groups in America (SPLC 2021a). As such, we investigate the relationships between support for violence and populism, conspiratorial thinking, authoritarianism, perceived governmental corruption, and trust in government. While, as noted earlier, we are far from the first to consider the role populism, authoritarianism, and conspiratorial thinking play in aggression and violence, we argue it is important to relate the factors, directly, to attitudinal support for violence at the individual-level.
Next, we operationalize frustration in several ways that are not explicitly anchored to politics or government. Perceptions of victimhood, for example, are born of a blend of entitlement and a feeling that one is not receiving what they deserve (Armaly and Enders Reference Armaly and Enders2021). We utilize two forms of perceived victimhood: egocentric and systemic. The egocentric variant captures general feelings that one is always settling for less. The systemic variant of perceived victimhood captures sentiments regarding “the system,” specifically, working against the individual. Armaly and Enders (Reference Armaly and Enders2021) demonstrate that each form of victimhood is related to support for policies and politicians that can remedy the perceived victimhood or the cause thereof. In a similar fashion, we expect perceived victimhood to positively relate to support for violence—violence may be seen as a way to remedy one’s victim status, to wrestle control of one’s life back from the oppressive powers that be. Additionally, we account for anxiety and feelings of powerlessness, which can serve as purely psychological markers for a host of frustrations with the political system or particular groups (e.g., Douglas et al. Reference Douglas, Uscinski, Sutton, Cichocka, Nefes, Ang and Deravi2019).
We also expect that racial identity and prejudice—central cleavages in American politics—plays a role (Jardina Reference Jardina2019). We account for each separately. White identity refers to the degree to which one feels attached to their whiteness and solidarity with other whites. Jardina (Reference Jardina2019) argues that white identity arises, in part, because of status threat as a reaction to growing diversity. Violence may be seen as a way to mitigate potential status loss, or to preserve the existing racial hierarchy from which they perceive themselves to benefit. Therefore, we expect those high in white identity to support political violence. Likewise, racial resentment—our operationalization of racial prejudice—represents both perceived violations of American values of hard work, as well as negative affect toward blacks (Kinder and Sanders Reference Kinder and Sanders1996). We expect those high in racial resentment to be more supportive of political violence. First, prejudice is clearly linked to conflict and violence (Green and Seher Reference Green and Seher2003; Green, Strolovitch and Wong Reference Green, Strolovitch and Wong1998), so there is sound reason to suspect it relates to support for violence. Second, much like our expectations regarding white identity, violence may be considered a viable way to stave off the advancement of minorities and preserve status for those perceived to uphold individualism and hard work.
Finally, we consider whether one has access to health insurance, as well as the potential impact of military service. We employ access to health insurance as an operationalization of socioeconomic depravation—which should be positively related to support for violence, based on previous literature (e.g., Anderson and Bushman Reference Anderson and Bushman2002)—that does not rely on self-reported income, an error-prone measure for which there also tend to be relatively high levels of missing data (e.g., Moore, Stinson, and Welniak Reference Moore, Stinson and Welniak2000). We examine military service because both veterans and active military personnel are more likely to engage in partner violence (Kwan et al. Reference Kwan, Sparrow, Facer-Irwin, Thandi, Fear and MacManus2020) and anti-governmental groups, such as the Oath Keepers and Three Percenters, tend to be composed disproportionately of individuals with military service records, primarily veterans (SPLC 2021b).
In addition to these newly identified correlates, we reexamine many of the correlates that others have identified (e.g., religiosity, income, and education). If our goal is to decipher which (combinations of) correlates best explain support for political violence, our model must incorporate as many of such correlates as possible.
Data and Measures
We fielded a survey containing the questions necessary to construct twenty-four possible correlates of political violence on 1,100 U.S. adults in February 2021. Our sample was fielded by Lucid, which is a survey marketplace that recruits respondents from dozens of sample suppliers. While the sample is a not a probability sample, the demographic characteristics of respondents match those of the broader population according to U.S. Census data 1 and the platform has been found to perform very well in generating accurate estimates of various political attitudes (Coppock and McClellan Reference Coppock and McClellan2019). In light of recent evidence regarding inattention on survey platforms like Lucid—in particular during the COVID-19 pandemic (Aronow et al. Reference Aronow, Kalla, Orr and Ternovskin.d.; Peyton, Huber and Coppock Reference Peyton, Huber and Coppock2020)—we took several steps to ensure data quality beyond Lucid’s use of reCAPTCHA to screen for bots and a combination of open-ended questions and machine learning methods to screen out inattentive respondents. First, respondents had to pass two additional attention checks in order to complete the survey. Second, we restricted our sample to only those respondents that spent an appropriate amount of time—at least 7 minutes, on a survey estimated to take 15 minutes—answering our questions. The sample size after this restriction is 1,002.
Our dependent variable, which was originally developed by Uscinski and Parent (Reference Uscinski and Parent2014), is a summated scale of responses to the following three questions about support for political violence, each of which respondents reacted to using a five-point set of responses ranging from “strongly disagree” (1) to “strongly agree” (5):
-
1. It is acceptable to use violence in advancing political goals these days.
-
2. Violence is sometimes an acceptable way for Americans to express their disagreement with the government.
-
3. Violence is justified if the members of the other side act violently first.
Importantly, Uscinski and Parent (Reference Uscinski and Parent2014) suggest that these items tap general support for and the perceived acceptability of violence as a way of achieving one’s political goals, rather than a willingness to engage in violence against any one group (e.g., party), the government in particular, or for any specific cause. In addition, these items avoid some of the problems identified by Westwood et al. (Reference Westwood, Grimmer, Tyler and Nall2021) that inflate support for political violence (e.g., unbalanced options with no midpoint), particularly as caused by inattentive respondents (Peyton, Huber and Coppock Reference Peyton, Huber and Coppock2020). 2 The scale (M=1.91, SD=1.10) is statistically reliable (α=0.86). As figure 1—which depicts the distribution of the violence scale—shows, most individuals are not supportive of the use of violence in politics. The modal scale value is 1, which corresponds with strong disagreement with each of the above three questions; this characterizes 43% of respondents. Still, 13% of respondents agree more than they disagree with the use of political violence and 10% are completely neutral, figures that comport nicely with those reported in other work on the appropriate measurement of support for violence (see Westwood et al. Reference Westwood, Grimmer, Tyler and Nall2021). For example, the mean of our measure (rescaled to range from 0–1 for comparability) is only between 0.08 and 0.03 points higher than what Kalmoe (Reference Kalmoe2014) reports across his three measures, which include more specific imagery about using bullets and bricks to solve political problems. Moreover, the mean of our measure is statistically indistinguishable at conventional levels (p = 0.07) from that of a measure of general willingness to engage in violence reported by Jolley and Paterson (Reference Jolley and Paterson2020). 3 Thus, it does not appear that our measure of support for political violence is merely capturing attitudes regarding the Capitol riot that occurred in the month prior to data collection. Given the potential consequences of attitudes about violence, we still see reason to be concerned with the people’s attitudes, even if most Americans do not support the use of political violence.
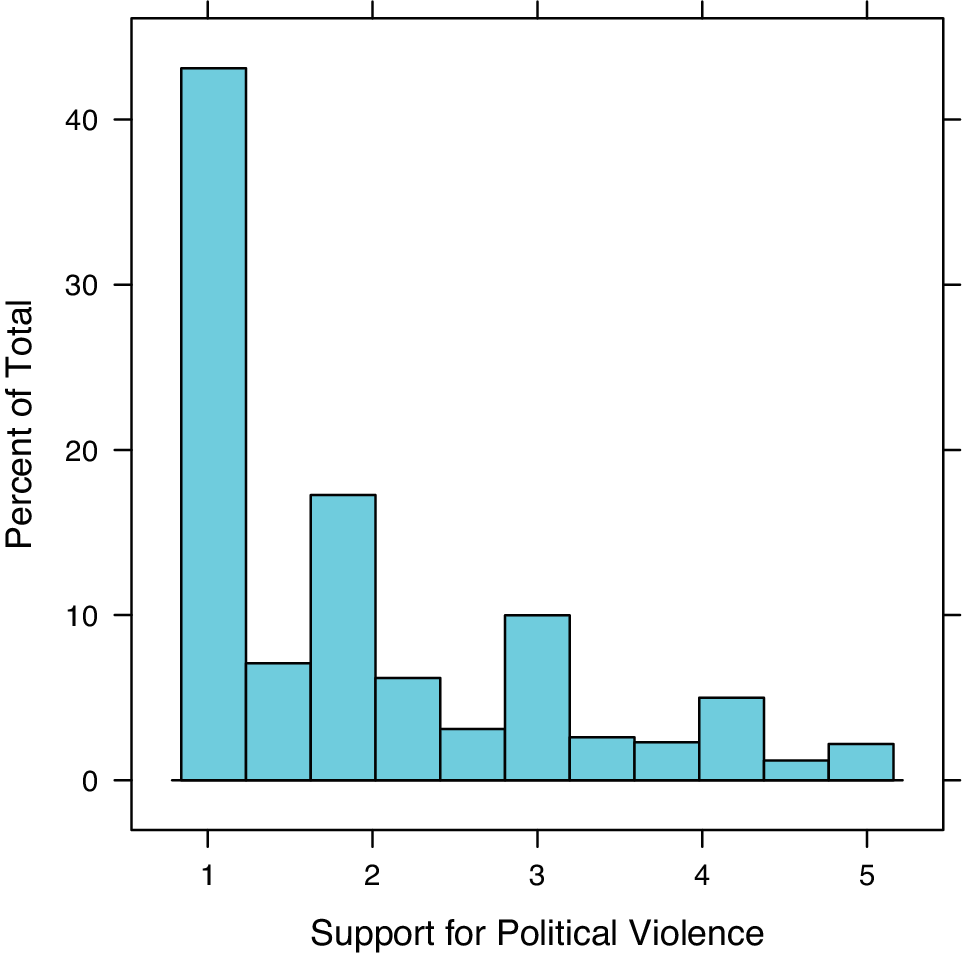
Figure 1 Distribution of support for political violence
Summary statistics for each correlate under consideration appear in table 1; refer to the online appendix for precise question wording. We organized these correlates by category, from general psychological traits and orientations to sociodemographic characteristics and individual circumstances. Each of the multiple-item scales we employ—all of which have been previously validated by others (refer to the online appendix)—are statistically reliable.
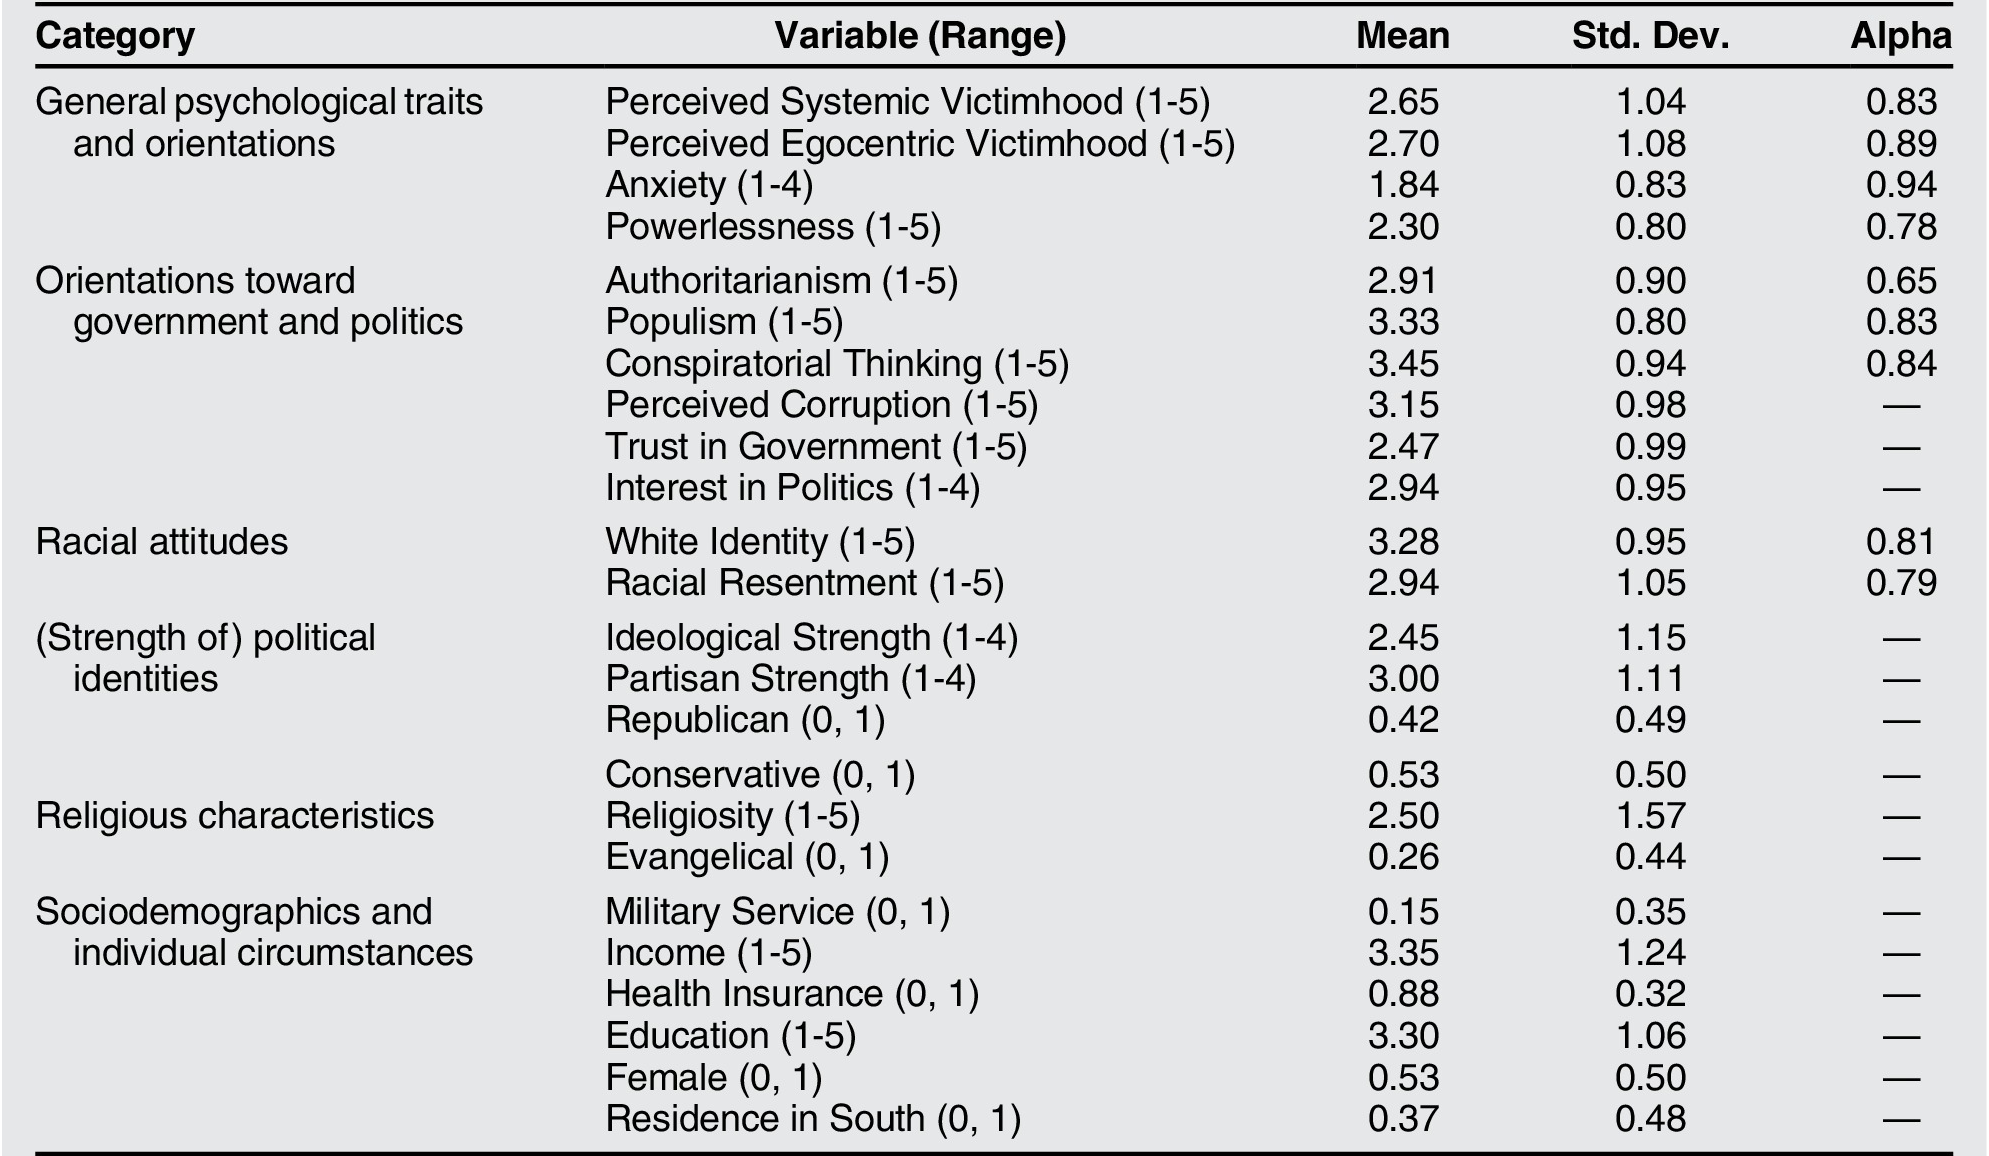
Table 1 Descriptive statistics for all potential correlates of support for political violence
Our analytical strategy unfolds in three steps. First, we examine bivariate correlations between support for violence and each of the potential correlates in table 1. Second, we use a classification and regression tree (CART) model to decipher which variables help us best predict support for violence. The goal of CART models is to correctly classify values of a specified outcome variable (support for violence), allowing for complex nonlinear and interactive relationships between the predictor variables. To understand how CART models work, one might imagine a simple decision tree. We present a hypothetical example in figure 2. Suppose we were attempting to model whether or not one survived the sinking of the Titanic, a classical example used to explain how CART models work.
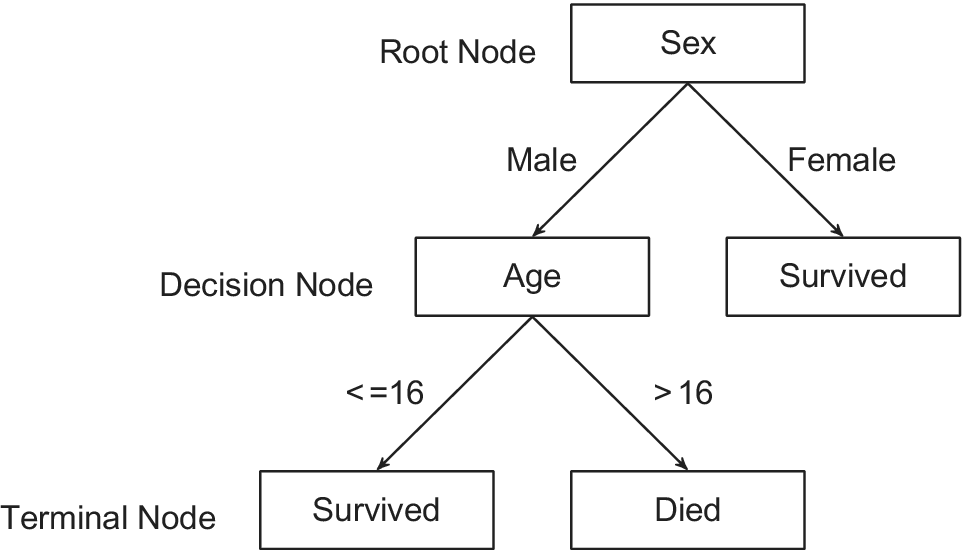
Figure 2 Hypothetical example of a CART model
Because of the “women and children first” evacuation policy on the Titanic, we know that sex and age are two of the most important variables in classifying whether or not one survived. Indeed, sex—represented by the “root node” at the very top of the tree—is the most predictive factor. If one was female, they were very likely to survive, which is represented by the rightmost path leading from the sex node to the survived terminal node. Terminal nodes represent the final prediction for a branch of decisions. If one was male, we must further wonder if they were a child or not. Males less than or equal to 16 years of age were likely to survive, as depicted by the series of leftmost paths from sex to the age decision node, and the age decision node to the survived terminal node. Males greater than 16 years of age were likely to perish, as depicted by the path from sex to the age decision node, and the age decision node to the died terminal node. In the immediate study, we seek to predict one’s level of support for violence, which will be depicted in terminal nodes, using the twenty-four correlates discussed earlier, which will be depicted in the root node (simply the single most predictive factor, like sex in the Titanic example) and a series of decision nodes (like age).
The CART modeling procedure—implemented in party R package (Hothorn, Hornik, and Zeileis Reference Hothorn, Hornik and Zeileis2006)—first identifies a single independent variable that best organizes the data into two groups; “best” is defined as the split in the variable that explains the greatest variance in the outcome variable. Once the data are separated, this process is recursively applied to each subgroup until no improvements can be made (i.e., until no more variance is explained). The procedure sequentially selects the variables that best improve the fit of the model to the dataset. Thus, it does not require linear relationships between the outcome and predictor variables. Partitioning the data at a particular level of a predictor variable—for example, a 3 (the midpoint) on the anxiety scale—allows for the consideration of the impact of variables at differing levels of other covariates. 4
Finally, we examine the predictive power of the profile of orientations that the CART model identifies as uniquely useful in classifying attitudes about violence. In particular, we attempt to explain support for the U.S. Capitol riots—“The riots at the U.S. Capitol building on January 6th were justified”—using a combination of political identities, positive feelings toward Donald Trump, and the political violence profile. Our expectation is that the political violence profile is a strong predictor of these attitudes, even controlling for other relevant factors. Moreover, the profile should be more strongly related than any individual correlate of support for political violence if our strategy has yielded a valid and predictive picture of who supports political violence.
To be clear, this is not merely a more complicated way of controlling for support for violence. Instead, the political violence profile is a summary measure of the psychological, orientational, and attitudinal antecedents of political violence. We argue that this approach is useful for a number of reasons. First, it avoids the tautology of predicting support for the Capitol riot with support for violence, generally. Instead, we can state, for instance, “individuals with the following collection of orientations are the most likely to state the riot was justified.” Second, this approach offers analytical strength in that there is no assumption of functional form between the twenty-four correlates detailed later and support for the Capitol riot. 5 It is possible that high levels of, say, powerlessness contribute to both high violence support and low violence support. Accounting for either violence, itself, or powerlessness in a regression model explaining Capitol riot justification would mask such a nuanced relationship. We expect—and, per the results of our CART model, find support for the notion—that the interactive and nonlinear effects of several correlates of support for violence are important pieces of the puzzle we are attempting to solve (i.e., who supports political violence). Third, this approach constitutes a more parsimonious accounting of support for the Capitol riot than a “garbage can” model of all possible explanations. Rather than estimate nearly thirty parameters, we have empirical reason to condense a number of correlates into a simpler, albeit analytically powerful, profile. This allows for a cleaner, more straightforward understanding of who supports violence, generally, and the Capitol riot, specifically.
Results
Figure 3 displays pairwise correlations between support for violence and each potential correlate. The two forms of perceived victimhood, support for authoritarianism and populism, and white identity are the strongest correlates of support for violence. Those with (seemingly) more extreme general psychological traits and orientations (e.g., powerlessness and anxiety) exhibit the highest levels of support for violence. The same is true of those who have an antagonistic relationship with government—those who think it is corrupt, engage in conspiratorial thinking about nefarious actors, and support non-traditional leaders, like authoritarians or populists. But a number of other characteristics correlate with support for violence. For instance, evangelicals and those who frequently attend religious services are more supportive of violence. So, too, are current and former military personnel.
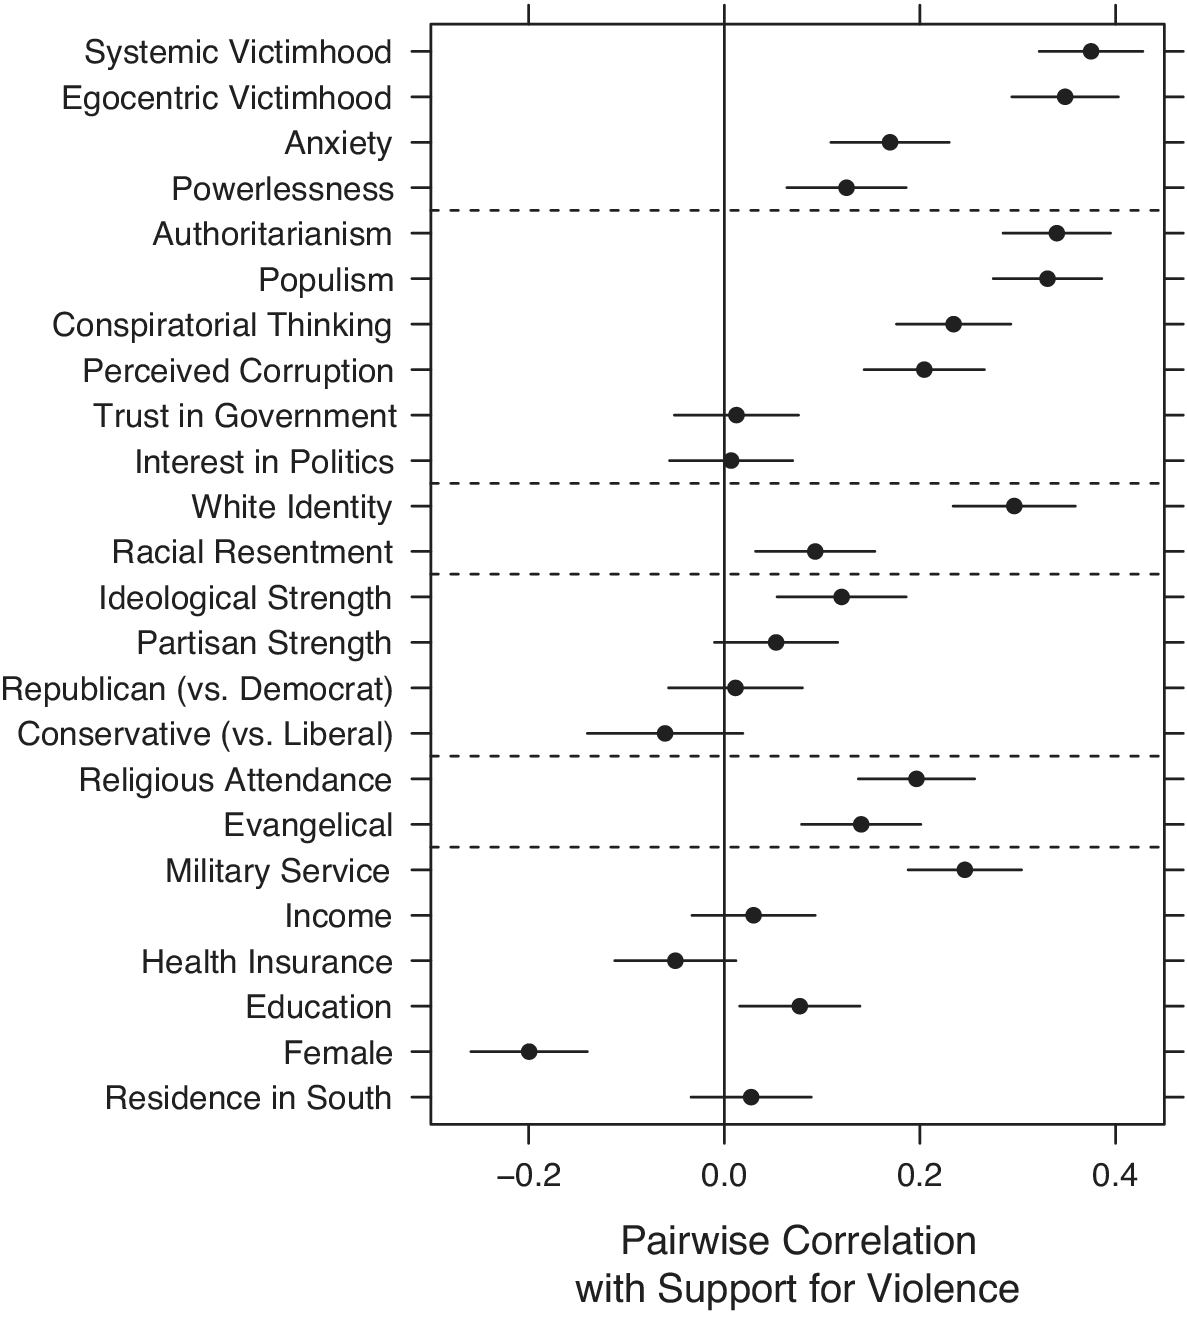
Figure 3 Pearson product-moment correlation with support for violence
Notes: With 95% confidence intervals; n=817–1,002.
Political predispositions, on the other hand, do not correlate with support for violence. Congruent with past literature, there is a correlation between strength of ideological identification (and partisan strength is marginally significant 6), but it pales in magnitude compared to most of the other correlations described earlier. Altogether, support for violence does not appear to stem from a single attitude or circumstance; instead, a constellation of factors underwrite it.
However, it is likely that many of these characteristics, attitudes, and orientations covary with one another. Indeed, we see a number of moderate and strong relationships in Figure 4, which displays pairwise correlations between all of our covariates. Consider, mostly notably, the bottom left portion of figure 4. The psychological and government specific orientations are, generally speaking, strongly correlated with one another. Inasmuch as our goal is to determine which of these covariates combine to best characterize individuals high in support for violence, correlational analyses may prove deficient.
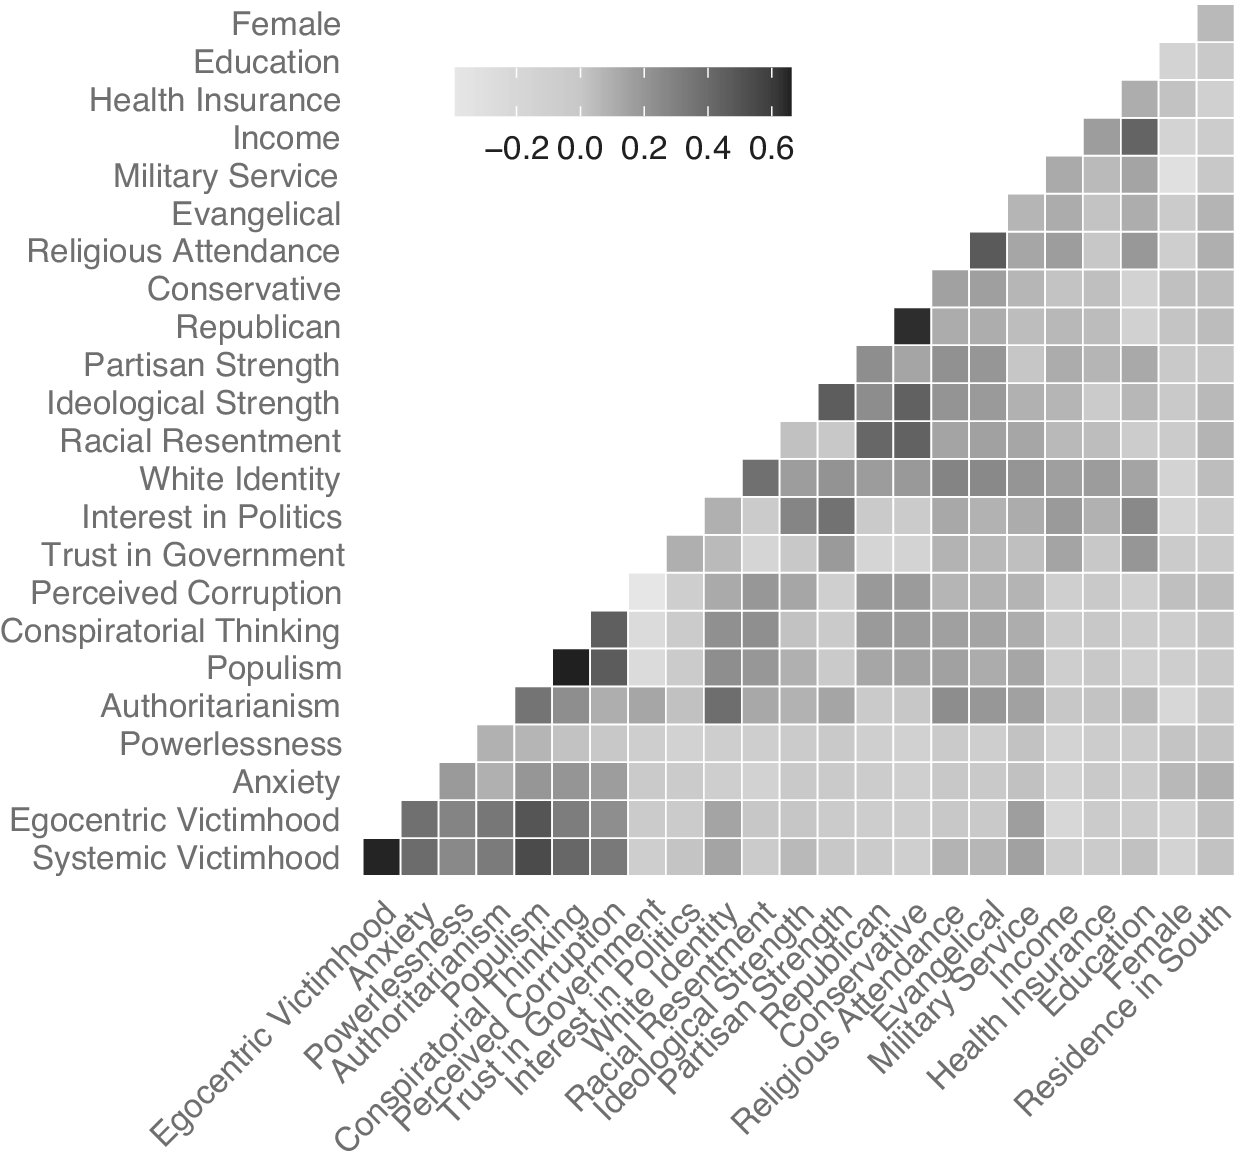
Figure 4 Pairwise correlation heatmap
We also observe considerable nonlinearity between support for violence and each of the independent variables. In the online appendix we present scatterplots for each relationship, overlaying both nonparametric smoothers and OLS fit lines. In approximately half of the cases, we observe OLS fit lines that are not comfortably encompassed by the confidence intervals of the nonparametric smoother, which is indicative of a statistically significant deviation from linearity. For instance, as figure 5 shows, the relationship between racial resentment and support for violence is, according to the nonparametric smoother, sinusoidal rather than linear. That is, those of middling levels of racial resentment are significantly more supportive of political violence than those either high or low in racial resentment. Such a relationship presents unique challenges in relating racial resentment to violence in the multivariate context when a (linear) functional form is assumed. The profile approach offered by CART models allows for us to properly incorporate this nonlinear relationship into our model of support for violence.
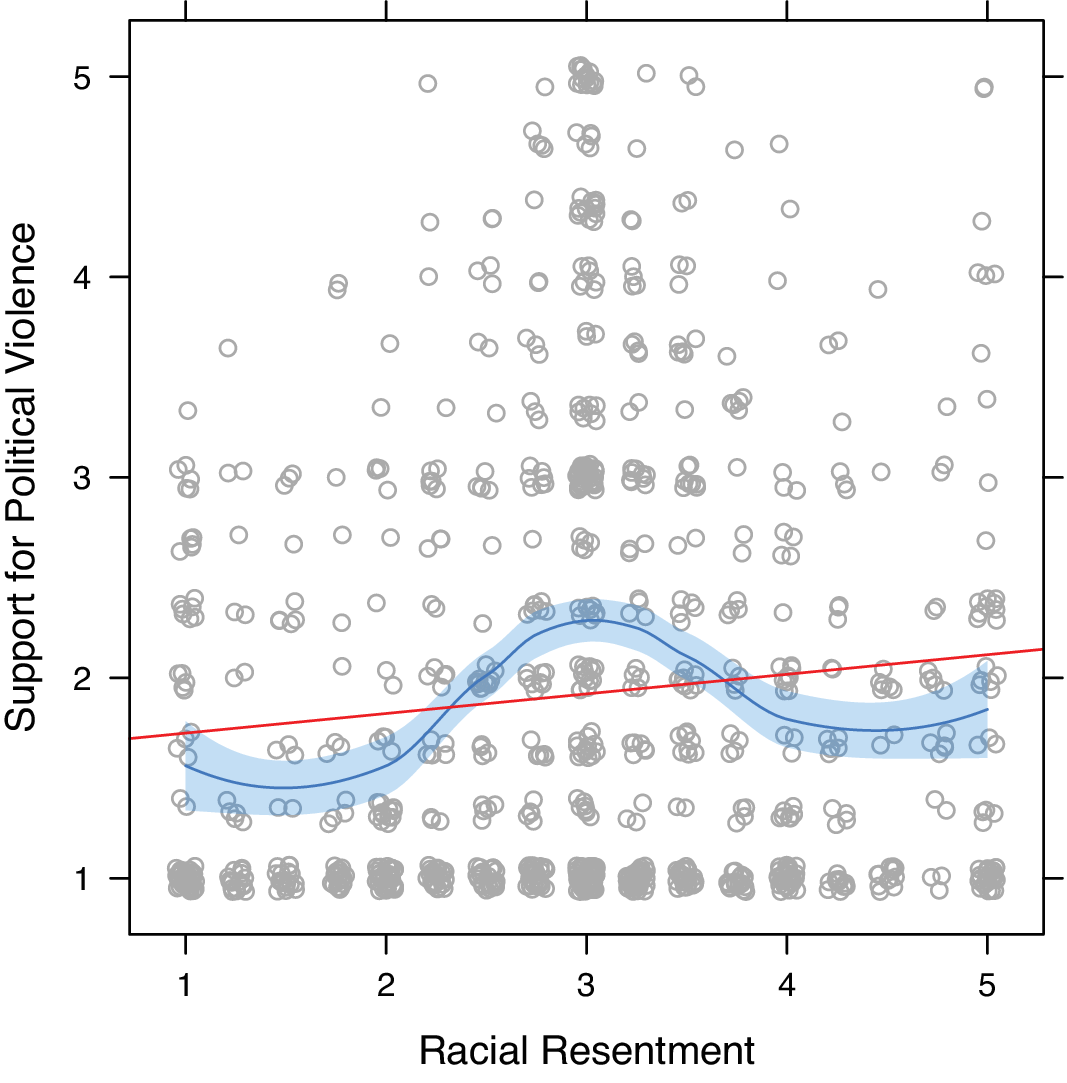
Figure 5 Support for political violence across racial resentment
Notes: Red line indicates OLS fit line; blue line nonparametric smoother
To aid in the identification of a profile that predicts support for violence, we turn to a CART model, the results of which are presented in figure 6. 7 Because these models are not common in political science, we carefully walk the reader through one set of nodes, and note that all remaining paths and nodes can be interpreted in a similar fashion. The distribution of support for political violence for various combinations of independent variables appears at the very bottom of the figure. Each boxplot across the horizontal axis details the level of support for violence for respondents classified into that node. We are interested in both the distribution of violence support in each terminal node, as well as how one came to be classified into any given node.
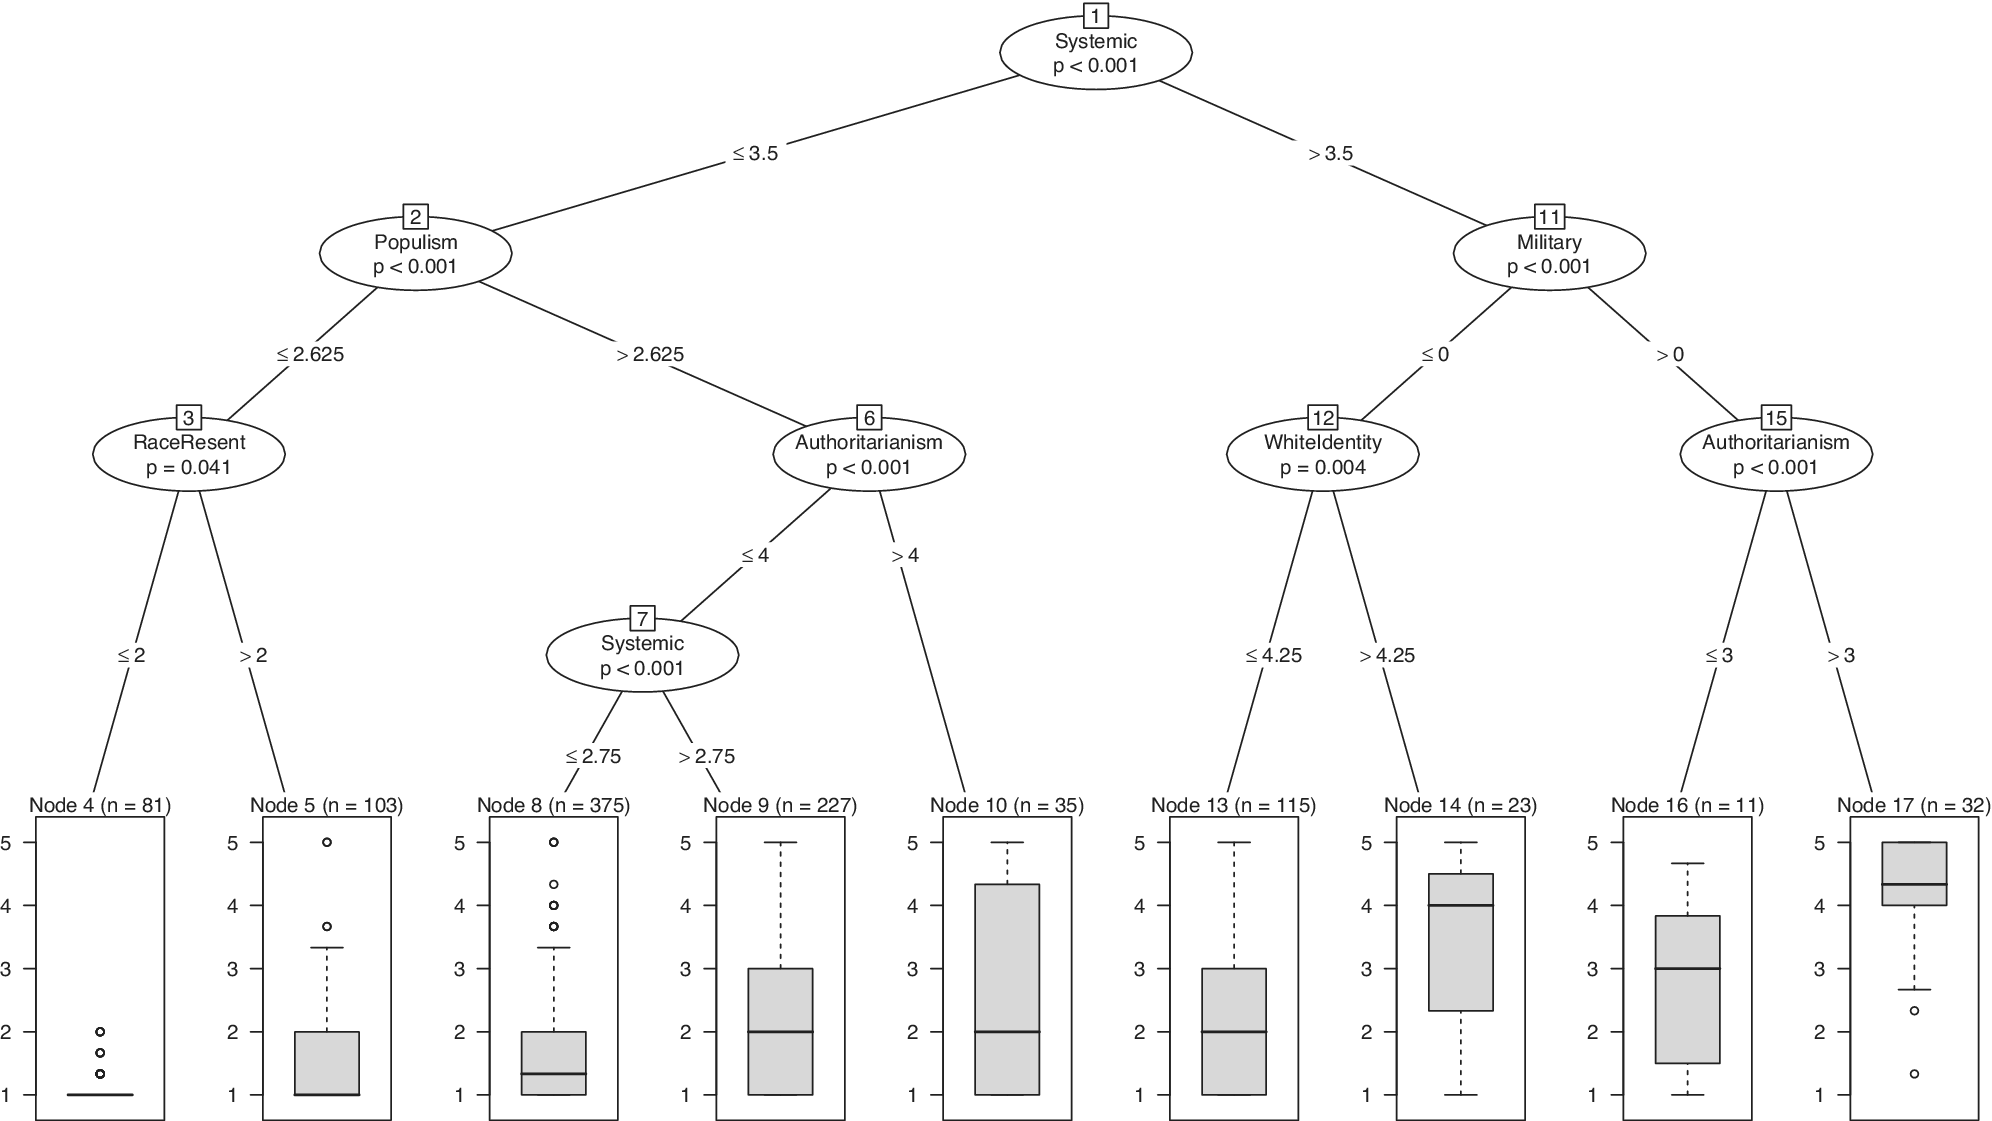
Figure 6 Results of CART model
Notes: Distribution of support for political violence, for various combinations of independent variables, in the final nodes along horizontal axis.
First, the CART procedure identified the predictor variable that is the most highly predictive of support for violence, which appears at the top of the tree: perceived systemic victimhood. Then, systemic victimhood was partitioned at the value that explains the greatest variance in support for violence; here, that value is 3.5 (which is slightly greater than the midpoint, 3). Importantly, we note that the method is not inherently dichotomizing the variables. 8 Following the left path, we are considering individuals with systemic victimhood scores of 3.5 or less. Then, the remaining data are once again split using the variable that explains the greatest remaining variance: populism (Node 2). Populism is partitioned at 2.625 (which is just lower than the midpoint, 3). Again following the left node, racial resentment explains the greatest remaining variance (Node 3), and is itself partitioned into those with scores greater than 2 (a low-medium score), or less than or equal to 2. Thus, for this collection of 184 individuals in our dataset, three variables—systemic victimhood, populism, and racial resentment—best classify their support for violence (which, per the boxplots at Nodes 4 and 5, is very low). These variables all interact with one another to best classify support for violence. Each of the factors after the first node is dependent upon systemic victimhood, and every other node along the path between the first node and the terminal node.
Six variables—systemic victimhood, populism, racial resentment, authoritarianism, current or former military enlistment, and white identity—prove useful in classifying levels of support for political violence. The interpretation proceeds just as outlined here for all remaining nodes. As for the profiles that classify those high in support for political violence, we turn to the right side of the figure. Here, systemic victimhood, military service, white identity, and authoritarianism are the constellation of characteristics and orientations most predictive. Consider one high in systemic victimhood (>3.5), who is now or was previously in the military (>0), and is relatively low in authoritarianism (≤3). Such an individual would be classified into Node 16—about one standard deviation above the mean for support for violence. Should we consider a similar individual who is relatively high in authoritarianism (>3), they would be classified into Node 17—the 99th percentile of support for violence. Nodes 13 and 14 involve non-military personnel high in perceived systemic victimhood. Here, white identity proves to be additionally useful in classifying support for violence among such individuals. Those high in white identity are much more supportive of violence than their less white-identified counterparts, despite having other similar characteristics. An ordinary linear model would hide this unique role of identity, which is couched within military status and perceptions of systemic victimhood.
Even though many other constructs and characteristics that we examined earlier correlate with support for violence, they simply do not exhibit as much unique predictive power as the six orientations pictured in figure 6. On the one hand, we might expect as much. Indeed, many of the twenty-four correlates we examined are conceptually and empirically related to each other. On the other, there are several useful inferences to glean from the correlates that do prove uniquely predictive. First, they are all social-psychological orientations, with the exception of military service. This is in contrast to tangential literatures on political extremism and terrorism which sometimes argue that socioeconomic depravation and social standing more generally—tangible social characteristics—promote (support for) political violence as a remedy for one’s troubles. Our results show that merely feeling like a victim (e.g., systemic victimhood, white identity), blended with psychological postures that seek to resolve feelings of victimhood (e.g., support for authoritarian, populist, and racist ideas), can promote support for political violence.
Second, our results show that even though racial resentment and white identity, populism and authoritarianism overlap considerably, these constructs each play a distinct role in fostering support for violence. When it comes to racial attitudes, both in-group identities (i.e., white identity) and out-group orientations (i.e., racial resentment) matter—support for violence may be born of both in-group preservation and out-group denigration. Likewise, even though authoritarianism and populism are empirically related (Norris and Inglehart Reference Norris and Inglehart2019), support for specific flavors of authority (i.e., authoritarianism) and a deep-seated mistrust of elites and the political establishment (populism) are also seemingly at logical odds in many ways. Our analysis shows that authoritarianism is mostly likely to lead to support for violence when one also subjectively feels like a victim—authoritarianism is, perhaps, used as a strong-arm remedy for victimhood, rather than blind support for any authority figure.
Explaining Attitudes about the Capitol Riots
Next, we examine how predictive the profile of characteristics identified by the CART model is when it comes to more specific non-normative attitudes. In particular, we seek to explain the extent to which Americans (dis)agree with the statement, “The riots at the U.S. Capitol building on January 6th were justified.” The distribution of responses appears in the lefthand panel of Figure 7 (where 5 corresponds to “strongly agree”). As with the more abstract sentiment about support for political violence explored earlier, fairly few individuals are supportive of the riot. Approximately 15% of Americans agree with the statement, 14% are neutral, and 71% disagree. These values accord with literature noting that support for violence is not particularly high (Westwood et al. Reference Westwood, Grimmer, Tyler and Nall2021). In this instance, however, we know that it only takes a few individuals supportive of political violence to cause injury, death, and destruction, and to disrupt a critical democratic process.
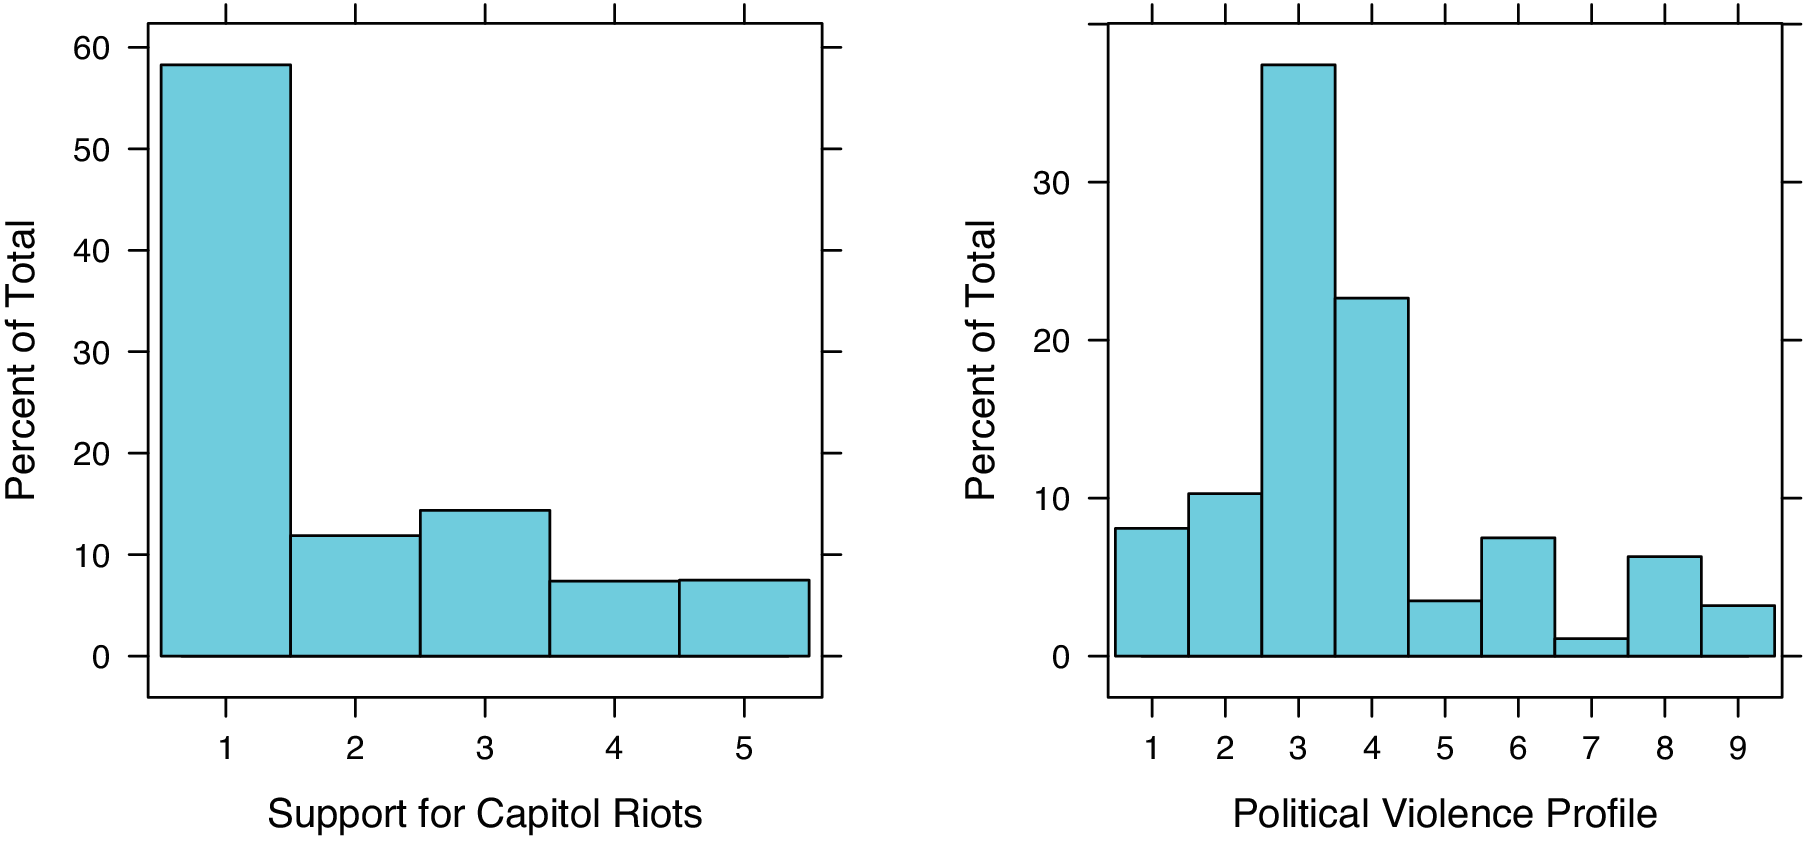
Figure 7 Distribution of support for U.S. Capitol riots (left) and the violence profile (right)
To construct the political violence profile (PVP), we simply followed the nodes in Figure 6. There are 9 terminal nodes along the bottom of the figure, so our profile variable will have 9 categories. Those categorized at 9, the highest score on the PVP, scored greater than 3.5 on perceived systemic victimhood, 1 on military service, and greater than 3 on authoritarianism. Likewise, those categorized at 1, the lowest score on the PVP, scored less than or equal to 3.5 on perceived systemic victimhood, less than or equal to 2.625 on populism, and less than or equal to 2 on racial resentment. 9 The distribution of the PVP appears in the righthand panel of figure 7. Most people are classified into the 3 or 4 categories, reflecting low-neutral levels of perceived systemic victimhood, high-neutral levels of populism, and low-neutral levels of authoritarianism. This profile is uncorrelated with either partisan (r = 0.001, p = 0.971) or ideological (r = −0.045, p = 0.192) identities, though it is weakly correlated with the strength of ideological identities (r = 0.082, p = 0.017).
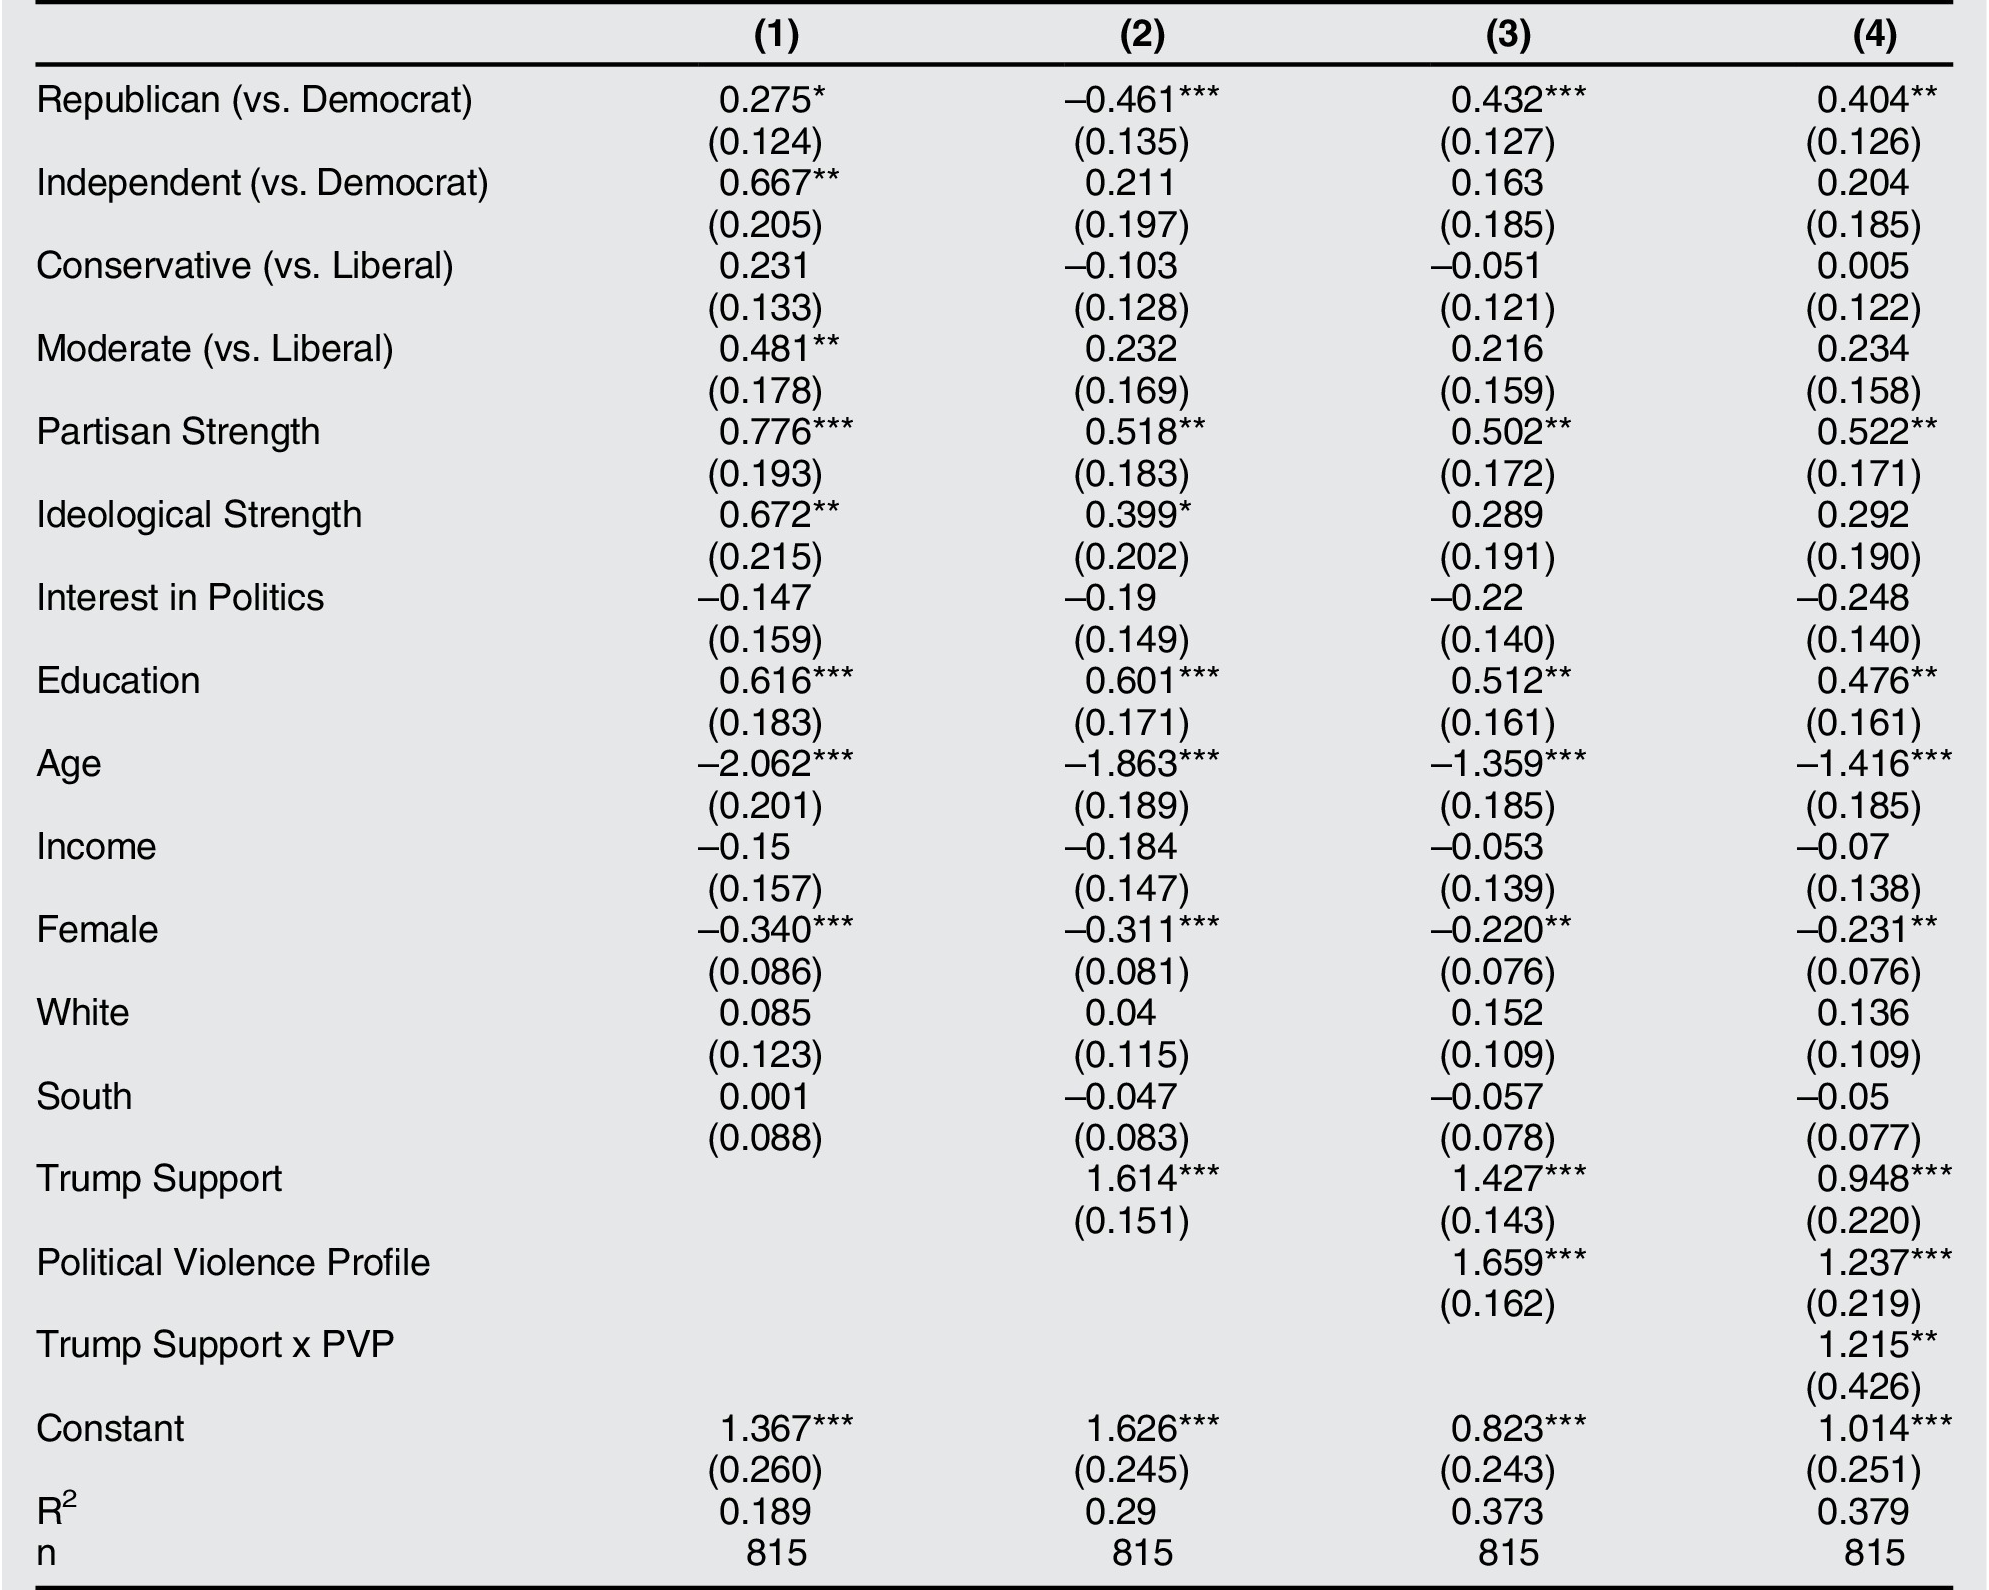
We take an iterative approach to explaining support for the Capitol riot. First, we estimate a baseline model, which includes partisan and ideological identities, as well as standard socio-demographic controls. Since rioters were present at the Capitol in order to attend Donald Trump’s “Save America” rally, we might expect that Republicans and conservatives are more likely to believe the riots were justified than Democrats and liberals. Next, we add to this model a measure of Trump support, operationalized using a 101point thermometer of feelings about Trump. We expect this to be more strongly related to attitudes about the riot than either partisanship or ideology. To build off this, we next introduce the political violence profile to the model. Support for the Capitol riots is not merely an expression of intense partisanship or attachment to a political candidate, but an endorsement of the use of violent tactics in adjudicating political disagreements (to put it charitably). Thus, we expect the PVP to be strongly related to attitudes about the riot. We still expect support for Trump to relate to support for the Capitol riots, but that the coefficient magnitude will be attenuated when including the PVP. Finally, we suspect that there is an interactive relationship between Trump support and the PVP—the connection between the PVP and attitudes about the riot should be strongest among people who exhibit the most positive feelings about Donald Trump. 10
Each of these four models appear in table 2. 11 All independent variables have been rescaled to range from 0 to 1 in order to facilitate comparison of coefficients. In the first model, we find that, as expected, conservatives are more likely to believe the riots were justified, though we do not observe a relationship with partisanship. We also find that women and older individuals are less likely than men and younger people to believe the riots were justified. Moving to the second model, we see that Trump support is strongly related to attitudes about the riot. In the third model, we observe a coefficient for the PVP that is on par with (indeed, slightly greater than) that of Trump support. Moreover, the final model reveals a positive interactive relationship between Trump support and the PVP, precisely as we hypothesized.
Table 2 OLS regressions of support for U.S. Capitol riots.
To better understand the additive effects of the PVP and Trump support, we present model-predicted attitudes about the Capitol riot over the range of both variables in figure 8. 12 These two variables exhibit remarkably similar relationships. Among those lowest on the PVP and most negative about Donald Trump, the predicted level of support for riot is about a 1.5—somewhere between “strongly disagree” and “disagree.” Among those highest on the PVP and most positive about Donald Trump, the predicted level of support for the riot is about a 3, or “neutral.” While this may not seem particularly impressive, there are some caveats to keep in mind. First, even neutrality about political violence being justified in the context of lies about the integrity of an election is disconcerting. Second, these variables exhibit quite strong relationships, regardless of predicted levels of support—simply put, not many Americans admit to believing the riots were justified. Finally, the combination of Trump support and the PVP is likely to explain attitudes about the riot even better than either factor on its own.

Figure 8 Predicted support for the U.S. Capitol riots by level of Trump support and violence profile, holding other variables at their mean
Notes: Band represents 95% confidence intervals.
Indeed, we do observe a significant interaction between Trump support and the PVP. The marginal effect of the PVP over the range of possible feelings about Trump appears in figure 9. Even among those with the most negative feelings about Trump we observe a significant relationship between the PVP and support for the riot, as we might expect given the results of the additive model. This relationship significantly increases in strength as affect toward Trump becomes more positive. For those exhibiting the most positive feelings toward Trump (a 100 on the thermometer, which is 115 individuals in our sample, 29% of Republicans) and the highest score on the PVP, predicted support for the riots is 4.47 (95% CI: 4.06, 4.89), which is between “agree” and “strongly agree.”
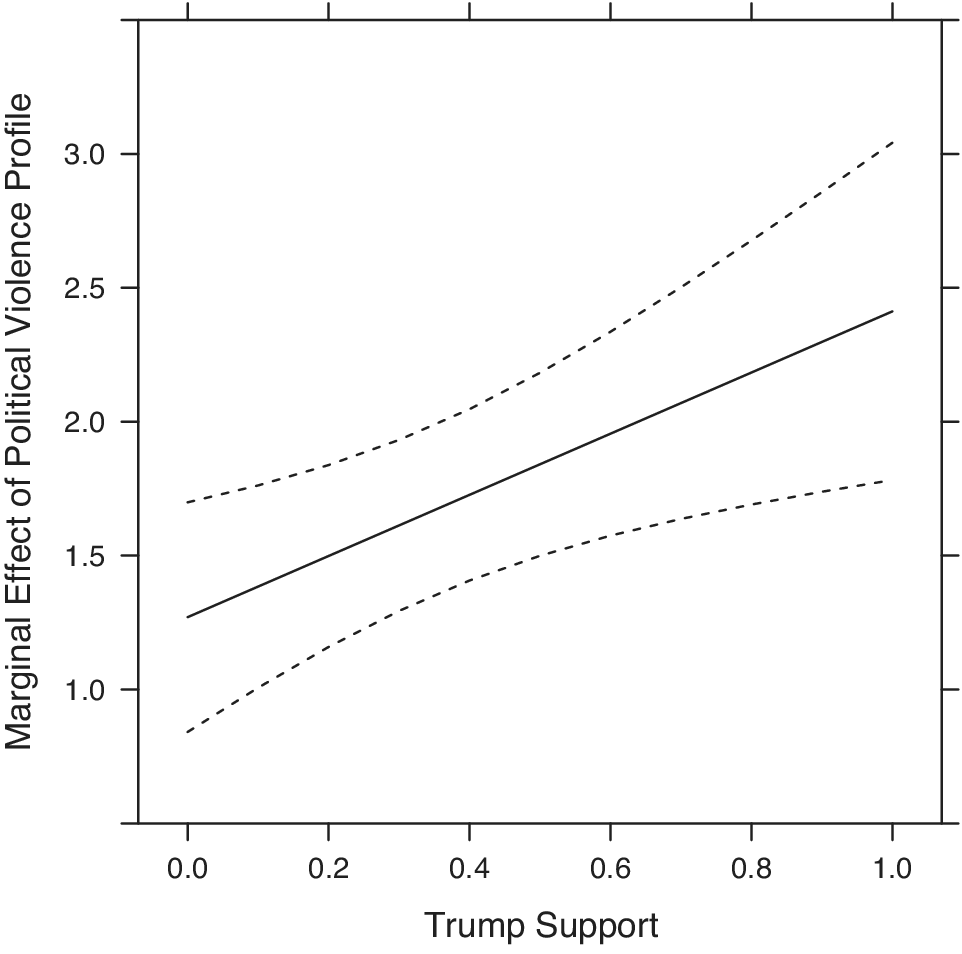
Figure 9 Marginal effect of violence profile on support for the U.S. Capitol riots conditional on Trump support
Notes: Band represents 95% confidence intervals.
This pattern is congruent with what others observed over the course of the Trump presidency. Donald Trump is particularly adept at recognizing, activating, and directing various social-psychological orientations and specific attitudes that other politicians have either ignored or only unsuccessfully manipulated, whether it be feelings of victimhood (Armaly and Enders Reference Armaly and Enders2021), authoritarianism (Knuckey and Hassan Reference Knuckey and Hassan2020), status threat (Mutz Reference Mutz2018), or tendencies toward violence. It is the combination of deep-seated commitment to Donald Trump—not merely Republican Party support or conservatism—and the willingness to engage in, or at least support the use of, political violence that results in a toxic blend of orientations strong enough to support hostility, ignore the disruption of a critical democratic process, and even spur action in some cases.
Conclusion
Our results indicate that support for political violence is strongly associated with a wide variety of psychological, political, and social factors, well beyond political identities, religion, and socioeconomic status, as identified by previous research. Moreover, with the exception of military service, it is the psychological orientations toward power, authority, and racial groups that appear to be the most predictive—in interaction with each other—of support for political violence. The individuals most supportive of political violence in our study exhibited high levels of perceived victimhood, authoritarianism, and white identity, as well as past or present military service. Importantly, this profile of characteristics is capable of explaining attitudes about real world events: especially when combined with strong levels of Trump support, the political violence profile provides the best explanation of who is most likely to believe the riots were justified. Beyond just the Capitol riot, identifying psychological and social factors that relate to support for violence can inform the correlates that may underlie future violence.
These patterns constitute an important link between individual political psychology and actual, behavioral engagement in destructive political acts, such as violence, by demonstrating which individual-level factors translate into support for violence. Reassuringly, neither Democrats nor Republicans, liberals nor conservatives appear to be asymmetrically supportive of political violence in the abstract; this is not inherently a partisan or ideological problem. However, feelings of victimhood and authoritarian personalities are hardly marginal orientations among the American mass public, and politicians—like Donald Trump—have seemingly recognized some utility in activating these orientations, presumably with a goal of expanding and mobilizing their base. Thus, better understanding which of the orientations underwriting support for political violence can be inflamed by elite cues, and how, may help in preventing physical outbreaks of political violence. While we do not ascribe causality in this paper, we do note that some of the factors we consider are “closer” in the likely causal chain than others (e.g., some psychological elements may be a function of identity or sociodemographic characteristics). We encourage future research to disentangle the antecedents of the individual factors we identify.
This point is especially critical given that support for political violence appears to be fostered more by subjective social-psychological orientations (e.g., feelings of victimhood, racial resentment) than objective social conditions, such as socioeconomic depravation or social standing, more generally. In other words, even though some individuals may become radicalized by poor economic conditions or an oppressive political or economic system, we find that more subjective orientations—such as merely feeling like a victim—are more predictive. This makes the etiology of constructs such as authortarianism, perceived victimhood, and in- and out-group racial orientations all the more important to understand. There are many paths that may lead one to loathe the political establishment and other political enemies— many of them seem capable of fostering extremist attitudes regarding acceptable methods of interacting with that establishment and those enemies.
Our study is not without limitations. While we have good reason to examine the support for political violence in the United States after the riot of January 6, 2021, some of our results may be context-dependent—especially those involving uniquely American political identities, or those that may be impacted by “top down” elite communications and behavior. As such, we encourage others to replicate and extend this analysis in other political and cultural contexts. We also acknowledge that the link between attitudinal support for political violence and behavioral engagement in political violence is difficult to empirically decipher, let alone to infer from attitudinal measures alone. Indeed, some support for violence may even amount to nothing more than expressive responding—the intentional misreporting of true beliefs in an effort to express displeasure with the object of the question. That said, we did not include partisan figures/groups in any of the violence questions we employed, which should reduce any expressive responding that might occur. Moreover, even if support for violence does not translate into physical violence, support for breaking such a critical norm may still have grave consequences for the health of democracy—surely attitudinal expressions of extremist sentiments such as this are worthy of systematic attention.
One additional limitation may be the use of an opt-in, non-probability sample, which has the potential to bias results (see Peyton, Huber and Coppock Reference Peyton, Huber and Coppock2020; Westwood et al. Reference Westwood, Grimmer, Tyler and Nall2021). As Coppock and McClellan (Reference Coppock and McClellan2019) and Strange et al. (Reference Strange, Enos, Hill and Lakeman2019) indicate, the use of such samples, while carrying some risk, is appropriate in many contexts and we have taken several steps to ensure the quality of our data, as described earlier. Nevertheless, we encourage increased scholarly focus on support for political violence using different measurements, research designs, data collection procedures, and platforms. Relatedly, we note that concerns common to survey research take on increased importance when attempting to measure something as substantively and normatively important as support for violence. Two concerns in particular—acquiescence bias/satisficing and measurement error—may impact inferences. We direct interested readers to the online appendix, where we consider acquiescence bias and find little cause for concern. As for measurement error, we note (in table 1) that all of our multi-item scales are statistically reliable. Thus, these common concerns do not appear to impact our analysis beyond what is typical. Still, we encourage future work to replicate and extend our analyses using different measures to ensure the robustness of findings.
Finally, we offer some practical advice for researchers studying support for political violence. As we demonstrate, and as others have noted (see Westwood et al. Reference Westwood, Grimmer, Tyler and Nall2021), measuring support for political violence is inherently complicated. Yet we are able to identify a small collection of psychological and identity factors that play into this support. We do not believe that researchers need to measure the same twenty-four potential correlates that we identify and conduct their own classification analysis, as the specific construction of the PVP will, to some degree, be sample-dependent. Rather, we think it is important for researchers to consider the correlates we have identified and use them in their analysis, either by combining them into a political violence profile as we have (i.e., using the classification cutoffs produced by the CART) or with other dimensional reduction techniques (such as principal component analysis or factor analysis). 13 It is the constellation of factors—rather than each factor individually—that is critical when making inferences about support for political violence; treating each variable individually may mask important nuance that is revealed when treating them as constitutive components of a profile of political violence.
The January 6 Capitol riots likely made political violence a less abstract, more tangible concept for many Americans who have never been threatened or seen someone else threatened with violence for political reasons. Even though forecasting individual acts of violence is an extremely difficult and largely empirically fruitless endeavor, understanding who tends to support the use of political violence—both generally and in relation to specific past events or future scenarios—can aid scholars and even law enforcement in preventing acts of violence, on the one hand, and fostering support for civil political interactions and institutions, on the other. As our results suggest, recognizing that rather than any single characteristic, groups of primarily psychological factors likely underscore support for violence might be an important first step.
Supplemental Materials
To view supplementary material for this article, please visit http://doi.org/10.1017/S1537592722001086.
1. Variable Question Wording
2. Sample Characteristics
3. Investigation of Potential Satisficing
4. Relationship between Support for Violence and Each Independent Variable
5. Negative Binomial Model Estimates
6. Garbage Can Model Estimates
7. Validating the PVP with a New Sample
8. Measuring the PVP with PCA and Factor Analysis
Acknowledgements
The authors wish to thank Judd Thornton for his thoughtful comments on an earlier draft.


 Open access