


1 Introduction
We develop a method for using cross-platform links to estimate the ideology of online media content, focusing here on using Reddit data to compute ideology estimates for YouTube videos. We make use of a key insight: we can generate labels for a subset of YouTube videos posted to Reddit and then use that labeled subset to develop an ideology estimator for any political YouTube video.
As online media increasingly influences how people engage with and understand politics, so does the importance of identifying the ideological leanings of such media. Prior work on ideology estimation has often focused on traditional political actors (Bonica Reference Bonica2014; Poole and Rosenthal Reference Poole and Rosenthal1985; Slapin and Proksch Reference Slapin and Proksch2008), while more recent work uses social media data to estimate the ideology of ordinary users of social media platforms (Barberá Reference Barberá2015; Bond and Messing Reference Bond and Messing2015). Other recent work on social media uses similar methods to generate ideology estimates for online news sources and other Internet domains (Eady et al. Reference Eady, Bonneau, Tucker and Nagler2020; Robertson et al. Reference Robertson, Jiang, Joseph, Friedland, Lazer and Wilson2018). We build on this work to estimate the ideology of YouTube videos—individual pieces of media from a specific domain. While a YouTube video cannot hold ideological beliefs in the same way that social media users or politicians might, its content often aligns with certain beliefs or is especially relevant to particular groups. We therefore refer to the ideology of those with affinity for the video as the ideology of the video.
Our measure can be used to operationalize research questions about the political information environment of YouTube, the second most visited website worldwide (Alexa 2021). Videos come from YouTube channels, which are pages run by individuals or organizations who often create many videos in a similar style.Footnote 1 Existing research on YouTube has tended to rely on bespoke data sets containing a few thousand channels labeled by humans (Hosseinmardi et al. Reference Hosseinmardi, Ghasemian, Clauset, Rothschild, Mobius and Watts2020; Munger and Phillips Reference Munger and Phillips2022; Ribeiro et al. Reference Ribeiro, Ottoni, West, Almeida and Meira2020). Furthermore, these data sets contain ideological labels only at the channel level, precluding a more detailed analysis of specific videos or within-channel variation in ideology. They are also inherently static and require further human labeling for each update.
In this paper, we present a method for ideology estimation that addresses these limitations. First, our method estimates the ideology of each video rather than applying channel-level labels. Second, our method operates at scale. We can estimate the ideology of a video on YouTube almost instantaneously without relying on intensive human labeling. Third, our estimates can be easily adjusted to reflect changes in the ideological terrain of YouTube and politics writ large.
We take advantage of ideologically distinct communities on Reddit by using posts linking to YouTube videos in political subreddits to automatically scale individual videos. This provides us with training data for a supervised, text-based model that can estimate ideology given a video’s text metadata. Our ideology estimates are broadly consistent with domain knowledge and intuitively associated with the topics discussed in each video’s transcripts. We further validate them against channel labels from prior research as well as human labels of videos. Finally, we demonstrate the usefulness of this method by applying it to the watch histories of survey respondents with self-reported party identification. We use this data to study the ideological homogeneity of individuals’ video diets and find that individuals' watch histories favor ideologically congruent content. We additionally look at the association between a video’s ideological extremism and its engagement metrics. Our findings suggest that ideologically extreme videos may receive greater or more favorable engagement.
2 Ideology Estimation
2.1 Assumptions and Implementation
Reddit, a popular online platform, is comprised of subreddits organized around shared interests and beliefs. For example, r/conservative is a subreddit where users discuss and espouse politically conservative positions, while users in r/liberal do the same for politically liberal positions. Users can engage with subreddits by creating their own posts, commenting on the posts of others, or “upvoting” and “downvoting” posts that they like or dislike. These upvotes and downvotes are used to calculate the “score” of a post so that posts with higher scores are more popular in a subreddit than posts with scores at or below zero. While there are hundreds of thousands of subreddits organized around everything from cartoon avatars to cooking, we focus on political subreddits. Our underlying assumption is that the more popular a post is on a subreddit, the better it aligns with that subreddit’s focus. In practice, we therefore assume that popular content in a political subreddit generally agrees with the subreddit’s ideological leanings.
This assumption—which we refer to henceforth as the “homophily assumption”—is found throughout the existing methodological literature on ideology estimation. It is the basis for estimating the ideology of Twitter users by looking at whom they follow (Barberá Reference Barberá2015), the ideology of donors based on whose campaigns they contribute to (Bonica Reference Bonica2014), and the ideology of politicians based on the bills they support (Poole and Rosenthal Reference Poole and Rosenthal1985). In each case, the homophily assumption simply states that like goes with like. Conservative Twitter users will follow conservative politicians, liberal donors will contribute to liberal campaigns, and moderate legislators will vote for moderate bills.
Formally, there is an actor i whose ideology we want to estimate, an observable action
 $y_{ij}$
that contains information about this latent trait, and a domain j in which the action is taken. We assume that the elements of the domain (i.e., bills; political campaigns; the Twitter accounts of politicians; or, in our context, subreddits) have an ideology, denoted
$y_{ij}$
that contains information about this latent trait, and a domain j in which the action is taken. We assume that the elements of the domain (i.e., bills; political campaigns; the Twitter accounts of politicians; or, in our context, subreddits) have an ideology, denoted
 $\theta _j$
. Similarly, we are interested in the ideology of the actor, denoted
$\theta _j$
. Similarly, we are interested in the ideology of the actor, denoted
 $X_i$
. The “action” we observe tells us which element in the domain was selected by which actor, creating an observed pairing of
$X_i$
. The “action” we observe tells us which element in the domain was selected by which actor, creating an observed pairing of
 $\theta _j$
and
$\theta _j$
and
 $X_i$
denoted
$X_i$
denoted
 $y_{ij}$
. In the example of roll call votes and following behavior on Twitter,
$y_{ij}$
. In the example of roll call votes and following behavior on Twitter,
 $y_{ij}$
is 1 if actor i supports (follows) bill (politician) j. In the context of campaign contributions,
$y_{ij}$
is 1 if actor i supports (follows) bill (politician) j. In the context of campaign contributions,
 $y_{ij}$
might be a measure of the total amount contributed to campaign j by politician i. In our case,
$y_{ij}$
might be a measure of the total amount contributed to campaign j by politician i. In our case,
 $y_{ij}$
is the logged score a post linking to a YouTube video i receives in a given subreddit j.
$y_{ij}$
is the logged score a post linking to a YouTube video i receives in a given subreddit j.
Armed with a large number of such observations, we can estimate the ideology of both the actor and the domain by appealing to the homophily assumption as follows:
 $$ \begin{align} u_i(\theta_j) = f(X_i,\theta_j), \end{align} $$
where the utility function
 $f(\cdot )$
is typically assumed to follow a quadratic loss form:
$f(\cdot )$
is typically assumed to follow a quadratic loss form:
 $-||X_i - \theta _j||^2 + \eta _{ij}$
. Substantively, the homophily assumption states that the actor i will support/follow/contribute to element j to maximize her utility, meaning that we should observe
$-||X_i - \theta _j||^2 + \eta _{ij}$
. Substantively, the homophily assumption states that the actor i will support/follow/contribute to element j to maximize her utility, meaning that we should observe
 $y_{ij}$
when
$y_{ij}$
when
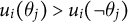 $u_i(\theta _j)> u_i(\neg \theta _j)$
(let
$u_i(\theta _j)> u_i(\neg \theta _j)$
(let
 $\nu _{ij}$
represent the disturbance term for
$\nu _{ij}$
represent the disturbance term for
 $\neg \theta _{j}$
, analogous to
$\neg \theta _{j}$
, analogous to
 $\eta _{ij}$
). Estimation in the context of a binary outcome reduces to the well-known item response model used in education, where we assume the errors
$\eta _{ij}$
). Estimation in the context of a binary outcome reduces to the well-known item response model used in education, where we assume the errors
 $\eta _{ij}$
and
$\eta _{ij}$
and
 $\nu _{ij}$
are independent across actors and domains, and have a joint normal distribution (Clinton, Jackman, and Rivers Reference Clinton, Jackman and Rivers2004).
$\nu _{ij}$
are independent across actors and domains, and have a joint normal distribution (Clinton, Jackman, and Rivers Reference Clinton, Jackman and Rivers2004).
 $$ \begin{align*} Pr(y_{ij} = 1) &= Pr(u_i(\theta_j)> u_i(\neg \theta_j)) \\&= Pr(\nu_{ij} - \eta_{ij} < 2(\theta_j - \neg \theta_j)\prime X_i \\&\quad + \neg \theta_j^\prime \neg \theta_j - \theta_j^\prime \theta_j) \\&= \Phi(\beta_j^\prime X_i - \alpha_j). \end{align*} $$
Proper Bayesian item response theory (IRT) is an intuitive but computationally intensive solution for estimating both
 $X_i$
and
$X_i$
and
 $\theta _j$
. In our application, described in detail below, we have thousands of elements in our domain (political subreddits), and tens of thousands of actors (YouTube videos). As such, we rely on the more computationally feasible method of correspondence analysis. Work by Greenacre (Reference Greenacre2017) shows that correspondence analysis is a feasible method for approximating Bayesian ideal point estimation. While we do not directly compare the results of Bayesian IRT and correspondence analysis for this specific application, other work dealing with large, sparse correspondence matrices from user-generated Internet data has shown that these scores are approximately similar across contexts (Barberá et al. Reference Barberá, Jost, Nagler, Tucker and Bonneau2015). To provide further intuition, correspondence analysis, like principal component analysis, is a dimensionality reduction technique that effectively projects data along an axis of maximum variance. We assume, then, that political videos in a multidimensional space defined by political subreddits will lie close to one another when their ideologies are similar and far apart when they are not. Correspondence analysis should therefore preserve these distances when projecting videos into a lower-dimensional space.
$\theta _j$
. In our application, described in detail below, we have thousands of elements in our domain (political subreddits), and tens of thousands of actors (YouTube videos). As such, we rely on the more computationally feasible method of correspondence analysis. Work by Greenacre (Reference Greenacre2017) shows that correspondence analysis is a feasible method for approximating Bayesian ideal point estimation. While we do not directly compare the results of Bayesian IRT and correspondence analysis for this specific application, other work dealing with large, sparse correspondence matrices from user-generated Internet data has shown that these scores are approximately similar across contexts (Barberá et al. Reference Barberá, Jost, Nagler, Tucker and Bonneau2015). To provide further intuition, correspondence analysis, like principal component analysis, is a dimensionality reduction technique that effectively projects data along an axis of maximum variance. We assume, then, that political videos in a multidimensional space defined by political subreddits will lie close to one another when their ideologies are similar and far apart when they are not. Correspondence analysis should therefore preserve these distances when projecting videos into a lower-dimensional space.
Our proposed method relies on a two-step procedure as visualized in Figure 1. We start by manually identifying a set of clearly ideological subreddits which we then expand via community detection.Footnote 2 We take a wide range of subreddits and assume they represent different points on an ideological spectrum. Next, we identify YouTube videos posted in these subreddits and calculate the ideologies of approximately 70,000 videos by running correspondence analysis on a filtered subreddit-video matrix. In the final step, we use those videos as training data for a text-based model that predicts the ideology of a video based on its text metadata. We can then use this model to estimate the ideology of any political YouTube video.

Figure 1 A schematic of our overall method for ideology estimation from cross platform links.
Our proposed method is scalable, fast, and requires minimal human supervision, yet returns measures of video-level ideology with strong validity across a number of tests and is relatively insensitive to permutations in data collection.Footnote 3 We describe each step in turn below, starting with the creation of the training labels using correspondence analysis on data from political subreddits.
2.2 Identifying Political Subreddits
For the purposes of estimating political ideology, we restrict our attention to subreddits organized around a shared political position with a sufficient number of posts linking to YouTube videos. Given that Reddit has over 100,000 active subreddits (Staff 2021), it would be intractable to manually identify the universe of political subreddits. Reddit’s political landscape is also dynamic, with subreddits changing over time and evolving with current events—new subreddits are regularly added while some old ones may become less active. To address these challenges, we begin by creating a seed set of 424 political subreddits by manually reviewing the list in Siegel et al. (Reference Siegel2019) and adding subreddits that are listed in the original subreddits’ self-authored “related” sections. We then expand upon this set of political subreddits by running community detection on a subreddit network and filtering for political subreddits via correspondence analysis. We assume that subreddits near our initial set of 424 manually curated political subreddits in a dimension-reduced space are also political in nature, while those that are more distant are not. This captures a comprehensive set of political subreddits with little human supervision.
To create the subreddit network, we begin with the publicly available Pushshift Reddit data set (Baumgartner et al. Reference Baumgartner, Zannettou, Keegan, Squire and Blackburn2020) and filter for posts linking to YouTube across all subreddits, leaving us with roughly 31 million posts with a date range of December 31, 2011 to June 21, 2021. We filter for posts with more than one comment and a post score higher than one to reduce noise from irrelevant posts.Footnote
4
We then construct a network with subreddits as nodes. If x unique YouTube videos are posted in both subreddits a and b, then an edge with weight x is drawn between a and b. To detect groups of closely connected subreddits, we run the Leiden community detection algorithm on the resulting network with a maximum community size of 10 (Traag, Waltman, and Van Eck Reference Traag, Waltman and Van Eck2019). Then, assuming that political subreddits will largely connect to other political subreddits, we keep communities containing at least one of our 424 hand-selected political subreddits.Footnote
5
 $^{,}$
Footnote
6
This leaves us with 856 subreddits, 259 of which were in our initial hand-selected set.Footnote
7
$^{,}$
Footnote
6
This leaves us with 856 subreddits, 259 of which were in our initial hand-selected set.Footnote
7
We then run correspondence analysis on the subreddit-video matrix as described in Section 2.3 and use the resulting subreddit scores to help identify non-political subreddits. We assume political and non-political subreddits will lie far away from each other in a multidimensional space. Since the majority of these subreddits should be political, insufficiently political subreddits should stick out once we use correspondence analysis to reduce dimensionality. We find that we can indeed easily distinguish groups of political and non-political subreddits based on visual analysis. Here, we take the first four dimensions of the correspondence analysis coordinates for subreddits and plot the first against the second, the second against the third, and the third against the fourth.Footnote 8 A clear set of outliers emerges. Political subreddits, which we identify by coloring subreddits belonging to our hand-selected set, cluster together, while seemingly non-political subreddits are placed on the extremes. We therefore exclude subreddits whose coordinates lie far away from those of political subreddits and ultimately filter out 37 insufficiently political subreddits for a final set of 819 subreddits.Footnote 9
Notably, the identification of political subreddits is the only step of our method requiring active human supervision. The community detection step is included to yield a richer correspondence matrix though it comes at the cost of potentially including subreddits that are less political or are focused on the politics of another country. However, we show in the Supplementary Material that our results are robust to permutations of the underlying data.
2.3 Step 1: Ideology Estimation Using a Subreddit-Video Matrix
We then create the subreddit-video matrix used to obtain our first ideology estimates. We retain all posts from these 819 subreddits in our Reddit data set and keep YouTube video posts with a score greater than or equal to one for a total of roughly 1.3 million posts. We filter the data for basic popularity metrics by keeping subreddits where at least five unique videos have been posted and videos that have been posted in a minimum of three subreddits. This leaves us with 432,115 posts that we use to create a subreddit-video matrix with videos as rows and subreddits as columns.
We populate the matrix with indicators of how well each video seemed to align with a subreddit. If video v receives a post score of x in subreddit s, then the corresponding matrix entry for
 $(v,s)$
is
$(v,s)$
is
 $\ln (x + 1)$
, where we take the natural log due to the range and skew of post scores. The corresponding matrix entry is zero if a video does not appear in a subreddit, or if it received a negative post score, indicating incongruence with the subreddit to which it was posted. We assume that subreddits are choosing from the same universe of videos and thus treat the cases where a video is not chosen or scores poorly when posted as equivalent—if a video scores poorly, we might infer that the subreddit at large did not feel the video should have been posted at all. After this filtering process, we obtain a sparse matrix with 74,038 videos as rows and 685 subreddits as columns.
$\ln (x + 1)$
, where we take the natural log due to the range and skew of post scores. The corresponding matrix entry is zero if a video does not appear in a subreddit, or if it received a negative post score, indicating incongruence with the subreddit to which it was posted. We assume that subreddits are choosing from the same universe of videos and thus treat the cases where a video is not chosen or scores poorly when posted as equivalent—if a video scores poorly, we might infer that the subreddit at large did not feel the video should have been posted at all. After this filtering process, we obtain a sparse matrix with 74,038 videos as rows and 685 subreddits as columns.
We can use this matrix to situate videos and subreddits in a multidimensional space and reduce the dimensionality via correspondence analysis. Correspondence analysis first standardizes the matrix by using row and column weights, or marginal probabilities, to center the data around the expected values of the matrix entries. The resulting matrix of standardized residuals then undergoes singular value decomposition, which gives a lower rank approximation of the matrix. In other words, it identifies an optimal lower-dimensional subspace that lies close to our data. Rows and columns, or videos and subreddits, can then be projected onto this subspace so that we get an approximation of their true positions with the first dimension of coordinates capturing the most variance in our data (Barberá et al. Reference Barberá, Jost, Nagler, Tucker and Bonneau2015; Greenacre Reference Greenacre2017).
We take the first dimension from the correspondence analysis solution for the rows, or videos, and use these as our ideology score estimates. The first dimension of the correspondence analysis solution along the columns provides estimates of the subreddit ideologies that we use to further validate the results of the first step of our method. Since the ensuing step requires text features to predict the ideology of videos not on Reddit, we keep the videos for which we have video metadata, giving us a final set of 61,883 videos. We underscore that correspondence analysis is a computationally efficient solution to the Bayesian IRT method used in related work and that the interpretation of the latent dimension as ideological is consistent with theory summarized in Section 2.1 above.
2.4 Step 2: Predicting the Ideologies of New Videos
We have presented a method for estimating the ideology of YouTube videos posted in political subreddits by running correspondence analysis on a subreddit-video matrix. However, this only provides us with ideology estimates for sufficiently popular YouTube videos posted in political subreddits. We would like to estimate the ideologies of other political videos as well. Here, we show that text features available for all YouTube videos are sufficient to recover these ideology estimates via a natural language processing model called BERT (Bi-directional Encoder Representations from Transformers)—a pre-trained transformer-based model for language understanding. BERT represents these text features as numerical vectors that are then used as input to a neural network regression head producing an ideology estimate. We choose BERT because of its flexibility, state-of-the-art performance on natural language understanding tasks, and relative ease of fine-tuning. In particular, BERT’s word representations, also known as word embeddings, can account for the context in which a word occurs by processing the entire sequence surrounding that word (Devlin et al. Reference Devlin, Chang, Lee and Toutanova2018; Wolf et al. Reference Wolf2020).
We train the BERT model to estimate ideology based on the text metadata of any political video, thus widening the scope of potential analyses conducted using our method.Footnote 10 We fine-tune the model on a training set of 49,970 videos. Video uploaders supply text metadata which can be collected by querying the YouTube Data API. For the input features, we concatenate the video title, channel title, video description, and video tags, with URLs stripped from the video description.Footnote 11 The model’s target outputs are the ideology estimates obtained by running correspondence analysis on the subreddit-video matrix as described in Section 2.3. A total of 2,631 videos are used as a validation set to assist in choosing the best-performing model. We fine-tune multiple versions of the model with varied hyperparameters and ultimately use the version with the best performance on the validation set.
On the holdout test set of 9,282 videos, the text-based predictions and matrix-based scores have a correlation coefficient of 0.891 with
 $R^2 \approx 0.793$
. The root-mean-squared error is 0.42, roughly 12% of 3.408, the range of the matrix-based scores of the videos in the test set, and roughly 46% of 0.919, the standard deviation of the same. The mean absolute error (MAE) is 0.295—about 9% of the score range and about 32% of the standard deviation. Thus, we manage to closely recover our ideology estimates with a model that only takes in text features.
$R^2 \approx 0.793$
. The root-mean-squared error is 0.42, roughly 12% of 3.408, the range of the matrix-based scores of the videos in the test set, and roughly 46% of 0.919, the standard deviation of the same. The mean absolute error (MAE) is 0.295—about 9% of the score range and about 32% of the standard deviation. Thus, we manage to closely recover our ideology estimates with a model that only takes in text features.
The method described in Section 2.1 provides us with training labels for a text-based ideology prediction model at a scale that would be difficult and time-consuming to achieve with human coders. The model performs well with a low MAE, showing that text features available for all videos allow us to closely approximate the ideology estimates obtained from running correspondence analysis on a subreddit-video matrix. We can therefore estimate the ideology of any political video based on its accompanying text metadata, and we illustrate such a use of our model in Section 4.
3 Validation
In this section, we validate the ideology estimates obtained in Section 2.3 at the aggregate level and at the video level, checking them against domain knowledge, labels from prior literature, and human-labeled data. We also justify our use of the correspondence analysis ideology estimates as training label inputs for our text-based model and validate the text-based model’s outputs against human-labeled videos and video pairs. Further, when compared to the agreement obtained with the matrix-based estimates, our text-based estimates agree with human coders at similar rates even with the addition of videos not posted on Reddit.
3.1 Validation of Step 1
First, we confirm that the estimates of
 $\theta _j$
return a reasonable picture of the political subreddits based on domain knowledge. In Figure 2, subreddits are sized relative to the number of videos contributed to the subreddit-video matrix and ordered by their ideology score (the first dimension of the correspondence analysis solution along the columns). We find that general interest subreddits like r/worldnews, r/news, and r/politicalhumor are placed near the ideological center. Subreddits for supporters of Bernie Sanders and Andrew Yang are placed on the left, while the popular, now-banned, subreddit for Donald Trump supporters, r/the_donald, is on the right. The now-banned far right subreddit r/thenewright is even further right than r/the_donald. This agrees with our priors on the ideological leanings of these subreddits.
$\theta _j$
return a reasonable picture of the political subreddits based on domain knowledge. In Figure 2, subreddits are sized relative to the number of videos contributed to the subreddit-video matrix and ordered by their ideology score (the first dimension of the correspondence analysis solution along the columns). We find that general interest subreddits like r/worldnews, r/news, and r/politicalhumor are placed near the ideological center. Subreddits for supporters of Bernie Sanders and Andrew Yang are placed on the left, while the popular, now-banned, subreddit for Donald Trump supporters, r/the_donald, is on the right. The now-banned far right subreddit r/thenewright is even further right than r/the_donald. This agrees with our priors on the ideological leanings of these subreddits.

Figure 2 Subreddits arranged from most liberal (left) to most conservative (right) according to their ideology scores calculated via correspondence analysis. Subreddits are sized by the number of YouTube videos posted in that subreddit in our data set.
Next, we aggregate the individual video ideology scores to the channel level and compare our continuous measure with a five-category set of ideology labels from published work. Our estimates cohere with channel-level ideology labels from Hosseinmardi et al. (Reference Hosseinmardi, Ghasemian, Clauset, Rothschild, Mobius and Watts2020), which aggregates channel labels from Ribeiro et al. (Reference Ribeiro, Ottoni, West, Almeida and Meira2020), Ledwich and Zaitsev (Reference Ledwich and Zaitsev2019), and Faddoul, Chaslot, and Farid (Reference Faddoul, Chaslot and Farid2020) with a majority vote rule. We estimate a channel’s ideology score by taking the mean of the ideology scores of a channel’s videos. In panel (a) of Figure 3, we show the distribution of our channel ideology scores when grouped by the labels from Hosseinmardi et al. (Reference Hosseinmardi, Ghasemian, Clauset, Rothschild, Mobius and Watts2020) and find general agreement.

Figure 3 (a) For each channel in our data set labeled by Hosseinmardi et al. (Reference Hosseinmardi, Ghasemian, Clauset, Rothschild, Mobius and Watts2020), we calculate the mean of its videos’ ideology scores and plot it under the corresponding channel label. (b) For each of the five channel label categories, we calculate the mean number of views for channels. Then, for each label, we take the three channels with the highest number of mean views and at least 50 videos in our data set and plot the corresponding box plots for a total of 15 plots.
Interestingly, the channel ideology distribution in the “Left” category is bimodal rather than largely unimodal as in the other categories. To better understand the nature of this bimodal distribution, we separate the Left channels into two groups: those with mean ideology scores (1)
 $\leq -0.75$
and (2)
$\leq -0.75$
and (2)
 $> -0.75$
. Group 2 largely contains mainstream news channels like CNN, NBC News, and The Nation, while the channels in group 1 tend to be more explicitly partisan, with examples including Andrew Yang for President 2020 and the Jimmy Dore Show.Footnote
12
Thus, channels labeled as Left by Hosseinmardi et al. (Reference Hosseinmardi, Ghasemian, Clauset, Rothschild, Mobius and Watts2020) can be broken down into a set of more moderate and more partisan channels with the use of our ideology estimates.
$> -0.75$
. Group 2 largely contains mainstream news channels like CNN, NBC News, and The Nation, while the channels in group 1 tend to be more explicitly partisan, with examples including Andrew Yang for President 2020 and the Jimmy Dore Show.Footnote
12
Thus, channels labeled as Left by Hosseinmardi et al. (Reference Hosseinmardi, Ghasemian, Clauset, Rothschild, Mobius and Watts2020) can be broken down into a set of more moderate and more partisan channels with the use of our ideology estimates.
In panel (b) of Figure 3, we take the top three channels with the highest average video count within each of the five ideological categories and show the box plots for the ideology scores of their videos. Again, this agrees with our expectations from domain knowledge, with channels belonging to far right figures like Paul Joseph Watson and Steven Crowder placed to the right of Fox News, and more liberal channels like NowThis News and Late Night with Seth Meyers arrayed on the ideological left.
We also highlight the interquartile ranges (IQR; indicated by rectangles) that narrow as we move toward more ideologically extreme channels. In the center of our scale, mainstream news channels such as ABC News and C-SPAN have a relatively large IQR. This may be due to the variety of subjects covered by such channels, as the topic or interview subject likely influences a video’s appeal or relevance to people with different ideological leanings. In contrast, the IQR narrows as we approach the extremes on both the left and the right. Note also that in panel (a), the distributions of the mean ideology scores for channels labeled as far left, left, center, and right have clear differences, while the distributions for the right and far right appear similar. Based on panel (b), we posit that channels on the right and far right may be more similar to one another than their human labels would suggest.
Thus, we show that our scores agree with domain knowledge and prior literature. This also highlights the practical utility of continuous measures of ideology at the video level, as they grant deeper insight into the distributions of content among different channels.
Before using video text metadata as training features, we perform an additional validation check and run a structural topic model (STM; Roberts et al. Reference Roberts, Stewart and Tingley2019) on the transcripts of the videos found on Reddit and scored via correspondence analysis. We detail the results in the Supplementary Material: in summary, we find evidence in support of our proposed measure of ideology, as topics most strongly associated with liberal, moderate, and conservative ideologies align with expectations based on domain knowledge.
These validation exercises, as well as video-level validations detailed in the Supplementary Material and echoed below for the text-based estimates, justify the use of these videos as training data in developing a text-based ideology estimator that can be applied to any video.
3.2 Validation of Step 2
We validate our method’s final outputs, or the text-based ideology scores, at the video level in two ways. First, we asked human coders to determine which of two videos was more liberal or conservative.Footnote 13 Coders could also indicate that one or both of the videos did not seem ideological, in which case we exclude the video pair from our calculations.
As the topics of political videos vary widely, this is not a trivial task—coders may need to compare, for instance, a video on immigration versus a video on the economy, or a video on history and an interview with a politician. As such, we expect our human-labeled validation to be worse when the comparison is between two ideologically similar videos, not because we believe our proposed method is wrong, but rather because even human coders have difficulty determining which content is more liberal among two similarly progressive videos. Formally, this validation exercise analyzes 1,587 unique pairs of videos where one or more coders compared video ideologies. A total of 2,401 unique videos were used to construct these pairs: 1,948 videos came from the test set of Reddit videos, and, to help validate the model’s performance on political videos outside of our data set, we add another 453 videos that were not included in our subreddit-video matrix.
Let
 $X_i$
and
$X_i$
and
 $X_j$
denote the ideology scores of videos i and j, respectively. We define score distance
$X_j$
denote the ideology scores of videos i and j, respectively. We define score distance
 $d = |X_i-X_j|.$
We expect that as d increases, the task becomes easier for human coders and the scores will increasingly agree with the human judgments. This is indeed the case. In Figure 4, we bin labeled pairs of videos by their score distance and calculate the percentage of agreement with the human coders for each bin. For each pair of videos, agreement a is a binary outcome. Human coders are assigned one of two questions: is video i (1) more conservative or (2) more liberal then video j? If human coders agree that i is more conservative than j,
$d = |X_i-X_j|.$
We expect that as d increases, the task becomes easier for human coders and the scores will increasingly agree with the human judgments. This is indeed the case. In Figure 4, we bin labeled pairs of videos by their score distance and calculate the percentage of agreement with the human coders for each bin. For each pair of videos, agreement a is a binary outcome. Human coders are assigned one of two questions: is video i (1) more conservative or (2) more liberal then video j? If human coders agree that i is more conservative than j,
 $$\begin{align*}a = \begin{cases} 1, & \text{ if } X_i> X_j,\\ 0, & \text{ if } X_i \leq X_j. \end{cases} \end{align*}$$
Otherwise, if coders agree that i is more liberal than j,
 $$\begin{align*}a = \begin{cases} 1, & \text{ if } X_i < X_j,\\ 0, & \text{ if } X_i \geq X_j. \end{cases} \end{align*}$$

Figure 4 The text model scores perform similarly to the correspondence analysis scores (see the Supplementary Material) when compared to human labeled data. In (a), the score distance is the absolute value of the difference between the ideology scores of two videos. Percent agreement is the percentage of labeled video pairs where the ideology scores aligned with the label and is calculated for videos falling within each score distance bin. In (b), each point is a labeled video pair, where the x-coordinate represents the score distance and the binary y-coordinate is whether the ideology scores of the videos agreed with the human label. We fit a probit regression to these points and find that it trends upward, increasing with score distance.
In Figure 4, we see a clear upward trend in agreement as d increases and have more than 75% agreement for video pairs with
 $d> 1$
. We also plot score distance versus agreement and fit a probit model to better illustrate how agreement increases with score distance. Based on these findings, we are confident in the validity of the ideology scores.
$d> 1$
. We also plot score distance versus agreement and fit a probit model to better illustrate how agreement increases with score distance. Based on these findings, we are confident in the validity of the ideology scores.
Additionally, we check these video-level scores against human perceptions of ideology. We enlisted additional human coders to label 937 videos from the held-out set of Reddit-sourced videos used to validate our text-based ideology estimator. These coders made pairwise comparisons between videos and also placed each video in one of seven ideology bins ranging from very liberal to very conservative with a minimum of three coders per video. When comparing our text-based ideology scores to coders’ bin placements, we filter out videos deemed non-political or irrelevant to U.S. politics as well as videos where coders showed significant “cross-aisle” disagreement, meaning that at least 25% of coders labeled the video as conservative and at least 25% of coders labeled the video as liberal. We choose to drop these videos from our validation analysis as they may not map onto the standard left-right ideological spectrum of interest in our application. Doing so yields a total of 535 video comparisons. As shown in Figure 5, we find a reasonably strong correlation between average human bin placements for each video and our text-based ideology scores, with a Pearson correlation of 0.66. We also manually review videos where our method and the human labels indicate opposing ideologies and find that the bulk of these discrepancies appear to be due to human error.Footnote 14 Overall, the results show that our measure corresponds to how humans perceive the ideology of the videos.

Figure 5 The average of the ideological bin placements by human coders versus text-based ideology scores for videos where coders do not have significant cross-aisle disagreement. A local polynomial regression fitting is plotted on top of the points to show the overall trend of the points.
4 Application: Media Diets and Ideology versus Engagement
To demonstrate the usefulness of this method, we apply it to political videos from real users’ watch histories and quantify the ideology of their media diets as well as the association between ideological extremism and a video’s engagement metrics. We use video-level ideology estimates from applying the model trained in Section 2.4 to the text metadata for the videos in the respondents’ watch histories.
4.1 Media Diets
Prior work has studied whether individuals self-select into ideologically homogeneous online media diets and found that some users indeed display a preference for ideologically congruent content (Bakshy, Messing, and Adamic Reference Bakshy, Messing and Adamic2015; Guess Reference Guess2021). As news consumption has increasingly moved online, concerns have grown that users may restrict themselves to partisan news diets and fail to be exposed to the range of views that is theoretically essential to the functioning of deliberative democracy. We test this by examining the watch history of YouTube users.
Our data come from Aslett et al. (Reference Aslett, Guess, Bonneau, Nagler and Tucker2022), which collected the browsing histories of 3,337 YouGov survey respondents from May 17 to July 14 in 2020. Of these respondents, 345 viewed videos in YouTube’s News & Politics category for a total of 6,012 unique political videos with available metadata. The respondents’ self-reported party identifications break down into 190 Democrats, 107 Republicans, and 48 Independents. To better understand whether YouTube users select into ideologically narrow media diets, we look at media diets at the party and individual level in Figure 6.

Figure 6 (a) We show an ideology distribution of videos viewed by Republicans, Independents, and Democrats with overlaid box plots indicated the IQR and median. (b) For respondents who viewed at least five political videos, we plot the median of the ideologies of the videos in their watch history. Lines denote the IQR of those ideologies. Note that for both of these figures, we removed duplicates at the respondent-video level since some respondents watched the same video more than once.
In panel (a), we take all videos viewed by respondents from each political party and plot the distribution of the videos’ ideologies. Some clear party-level differences emerge: the median video ideology for Democrats, Independents, and Republicans are
 $-0.36$
, 0.26, and 0.53, respectively, showing a clear distinction in the types of videos viewed by Democrats and Republicans. The standard deviations of the ideologies of videos viewed by Democrats, Independents, and Republicans are similar (0.48, 0.62, and 0.46, respectively). The distributions show that there is substantial overlap in the ideological distributions of videos consumed across partisans, but there is also a substantial ideological range from which Republicans see many videos and Democrats almost never see videos, and vice versa.
$-0.36$
, 0.26, and 0.53, respectively, showing a clear distinction in the types of videos viewed by Democrats and Republicans. The standard deviations of the ideologies of videos viewed by Democrats, Independents, and Republicans are similar (0.48, 0.62, and 0.46, respectively). The distributions show that there is substantial overlap in the ideological distributions of videos consumed across partisans, but there is also a substantial ideological range from which Republicans see many videos and Democrats almost never see videos, and vice versa.
In panel (b), for each respondent with at least five political videos in their watch histories, we plot the median ideology of those videos with a line indicating the interquartile range. Grouping by political party and calculating the median of the medians gives us
 $-0.08$
for Democrats, 0.34 for Independents, and 0.49 for Republicans. These medians, as well as visual inspection of panel (b), show that Democrats generally cluster in the middle of the ideological spectrum, while Republicans are more concentrated on the right. Notably, we find a group of Democrat respondents clustered on the far left away from the main group. We also take the mean of the respondent-level standard deviation of the ideology scores and get 0.38 for Democrats, 0.45 for Independents, and 0.39 for Republicans. Recall that the standard deviation of the ideology scores calculated in Section 2.3 is 0.91: these are significantly smaller in comparison and suggest that users opt for ideologically congruent content rather than merely viewing a random sample of ideological YouTube content. While some respondents from different parties view content that overlaps ideologically, there are many others whose media diets do not appear to have any ideological common ground.
$-0.08$
for Democrats, 0.34 for Independents, and 0.49 for Republicans. These medians, as well as visual inspection of panel (b), show that Democrats generally cluster in the middle of the ideological spectrum, while Republicans are more concentrated on the right. Notably, we find a group of Democrat respondents clustered on the far left away from the main group. We also take the mean of the respondent-level standard deviation of the ideology scores and get 0.38 for Democrats, 0.45 for Independents, and 0.39 for Republicans. Recall that the standard deviation of the ideology scores calculated in Section 2.3 is 0.91: these are significantly smaller in comparison and suggest that users opt for ideologically congruent content rather than merely viewing a random sample of ideological YouTube content. While some respondents from different parties view content that overlaps ideologically, there are many others whose media diets do not appear to have any ideological common ground.
Overall, further investigation would be required to quantify the degree of ideological homogeneity in users’ YouTube diets, but we show evidence consistent with some preference for ideologically congruent content based on respondents’ self-reported ideologies.
4.2 Ideological Extremism and User Engagement with Videos
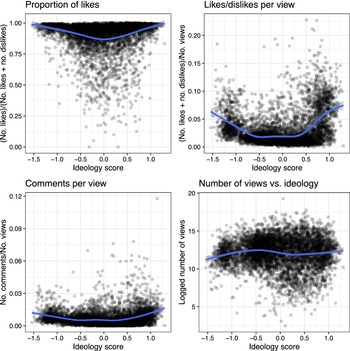
Narratives about ideologically extreme YouTube videos have suggested that viewers may find such videos especially appealing, leading YouTube to promote them via the recommendation algorithm (Roose Reference Roose2019; Tufekci Reference Tufekci2018). We address the question of whether a video’s ideology appears to be associated with popularity and engagement metrics. We look at (1) the proportion of likes, (2) view to like or dislike conversion rate, (3) number of comments per view, and (4) the logged number of views. The proportion of likes captures how favorably viewers respond to a video, while the rate of comments and likes and dislikes per view measures whether viewers tend to further engage with a video.
In Figure 7, we plot these metrics against the text-based ideology scores of the videos in respondents’ watch histories, and fit generalized additive models to the data to highlight overall trends. We do not see a clear association between the logged number of views and ideology (bottom-right panel). The bottom-left and top-right panels (likes/dislikes per view and comments per view), however, show that extreme videos are substantially more likely than moderate videos to generate comments and likes or dislikes per view. This is important for platform functioning because it suggests why, when platforms choose to algorithmically amplify content based on engagement, they may be amplifying extreme content (Merrill and Oremus Reference Merrill and Oremus2021; Rathje, Van Bavel, and Van Der Linden Reference Rathje, Van Bavel and Van Der Linden2021). Our method provides a means to test the ideological nature of videos potentially amplified by YouTube.

Figure 7 We plot the ideology score of political videos from users’ watch histories against metrics of popularity and engagement. Generalized additive models are fit to the data and plotted on top of the data points.
5 Discussion
To better understand the potential effects of political online media, it is useful to quantify where that media falls on an ideological spectrum. In this paper, we present and validate a method for estimating the ideology of YouTube videos. Video is of growing importance on social media and as a medium through which people get their news. We provide a method for efficiently measuring the ideology of videos, opening up a world of analysis that can make use of such data (Matsa Reference Matsa2023). We also note that this general methodology could be useful for estimating the ideologies of other pieces of media.
Our two-step method is fast, dynamic, and cheap. The only human oversight required occurs at the data collection step where researchers must use domain knowledge to select the subreddits necessary to populate the matrix used for correspondence analysis. With these in hand, our method allows us to quickly obtain a large number of ideology estimates via correspondence analysis which we use as training data for an NLP model. The underlying domain-actor matrix can be quickly updated based either on evolving domain knowledge or via community detection and the efficiency of correspondence analysis means scores can be easily recomputed. The transformer NLP model is then used to predict the ideology of any video on YouTube regardless of whether it appears in our original collection of subreddits.
We validate the resulting video-level ideology scores in three ways. First, we aggregate the scores to the channel level and compare our average estimates to existing published work that relies on human labeling to code channels. Second, we hired human coders to validate the video-level scores, confirming that our method coheres well with human intuition. Third, we use STMs to generate topics as a function of our ideology scores, further confirming that those most strongly associated with liberal (conservative) scores are clearly about liberal (conservative) topics (see the Supplementary Material).
We include a number of sensitivity analyses in our Supplementary Material and show that the method is robust to the omission of random subsets of subreddits and resampling of the videos. Future extensions might further improve accuracy by incorporating other features into the model (i.e., video or audio as data, text from comments and transcripts, etc.), exploring other options for the NLP model, and further fine-tuning our procedure for picking the political subreddits.
We demonstrate the substantive value of calculating ideology at the video level by illustrating the associations between video ideology and user engagement along with fine-grained party and individual-level media diets. We emphasize that these are but two of myriad possible applications of our method. We see our contribution as similar to other estimates of ideology across a variety of domains, ranging from the canonical measure of legislator ideology (Poole and Rosenthal Reference Poole and Rosenthal1985) to estimates of public ideology based on campaign contributions (Bonica Reference Bonica2014) to measures of similar quantities of interest online (Barberá Reference Barberá2015). Each of these has facilitated important contributions to our understanding of ideology, polarization, and their consequences for political discourse, behavior, and policy. We believe our contribution paves similar roads for future work that recognizes the crucial and growing importance of video as information, mapped onto the largest home for such content on the internet.
Acknowledgments
This work was supported in part through the NYU IT High Performance Computing resources, services, and staff expertise. M.B. and A.L. designed the original method. M.B. conducted the data collection and J.B. contributed to the validation of the method. A.L. expanded on, validated, and refined the method in addition to conducting the analysis for the applications. A.L., M.B., and J.B. prepared the initial drafts. A.L. led the revision process and prepared the replication materials. J.T., J.N., and R.B. oversaw the infrastructure that supported the project. All authors contributed to revision of the manuscript.
Supplementary Material
For supplementary material accompanying this paper, please visit https://doi.org/10.1017/pan.2023.42.
Data Availability Statement
Replication code for this article is available in Lai et al. (Reference Lai, Brown, Bisbee, Tucker, Nagler and Bonneau2023) at https://doi.org/10.7910/DVN/WZZFTW.
Funding
We gratefully acknowledge that the Center for Social Media and Politics at New York University is supported by funding from the John S. and James L. Knight Foundation, the Charles Koch Foundation, Craig Newmark Philanthropies, the William and Flora Hewlett Foundation, the Siegel Family Endowment, and the Bill and Melinda Gates Foundation.


 Open access