


A party label might be relevant to voters because it works as a heuristic that provides a proxy for a candidate's policy positions (e.g. Fiorina, Reference Fiorina2002), or because citizens have an affective attachment to a party that is not simply a function of the party's positions (e.g. Campbell et al., Reference Campbell, Converse, Miller and Stokes1960). Similarly, a candidate's policy positions might be relevant to voters because they care about those positions as such, or because they act as heuristics for whether the candidate ought to be the subject of the voter's group-based attachment to a party. One of the major divides in interpreting the evidence on the role of partisanship on voting has been between viewing party preference as a summary evaluation of the party's bundle of policy positions and/or past performance versus as an independent driving force of vote choice on its own. Fowler (Reference Fowler2020) articulates this debate in terms of a vote motivated by policy versus by “partisan intoxication”: voters supporting candidates according to policy preferences and beliefs about government performance versus voters “blindly support that party in elections, regardless of the candidates’ policy positions” (p.142). While these are fundamentally different views about what voters actually care about, they have proven to be surprisingly difficult to disentangle empirically. While this paper does not attempt to adjudicate this long-running debate, it seeks to further our understanding of the way these elements may interact.
One reason that these perspectives are difficult to distinguish between is that they need not be exhaustive or mutually exclusive. For example, it is easy to imagine that individual voters have some policy concerns, but can also get caught up in a desire for their “team” to win in a way that means they are not precisely tracking their policy and performance interests in election outcomes, even as they themselves understand them. Another reason that these perspectives are difficult to distinguish is that there may be variation across different groups of voters in the degree to which each theoretical perspective captures individual behavior. But perhaps the most important reason that these perspectives are difficult to disentangle is that they make largely similar predications about voter choice in typical political circumstances, despite their apparently different implications for democratic accountability and underlying accounts of what citizens actually care about when making political choices.
Normal political conflict does not put these perspectives in conflict with one another, and where it does, it does so in ways that make distinguishing between the perspectives difficult. Most candidates take positions aligned with their party. Where they do not, their deviations are potentially endogenous to variation in the preferences of the voters they face and their competitors. Studies that rely on observational data cannot rule out candidate and candidate position selection mechanisms that might provide alternative explanations for the relationship between candidate policy positions, party affiliations, and citizens’ attitudes on policy and party (examples of such studies are Campbell et al. (Reference Campbell, Converse, Miller and Stokes1960); Vivyan and Wagner (Reference Vivyan and Wagner2012); Ansolabehere and Jones (Reference Ansolabehere and Jones2010); Canes-Wrone et al. (Reference Canes-Wrone, Brady and Cogan2002)).
Recent work has attempted to address these limitations by using conjoint experiments to independently vary the presence and/or identity of party labels along with various policy positions and other attributes of candidates (e.g. Kirkland and Coppock, Reference Kirkland and Coppock2018; Mummolo et al., Reference Mummolo, Peterson and Westwood2019; Fowler, Reference Fowler2020). However, these experiments heavily trade off external validity for gains in internal validity, using fully independent randomization of candidates’ attributes that generate unrealistic frequencies and combinations of candidates’ attributes and party affiliation. In the real world, candidates within a party have varying positions, whether due to natural variation in positions among co-partisans or due to strategic public positioning given varying electoral contexts, but typically this variation is constrained by the range of acceptable positions within their party (e.g. Snyder and Ting, Reference Snyder and Ting2003). While it is interesting to test the limits of partisan vote when candidates deviate completely from party platforms, this risks a situation where respondents are not responsive to the party label, not because they care more about policy, but because they stop taking the party label seriously as they know that no one from that party would actually hold the presented positions. Furthermore, in candidate experiment testing the limits of partisan loyalty, Mummolo et al. (Reference Mummolo, Peterson and Westwood2019) show how respondents’ preferences can be markedly different for hypothetical Republican and Democrat candidates when these hold realistic policy positions to when the experiment includes candidates with positions that deviate from those expectations.
Even with this kind of setup, manipulating policy and identity positions in an experimental setting is highly challenging. As Orr et al. (Reference Orr, Fowler and Huber2023) argue, respondents might use given information on policy or identity to infer the other. Information on the partisan affiliation of fellow citizens might influence beliefs about policy positions, and information about policy positions might influence beliefs about candidate party affiliation. Similarly, Titelman and Lauderdale (Reference Titelman and Lauderdale2021) show that when provided with realistic information on fellow citizens’ demographics respondents can, on average, infer the party affiliation of these citizens. Carlson and Hill (Reference Carlson and Hill2022) arrive to a similar conclusions when including information of both demographics and policy positions. The fact that no list of presented policy positions or demographic characteristics is going to be exhaustive of the issues that respondents care about presents a further complication. Even if respondents care only about policy or demographic characteristics, they might appear to care about party labels because these stand in for all the other issues that are not being presented as part of an experiment, yielding a policy-based explanation for response variation driven by party label.
In light of these many challenges, this paper does not attempt to adjudicate the long-running debate about the correct causal model of voting, and instead attempts to describe the relative importance of party labels and policy preferences in a context where these policy positions are benchmarked to the real joint distribution of these positions in the candidates of the two main parties. This study provides a valuable combination of substantially more credible causal inferences than observational designs plus better external validity (De la Cuesta et al., Reference De la Cuesta, Egami and Imai2019) than other similar experimental designs. All laboratory experiments, such as this one, suffer from risks to their external validity due to their artificial nature. Nonetheless, previous research has in fact shown (Hainmueller et al., Reference Hainmueller, Hangartner and Yamamoto2015; De la Cuesta et al., Reference De la Cuesta, Egami and Imai2019) that better, more realistic designs of these experiments can improve their external validity.
However, it does not seek to provide a measure of the relative importance of identified causal inferences regarding party versus policy trade-offs (e.g. Orr et al., Reference Orr, Fowler and Huber2023). We design a novel experimental strategy which (A) randomizes the presence versus absence of party labels and (B) randomizes the profiles of positions and characteristics of candidates for each party. The candidate positions and characteristics are not independent of one another, or of the party of the candidate, but rather are benchmarked to the real distributions of positions and characteristics of candidates of the party at the 2017 British general election. The presence versus absence of party labels is, however, independent of the candidate positions and characteristics, so we can observe the relative association of each candidate and characteristic with vote choice with versus without an explicit party label. Using data on past vote choice, we compare how consistent respondents are in terms of their previous vote and the choice they make in the experiment. Using data on past positions expressed by our respondents and their demographic characteristics, we can also assess how much the proximity of candidates to the respondents’ own positions and characteristics predict their vote choices, with and without party labels.
In our experiment fielded in the UK in October 2021, we find that “correct voting”, in either the Lau and Redlawsk (Reference Lau and Redlawsk1997) sense of matching one's own political positions or in the sense of matching past individual vote, is reasonably high in the condition where respondents do not observe party labels. The presence of party labels does further increase the match between past vote and vote in the experiment. The partial associations of candidates’ positions matching a respondent's positions for vote choice declines in the presence of party labels, but do not entirely disappear. At the moment our experiment was completed we find an asymmetric relationship between policy and partisanship. Labour voters in the 2019 general election are found to consistently choose Labour candidates in our experiments both with and without party labels. Conservative voters in the 2019 general election, on the other hand, are found to be less consistent in their vote for Conservative candidates in our experiment, especially in the absence of party labels. We discuss possible interpretations of this asymmetry, relating to the political moment of the survey as well as policy sorting. We conclude the paper by noting that the results of this experiment do not “answer” the long-running debate about the role of party labels and partisanship in vote choice, however they do put some constraints on how the two archetypal theoretical views can each explain observed patterns of vote choices.
1. Vote choice, policy preferences, and partisanship
Voters may prefer candidates from certain parties because they feel an affective or identity attachment to the parties (Campbell et al., Reference Campbell, Converse, Miller and Stokes1960; Green et al., Reference Green, Palmquist and Schickler2004) or because parties work as cues, aiding in complex decisions on policy platform preferences and past performance (Fiorina, Reference Fiorina1981, Reference Fiorina2002). Fowler (Reference Fowler2020) articulates this debate in terms of a “partisan intoxication” vote versus a vote motivated by policy. Party intoxication would be an explanation for vote choice where voters “blindly support that party in elections, regardless of the candidates’ policy positions” (p.142). In other words, in its strongest form, the affective or identity attachment perspective on voting implies candidate choice might take place even without policy considerations. As Mason (Reference Mason2018) affirms, this view would imply that “citizens do not choose which party to support based on policy opinion” (p.20). Of course these two explanations for vote choice need not be exhaustive or mutually exclusive (Fowler, Reference Fowler2020; Rogers, Reference Rogers2020).
Regardless of which perspective one takes, citizens’ propensity to vote in a partisan manner is not limitless and generally loyal voters might defect because the candidates they have to choose from in particular elections take on different issue or positions (Boudreau and MacKenzie, Reference Boudreau and MacKenzie2014; Mummolo et al., Reference Mummolo, Peterson and Westwood2019) or for other reasons. For example, there is evidence in the US that vote choice is somewhat responsive to legislators’ voting records, at least under some circumstances (Canes-Wrone et al., Reference Canes-Wrone, Brady and Cogan2002; Ansolabehere and Jones, Reference Ansolabehere and Jones2010; Nyhan et al., Reference Nyhan, McGhee, Sides, Masket and Greene2012). Less has been written on any specific country outside of the US. The studies available for the UK find that candidates’ issue and policy positions matter very little relative to party for vote choice (e.g. Butler and Stokes, Reference Butler and Stokes1969a; Vivyan and Wagner, Reference Vivyan and Wagner2012; Hanretty et al., Reference Hanretty, Mellon and English2021).
Even with policy voting, party labels can still be very influential for vote choice as they implicitly provide a summary of the policy positions of candidates (Fiorina, Reference Fiorina1981). This is a key reason that the affective/identity model and the heuristic/policy summary models of partisanship are difficult to disentangle empirically. The same electoral behavior, i.e. voting consistently for a party, can result either from blindly following a party regardless of what it does or proposes to do, or from rationally supporting the party that consistently provides the best match to your preferred bundle of policies weighted according to your personal priorities. As Fowler (Reference Fowler2020) explains “[d]istinguishing between partisan intoxication and policy voting is difficult because the positions of voters and parties on important issue change infrequently” (p.156).
If we want to measure the relevance of candidates’ attributes in the presence of party labels, another difficulty is that observational data is subject to selection bias regarding the characteristics of the candidates who choose to run in different constituencies. For example, Snyder and Ting (Reference Snyder and Ting2003) describe how party positioning and individual candidates’ positions may interact. Candidates may only move across a limited interval of positions that are consistent with being a member of their party. The chosen position depends on the preferences of the districts’ populations and their own, and so their (expected) electoral performance in real elections may be a cause of, as well as an effect of, the positions they take on relative to those of their co-partisans.
Some observational studies focus on formally non-partisan matches to determine the relative importance of party affiliation and candidates’ characteristics. These studies find that contests where candidates are forced not to reveal a partisan affiliation do show a smaller degree of partisan alignment with the vote choice among the electorate, even where the partisanship of candidates can be identified by researchers (e.g. Schaffner et al., Reference Schaffner, Streb and Wright2001; Lim and Snyder Jr, Reference Lim and Snyder2015) and a greater importance of the candidates’ attributes (e.g. Badas and Stauffer, Reference Badas and Stauffer2019). However, in elections where party labels are omitted because of regulations another difficulty arises: voters might infer the party affiliation of candidates even in the absence of explicit party labels. For example, Lucas (Reference Lucas2020) shows that municipal governments are responsive to the ideological preferences of their constituencies in Canada, even though elections are formally non-partisan. The fact that voters might act in ways that appear to be policy-based in non-partisan elections could potentially arise even if voters were purely party motivated, as they use policy positions as cues to infer the true partisan alignment of the candidates rather than because they care about the policy as such.
Some, but not all, of these issues can be addressed using experimental designs, where candidate positions and party affiliations can be randomized. Recent experiments have enabled researchers to test a number of hypotheses which follow from the different theoretical models of the relationship between party and voting. For example, Fowler (Reference Fowler2020) reanalyses data from Hainmueller et al. (Reference Hainmueller, Hopkins and Yamamoto2014) conjoint experiment for candidates in the US. He theorizes that in the presence of policy voting, including more information on candidates would reduce the effect of party labels. He finds that “the presence of additional, randomly assigned information about candidates is enough to induce most respondents to deviate from their party some of the time” (p.166).
At the same time, experiments have shown that, in the presence of party labels, candidate characteristics such as gender or ethnicity, become less relevant (Rahn, Reference Rahn1993; Lavine et al., Reference Lavine, Johnston and Steenbergen2012; Burnett and Tiede, Reference Burnett and Tiede2015; Kirkland and Coppock, Reference Kirkland and Coppock2018). Conversely, in the absence of party labels, candidates’ attributes may become more relevant. For example, Kirkland and Coppock (Reference Kirkland and Coppock2018) find that when choosing a candidate in competitions with no party labels, Republican voters give more importance to job experience, while Democrat voters assign more importance to political experience. However, these studies are not exempt from the risk that respondents infer partisan affiliations, even in the absence of such labels. For example, Kirkland and Coppock (Reference Kirkland and Coppock2018) present experimental evidence that voters exhibit preference for local candidates that signal partisan or ideological affiliation without using labels. As Fowler (Reference Fowler2020) points out “[b]ecause respondents will make inferences about many thing in response to a given piece of information, survey experiments may never allow us to definitively demonstrate or rule out partisan intoxication” (p.164). Even so, while adjudicating which theoretical model of political behavior is a closer match to reality is difficult, such experiments give us new evidence about how voters respond to variations in their political choices that is useful for making progress on our understanding of voters’ behavior.
2. Candidate choice in the UK
The relevance of candidates’ positions has been studied less for the UK than for the US. In part, this is the result of a strong tradition of viewing the vote as divided between class lines, with working-class citizens voting for Labour and middle-class citizens for the Conservatives (e.g. Butler and Stokes, Reference Butler and Stokes1969b, Reference Butler and Stokes1974). Even vote choice theories less reliant on social and party identity have tended to give little attention to the individual positions of candidates, emphasizing the roles of party manifestos and leaders (Clarke et al., Reference Clarke, Sanders, Stewart and Whiteley2004). Strong party discipline in the House of Commons means that individual MP deviations from the party line are rarely visible, and even when they are visible, voters seem to pay little attention. For example, Vivyan and Wagner (Reference Vivyan and Wagner2012) find that only voters with negative views of party leadership reward MPs for rebelling and that this gain is small. Similarly, Hanretty et al. (Reference Hanretty, Mellon and English2021) find that even on Brexit, the highest profile cross-cutting issue in British politics in a generation, MPs in the UK were negligibly accountable (in terms of electoral support) for their issue positions and that they were aware of this, implying little incentive to take into account the constituencies’ positions on issues more generally. The Hanretty et al. (Reference Hanretty, Mellon and English2021) paper is really the best case for a clean observational case and there is still not much evidence of issue voting.
Despite this history, we could imagine that candidates’ positions might become relevant in the current political environment in the UK. There has been a process of class and partisan dealignment (Särlvik et al., Reference Särlvik, Crewe and MacDermid1983), which, as Surridge (Reference Surridge2020) has pointed out, “gave more ‘space’ for short-term influences on vote choice” (p.5). Following the “funnel of causality” for vote choice, as defined by Campbell et al. (Reference Campbell, Converse, Miller and Stokes1960), these short-term influences include issue opinions and candidate image. In the original model of the “funnel of causality”, party attachment mediates between value orientations and both issue opinions and candidate image. Without this attachment, other elements may become more relevant. The last decade has seen an unprecedented level of weakening of party attachment in Britain, reflected in the fact that only half of the electorate voted for the same party in all three elections in 2010, 2015, and 2017 (Fieldhouse et al., Reference Fieldhouse, Green, Evans, Mellon, Prosser, Schmitt and Van der Eijk2021). At the same time, party discipline in the House of Commons has weakened for relevant legislation (Kam, Reference Kam2009; Cowley and Stuart, Reference Cowley and Stuart2012; Kirkland and Slapin, Reference Kirkland and Slapin2018), such as the Brexit Withdrawal Agreement (Aidt et al., Reference Aidt, Grey and Savu2021), potentially raising the stakes of which kind of candidate is elected, beyond just their party affiliation.
The EU referendum and the Brexit debate have brought an important level of realignment with “Leaver” and “Remainer” identities playing a role that may be as important as traditional party identities (Hobolt et al., Reference Hobolt, Leeper and Tilley2020). This might reinforce the relevance of candidates’ positions on Brexit, and push voters in directions different from a simple party vote. In the 2019 general election Brexit was a defining issue for many voters and this was partly the result of shifts in voter behavior which come from longer-term trends, that reflect “the growing importance of value divides in the electorate” (Ford et al., Reference Ford, Bale, Jennings and Surridge2021, p.541). Specifically, voters with more socially conservative views have swung behind the Conservatives (e.g. Surridge, Reference Surridge2020).
Values have often been described as dividing the political spectrum in two axes. The left–right axis, linked to traditional economic positions, and the social values axis, linked to positions on authoritarianism and liberalism (Lipset, Reference Lipset1959). While the party divide and its class counterpart are typically summarized in the left–right spectrum, the Brexit vote is mainly explained by the authoritarian-liberal axis (e.g. Zmigrod et al., Reference Zmigrod, Rentfrow and Robbins2018; Norris and Inglehart, Reference Norris and Inglehart2019; Crewe, Reference Crewe2020). How relevant are signals given by the candidates on these value scales? Do they matter less when party affiliation is known?
3. Data and methods
To test the way party signaling affects vote choice, in the context of candidates with realistic attributes and positions, we first create a data set of candidate profiles. For this we combine information from the Representative Audit of Britain (RAB) (Campbell et al., Reference Campbell, Hudson and Rüdig2017), and the British Elections Study (BES) to create a data set of nationally representative profiles for both Labour and Conservative candidates in the 2017 general elections. The BES includes complete information on candidates’ gender by party and constituency, as well as whether the candidate was elected (632 Labour and 632 Conservative candidates). The RAB includes information from a subset of candidates (385 Labour and 148 Conservative candidates) on their positions for several policy related questions, as well as information on their past participation in local councils, the EU referendum vote, left right positions, and many other characteristics. This information was combined and missing values were imputed using multivariate imputation by chained equations (MICE). This was done using random forest imputation for continuous data and predictive mean matching for all other kinds of data. The imputation was carried out for Labour and Conservative candidates separately to ensure that the distribution of characteristics within each party conserves the party-specific correlations between the different variables. For the imputations, whether a candidate was successful or not was also included as a variable. This procedure yields a model for generating synthetic candidate profiles from the “population distribution” of hypothetical candidates, with joint distributions of personal characteristics and responses to the RAB questions that matched the known features of the distributions of Labour and Conservative candidates.
We present respondents with two randomly selected candidates from these simulated candidate population distributions characterized by their gender, age, left–right positioning, EU referendum vote, experience in local council, whether the candidate was born in the constituency, and positions over four broad policy issues. We then ask respondents to choose which of the two profiles they would vote for. One candidate is drawn from the model for Labour candidates and the other one from the model for Conservative candidates. We independently randomize whether each respondent sees party labels or not.
Examples of the task with and without party labels can be seen in Figure 1. The order of the characteristics was randomized within three blocks. The first block consisted of the candidate's age and sex. The second block consisted of whether the candidate is from the constituency he/she is running for, whether the candidate has experience in local council, their position on the left–right spectrum, and their vote in the 2016 EU referendum. Finally, the third block consisted of the candidates’ positions on four broad policy issues: spending cuts to local services, measures to protect the environment, redistribution of income, and the economic effects of immigration. We also randomize which candidate (Labour and Conservative) is visually on the left and on the right.
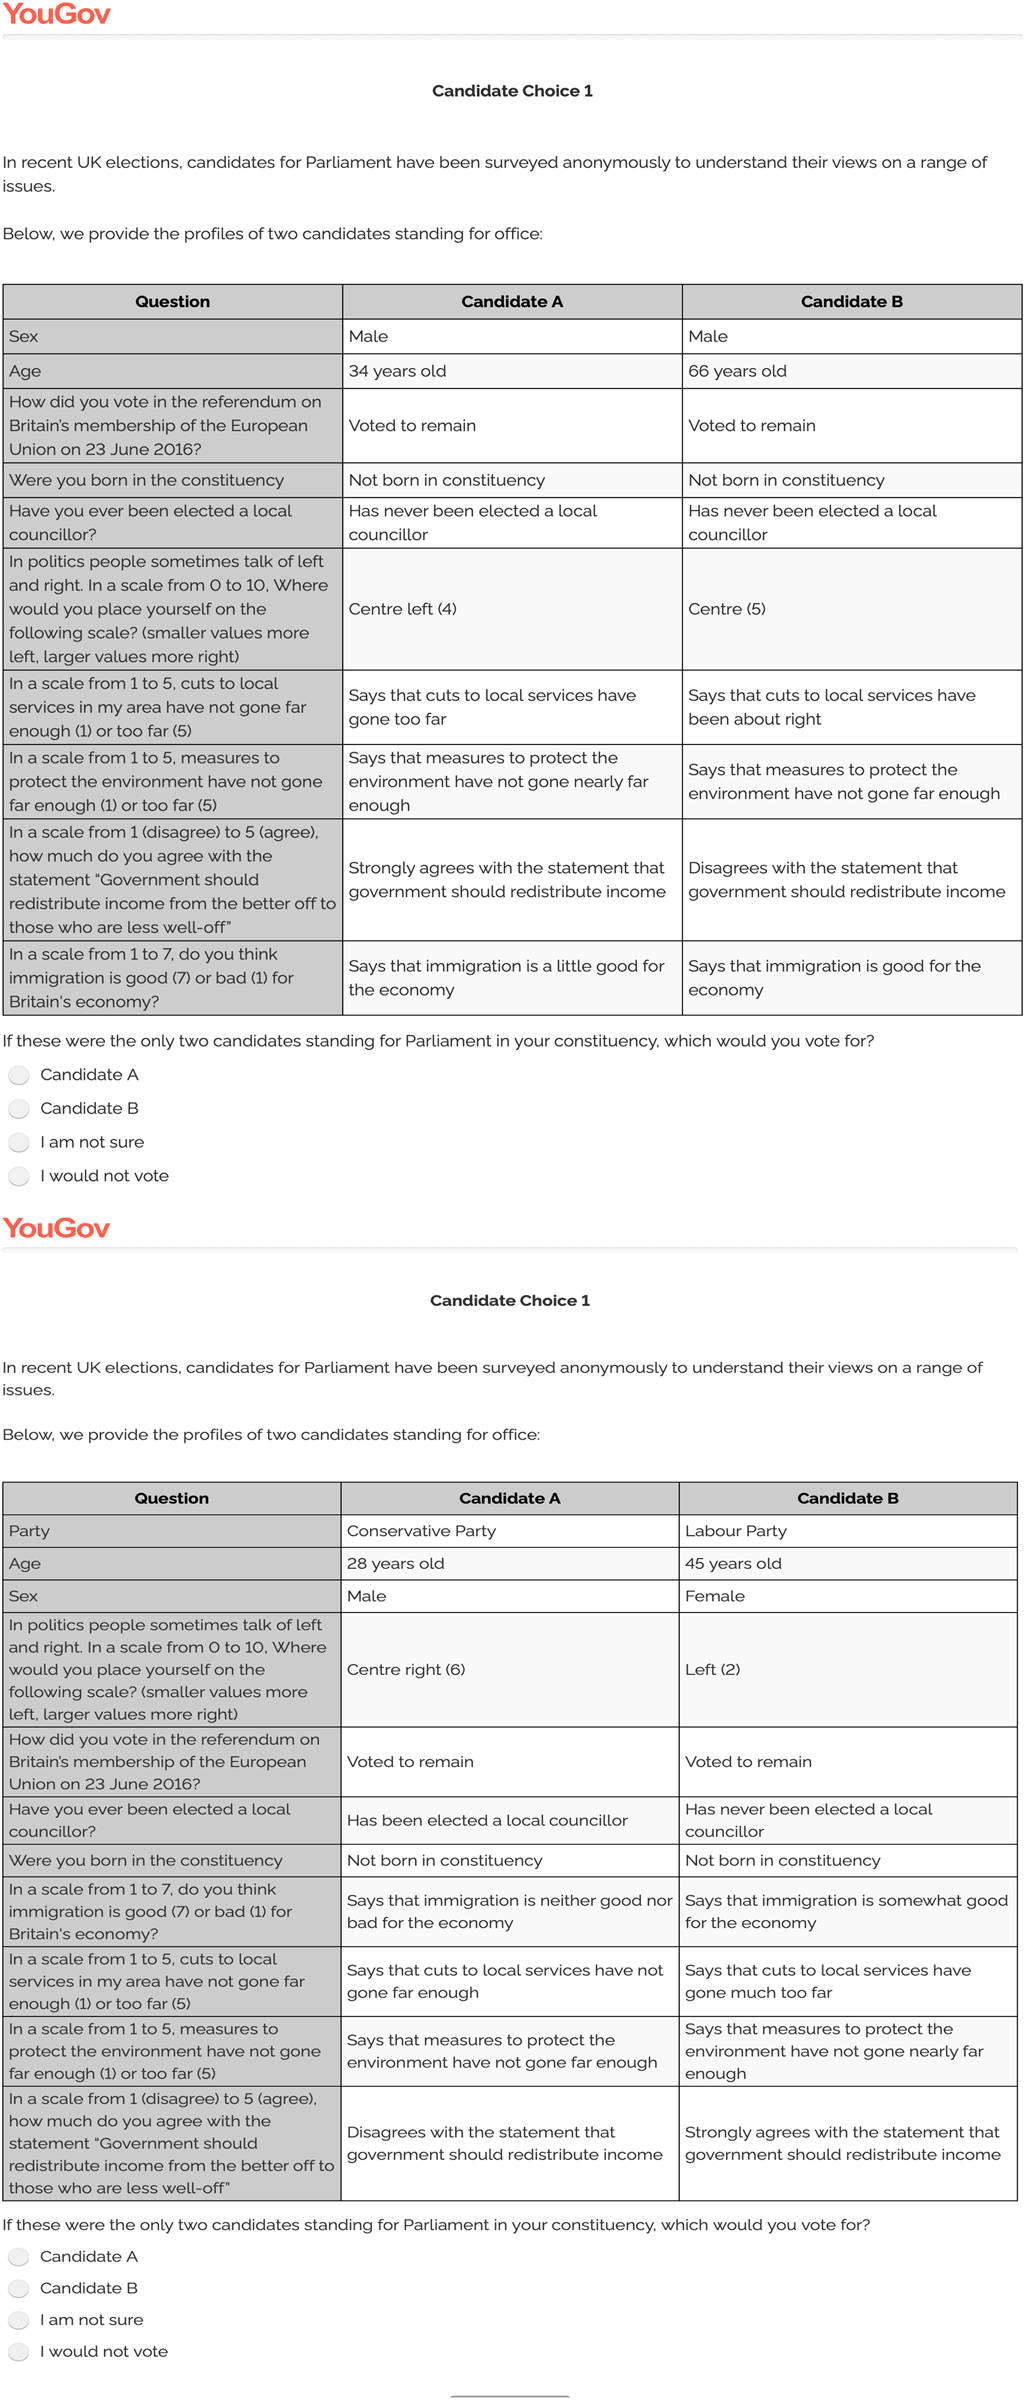
Figure 1. Survey prompts for experiment with example profiles. Without party labels (top) and with party labels (bottom).
This method is closely related to traditional conjoint experiments; however, instead of a distribution where profile attributes are independently randomized, we have randomly selected complete profiles following their estimated distribution in the population of candidates. An external benchmark for the distribution of conjoint experiments is often used to increase the external validity of these experiments (for examples of its use in political science and a recount on the implications of this method see Bansak et al., Reference Bansak, Hainmueller, Hopkins, Yamamoto, Druckman and Green2020). Often these benchmarks take the simple form of omitting impossible or unlikely combinations of attributes. By construction, the AMCE, the traditional estimate of causal relationship in conjoint experiments, is the result of averaging over the joint distribution of the presented profile (Hainmueller et al., Reference Hainmueller, Hopkins and Yamamoto2014). Therefore, the choice of treatment distribution is not innocuous. Relative to a conjoint experiment with independent randomization of all elements of the candidate profiles, using an external benchmark for the distribution helps with external validity of estimates, but implies we cannot use non-parametric identification of causal effects of individual attributes (AMCEs), introducing model dependence when examining these effects (De la Cuesta et al., Reference De la Cuesta, Egami and Imai2019).
This experiment allows us to estimate some design-based causal estimates and some model-based estimates. We can calculate a design-based estimate of the effect of presenting party labels on respondents’ choice, on average over the distribution of candidate characteristics that we sampled from. The revelation of the party label is assigned randomly and independently of any other attribute, so we can simply compare averages of the two conditions of the experiment (with and without party labels) to estimate the relevant causal effect. Furthermore, these estimates are the result of realistic electoral matches (benchmarked on the distribution of candidates) and therefore conserve the external validity of a realistic treatment distribution of the candidates’ profiles. As Hainmueller et al. (Reference Hainmueller, Hopkins and Yamamoto2014) explain, together with the AMCEs, conjoint experiments allow for the estimation of the average effect of complete profiles. This quantity is “[t]he expected difference in responses for two different sets of profiles” (p.10). This quantity is rarely of interest, because complete profiles are usually not substantively meaningful for conjoint experiments. However, following Hainmueller et al. (Reference Hainmueller, Hopkins and Yamamoto2014), this quantity is relevant if “the treatments correspond to two alternative scenarios that might happen in an actual election” (p.10). This is the case in our experiment because we have benchmarked our treatment in the real distribution of candidates. While we are not interested in the causal effect of any specific profile of a candidate, we are interested in presenting the effect of a realistic set of electoral matches, with and without party labels, on respondents’ choice between draws from the Labour candidate distribution and the Conservative candidate distribution.
The cost of randomizing the attributes at the full profile level, rather than the individual attribute level, is that comparing differences in mean responses for particular attribute levels loses its causal interpretation. These are no longer unbiased estimates of an AMCE because, without independent randomization of attributes, the distribution of other attributes is not the same, conditional on particular levels of any given attribute. We can, nonetheless, form model-based rather than design-based estimates of the causal effects of respondents seeing particular attribute levels, through the use of regression. We can assess the causal effects of different attributes appearing in the treatment candidates, subject to modeling assumptions about how the effects of different attributes aggregate and heterogeneity in the population. For the purposes of this experiment, it makes sense to sacrifice having simple experimental comparisons for all attributes in exchange for having a meaningful external benchmark. The random selection of candidate profiles still rules out familiar risks to causal inference that exist in regression analyses of observational data that would induce selection bias, such as the various candidate selection and positioning mechanisms by which candidates observed and unobserved characteristics adapt to a specific constituency.
The survey was fielded by YouGov in October 2021. Each respondent faced five iterations of the experiment with the same party visibility condition. There were 808 respondents in the experimental condition with visible party affiliation and 828 without visible party affiliation. The respondents came from the British Elections Study online panel, which means that the information on respondents (demographic characteristics, issue positions, and past votes) were obtained months or years before the experiment was implemented.
For purposes of data analysis, the choice of the respondent for task i, the outcome of interest, c i, is coded with 1 indicating that the respondent chose Candidate A, −1 indicating that the respondent chose Candidate B, and 0 that the person chose “not sure” or “would not vote”. Candidate A is the candidate presented on the left, candidate B is the candidate presented on the right, and whether the Labour or the Conservative candidates is on the left or on the right is randomized for each candidate choice with equal probability.
The specifications of the explanatory variables are designed to measure both an average effect of candidate attributes and an effect that relates covariation of the candidate's attributes and of the respondent's own attributes. The average effect is captured by a variable, f ij = x ijA − x ijB, which reflects the difference between candidate A and candidate B on attribute j for task i. So, for example, if there is a general, average preference among respondents for a given characteristic, this specification ensures that this leads to a preference for candidate A when candidate A has that attribute and B does not, and an equal and opposite preference for candidate B when candidate B has that attribute and A does not.
But we are not just interested in which attributes are generally preferred, we are interested in the extent to which respondents chose candidates because those candidates are “closer” to the respondent, compared to the other alternative candidate. Thus, we form two variables, m ijA = |x ijA − x ij| and m ijB = |x ijB − x ijR| that capture the distance from the attribute j of the respondent who completed task i, x ij, to each of the candidates A and B that the respondent saw in that task. The difference between these two distances is then the explanatory variable of interest that enters our model for the candidate choice: d ij = m ijB − m ijA. If, for task i, the two profiles are equally close to the respondent on attribute j, then d ij will be zero. If the distance variable is larger to Candidate A, then d ij will be negative, indicating that the candidate is closer to Candidate B; if the reverse is true, than d ij will be positive. We would expect respondents to prefer more similar candidates, and thus for coefficients on the d ij to be positive.
The reason the data are coded this way is so that relative closeness to A or to B, versus the other, are treated symmetrically. Each coefficient describes the effect of moving closer to the chosen candidate for a single characteristic, holding the other attributes and the other profile constant. Variables where there is not a respondent position, such as candidates’ experience as local councilor and whether the candidate was born in the constituency only enter the model if the f ij form, which means that they are “valence” variables that are assumed to either help or hurt candidate for all respondents. With these variables, the following subsections will examine how predictive f ij and d ij are, for each attribute j in explaining the respondents’ choice (c i) and how this relationship changes with the inclusion and exclusion of party labels.
4. Consistency with past party vote in the 2019 general election
Our experiment allows us to assess how much the provision of party labels increases the consistency of candidate choice in the experiment with past vote choice, in the context of providing a range of realistically distributed information about candidate positions and other attributes. We can do this without detailing the effect each individual attribute had, and, therefore, without requiring modeling assumptions. Figure 2 shows the proportion of respondents that chose each candidate by their vote in the 2019 general election.Footnote 1Footnote 2 The results suggest that, without party labels, 2019 Labour and Conservative voters maintained their 2019 vote choices at different rates. 44.2% of respondents that previously voted for Conservative chose the Conservative profile, in the absence of party label. The remaining 2019 Conservative voters either chose a Labour candidate (17.4%) or the “not sure” and “not vote” options (38.4%). The percentage of 2019 Conservative voters choosing the Conservative candidate in the experiment increases to 58.1% when party labels are given, thanks to fewer 2019 Conservative voters choosing a Labour Candidate (11.2%) and fewer choosing “not sure” and “not vote” options (30.6%).
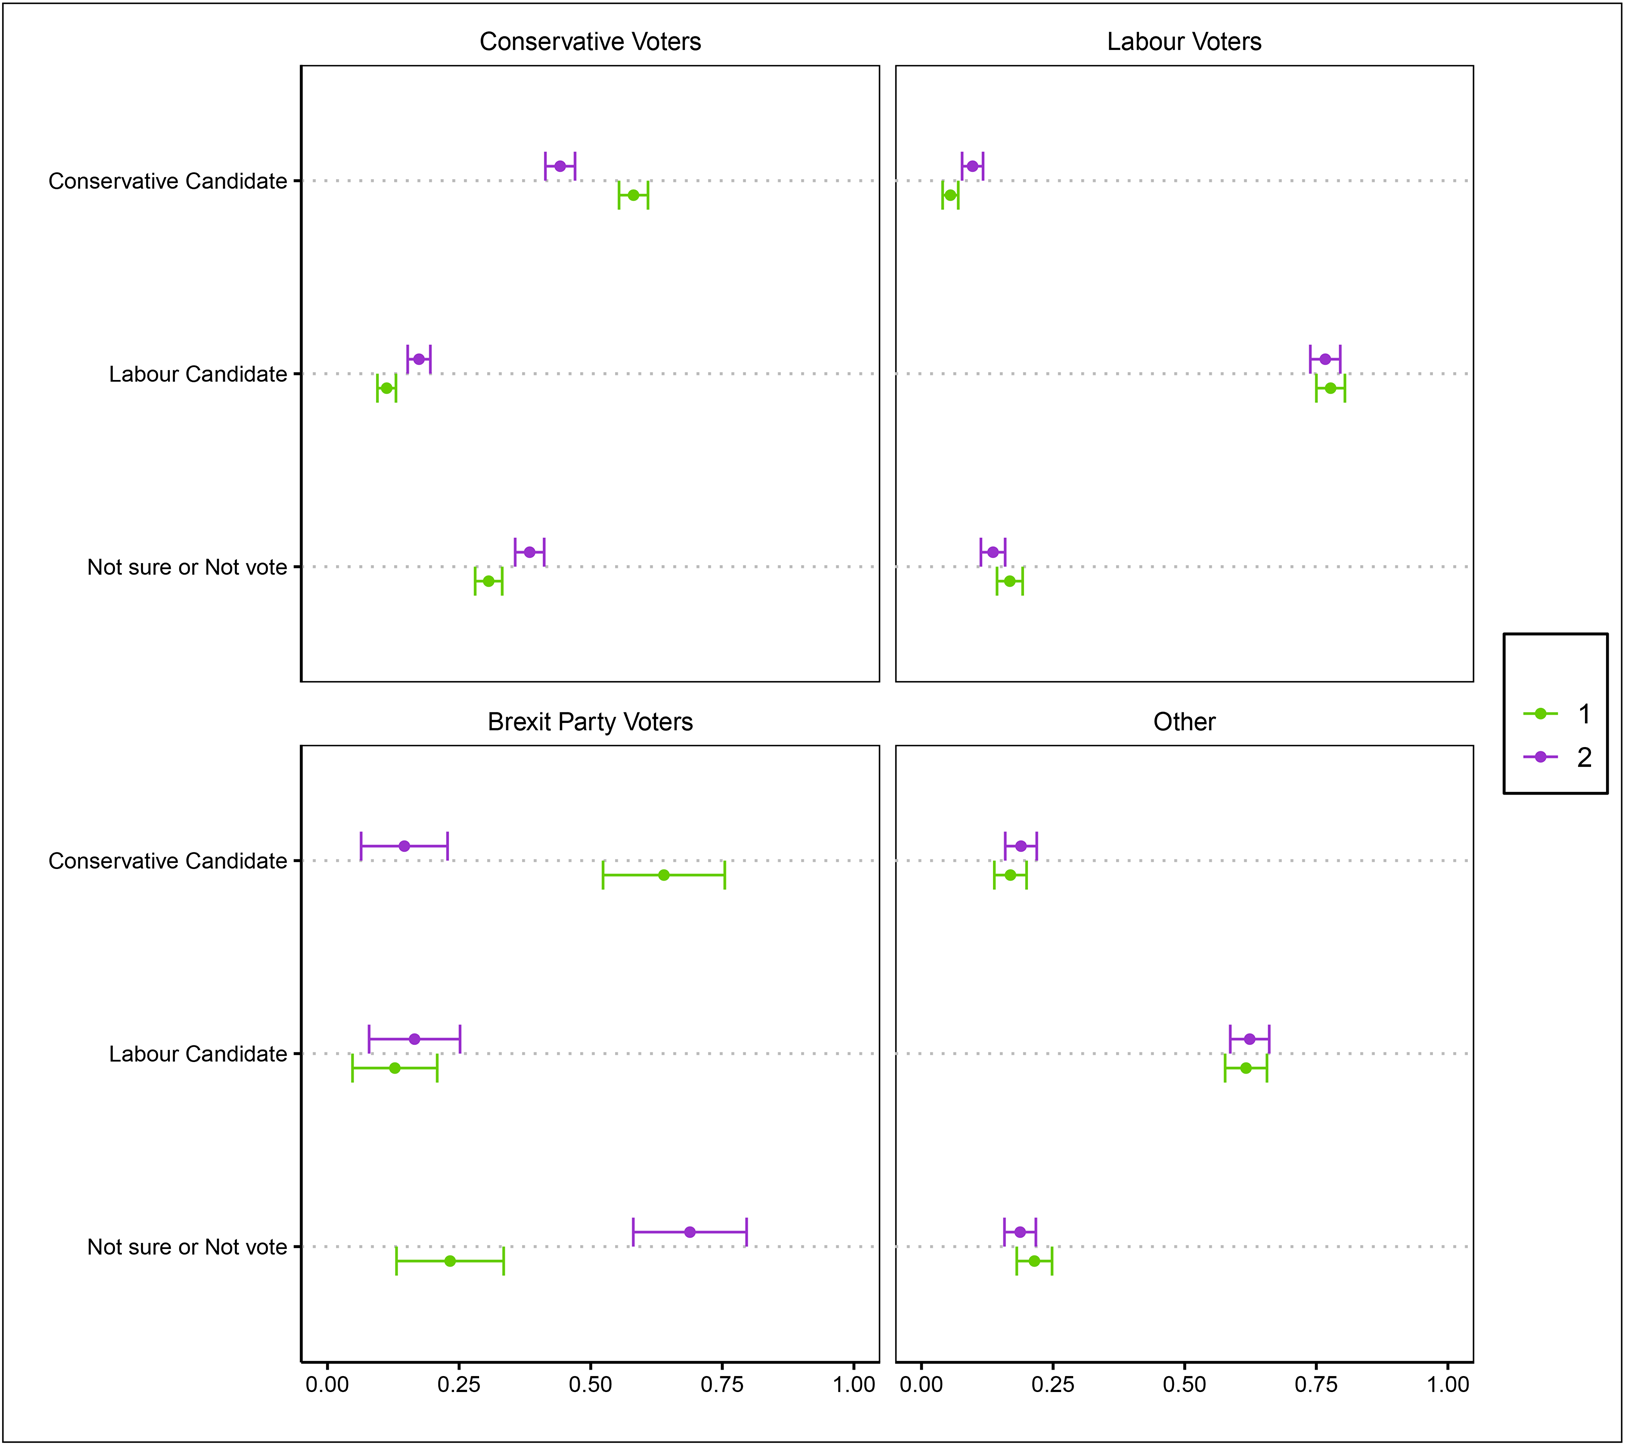
Figure 2. Proportion of respondents that chose each candidate in the experiment by their vote in the 2019 general election. In each graph of the panel, the horizontal axis represents the proportion of respondents that chose either the Conservative candidate, the Labour candidate or the “Not sure” and “Not vote” options. In the top-left graphic, proportions are shown for respondents that voted for the Conservative party in 2019. In the top-right graph, former Labour voters are presented. In the bottom-left graph former Brexit party voters are presented. Finally, in the bottom right graph, we present the proportions for respondents that did not vote for any of the mentioned three parties.
The effect of party labels for choosing a Conservative candidate is especially noticeable for Brexit party voters. When labels were not given, only 14.6% of these respondents chose a Conservative candidate, and 63.9% when party labels were made available. This important difference comes from voters that do not choose any of the candidates when party labels are omitted. This could be because these voters tend to be interested in policies that are not included in the experiment, and are using party affiliation as a proxy of candidates’ positions on these issues, or because these voters tend to much prefer Conservatives to Labour candidates because of the party labels as such. Under either explanation, the very large effect suggests that these voters are less interested in or able to guess candidates’ party affiliation.
By comparison, 76.7% of respondents that voted for Labour in 2019 chose the Labour profile in the absence of party label. The fact that this is much higher than for 2019 Conservatives voting Conservative in our experiment is not necessarily notable, as it reflects a shift in overall support for the parties versus the 2019 election at the time of the experiment. What is more notable is that this percentage is not significantly lower than the 77.7% who chose the Labour profile when party labels are given. Only 9.7% Labour voters chose the Conservative profile when labels where not given, and this proportion decreased to 5.5% when party affiliation of profiles were made explicit. The percentage of past Labour voters that chose either the “not sure” or “not vote” options changed insignificantly from 13.6%, when labels were not given, to 16.8% with party labels.
While Conservative voters were significantly and substantially affected by the presence of party labels, Labour voters were less sensitive to explicit party cues. This might suggest that 2019 Labour voters are more aligned with Labour candidates’ positions and attributes than are 2019 Conservative voters with Conservative candidates, and therefore making party labels explicit has little effect on them. It could also be that the set of candidate positions and attributes provided better captured the reasons why Labour voters vote Labour than the reasons why Conservative voters vote Conservative. It is also possible that Labour voters are better at “guessing” the party affiliation of candidates. These mechanisms could reflect the particular moment of the survey: the fact that the 2019 election saw a relatively strong result for the Conservatives relative to Labour meant that loosely attached, swing voters would have disproportionately voted Conservative in that election. These voters could be less attached to their most recent vote on the basis of their positions, could be selecting parties for reasons beyond the classic differentiating issues between the parties, and/or could be less able to guess party positions than the core vote of either major party.
5. How clear a signal of party do other characteristics provide?
While the causal effect of party label for Conservatives is substantial for an experimental effect, the overall results still imply that most voters’ choices do not change in the party label condition versus the no party label condition. It appears that most respondents are able to identify preferred candidates based on their similarities, and this coincides with party preference. Consequently, including or excluding party labels makes only a small difference. This leads us to ask: how much closer are respondents to the candidate of the party they voted for in 2019, compared to the party they did not vote for? How strong a signal do the other attributes provide?
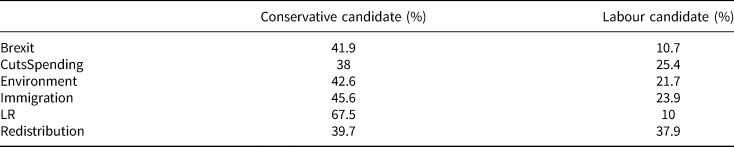
Table 1 shows, for every policy position, the proportion of Conservative voters that was faced with a Conservative candidate closer to their positions and the proportion that was faced with a Labour candidate closer to their positions (the remaining proportion chose between candidates equally distant to their positions). While it is true that, for every policy, the proportion of respondents that was closer to the Conservative candidate was larger, only for positions on the left–right spectrum did this proportion surpass 50%, as many voters are equidistant from the candidates they chose between on particular policies. The position on which 2019 Conservatives voters were closest to Labour candidates was on redistribution, where nearly as many were closer to the Labour candidate (37.9%) as were closer to the Conservative candidate (39.7%).
Table 1. Conservative voters
Similarly, in the case of Labour voters, Table 2 shows that the proportion of respondents closer to Labour candidates also is above 50% for the left–right position. However, in this case Redistribution has an even higher proportion of respondents closer to Labour candidates, with 65%. The position on which 2019 Labour voters differed the most from Labour candidates was on their position on immigration, where slightly more were closer to the Conservative candidate (33.2%) than to the Labour candidate (33.1%).Footnote 3
Table 2. Labour voters
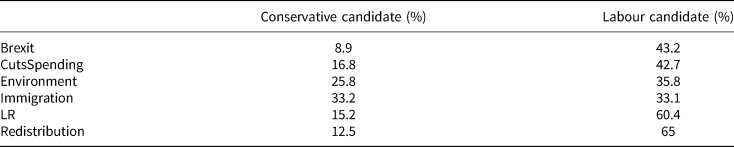
The tables present the proportion of respondents 2019 Conservative (top) and Labour (bottom) past voters whose positions are closer to the Conservative or Labour candidates they saw in each task.
Overall, the left–right self- and candidate-reports discriminate better than any of the other positions for both Labour and Candidate supporters. Figure 3 shows the distribution of Labour and Conservative voters on the left–right spectrum, together with the average position of Labour and Conservative candidates. Overall, voters of each party are concentrated around the average position of their respective candidates. This explains why 60.4% of Labour voters were nearer to Labour candidates, while 67.5% of Conservative voters were nearer to Conservative candidates on this issue.
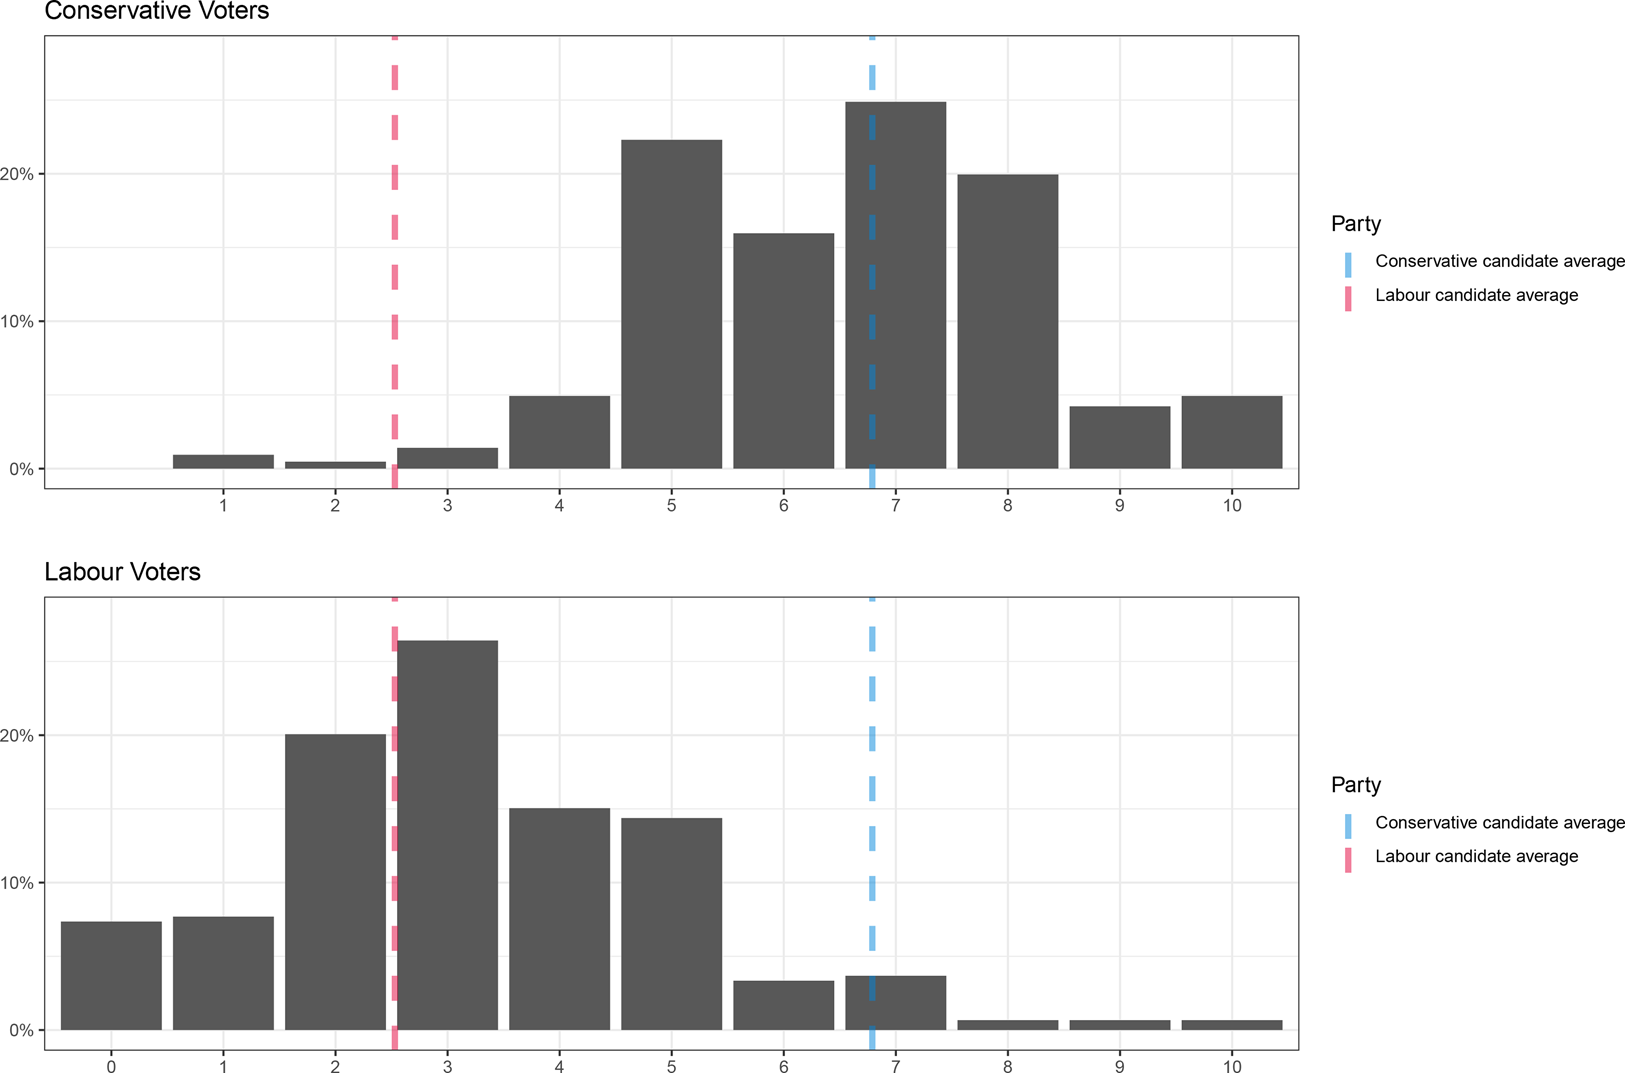
Figure 3. Distribution of Conservative (above) and Labour (below) voters for left–right position, with candidate averages overlaid.
Some policies, such as redistribution in the case of Conservative voters and immigration in the case of Labour voters, might push many respondents towards candidates from the opposing party to their 2019 vote. However, there is clearly a substantial degree of alignment between party and policy issues, especially for left–right positions. Overall, these patterns suggest that the reason party labels have modest effect is due to respondents in the no-label condition getting to the vote they would have had in the labels condition, either by correctly guessing the party based on the provided information or because they primarily care about positions in which they are aligned with the party for which they voted in the past.
6. Candidate attribute effects
To begin our analysis of which combinations of respondent and candidate attributes predict a respondent choosing particular candidates rather than others, we start by examining the relationship between candidate positions and vote choice. In the first version of this analysis we do not directly use respondent's own positions in the analysis, but we split the sample on 2019 vote choice. We fit models predicting candidate choice as a function of candidate positions, in the party labels condition and the no party labels condition, and plot the coefficients in Figure 4. There is remarkably little change in the association between vote choice and candidate characteristics between the party label and no party label conditions. The 2019 Conservative voters become more likely to support candidates opposed to redistribution and in favor of spending cuts (traditional Conservative positions) in the party labels condition than in the no party labels condition, suggesting that the party label is compensating for some of the unpopularity of these positions, however the general picture is one of stability in the relationships between vote choice and candidate characteristics across the two experimental conditions.
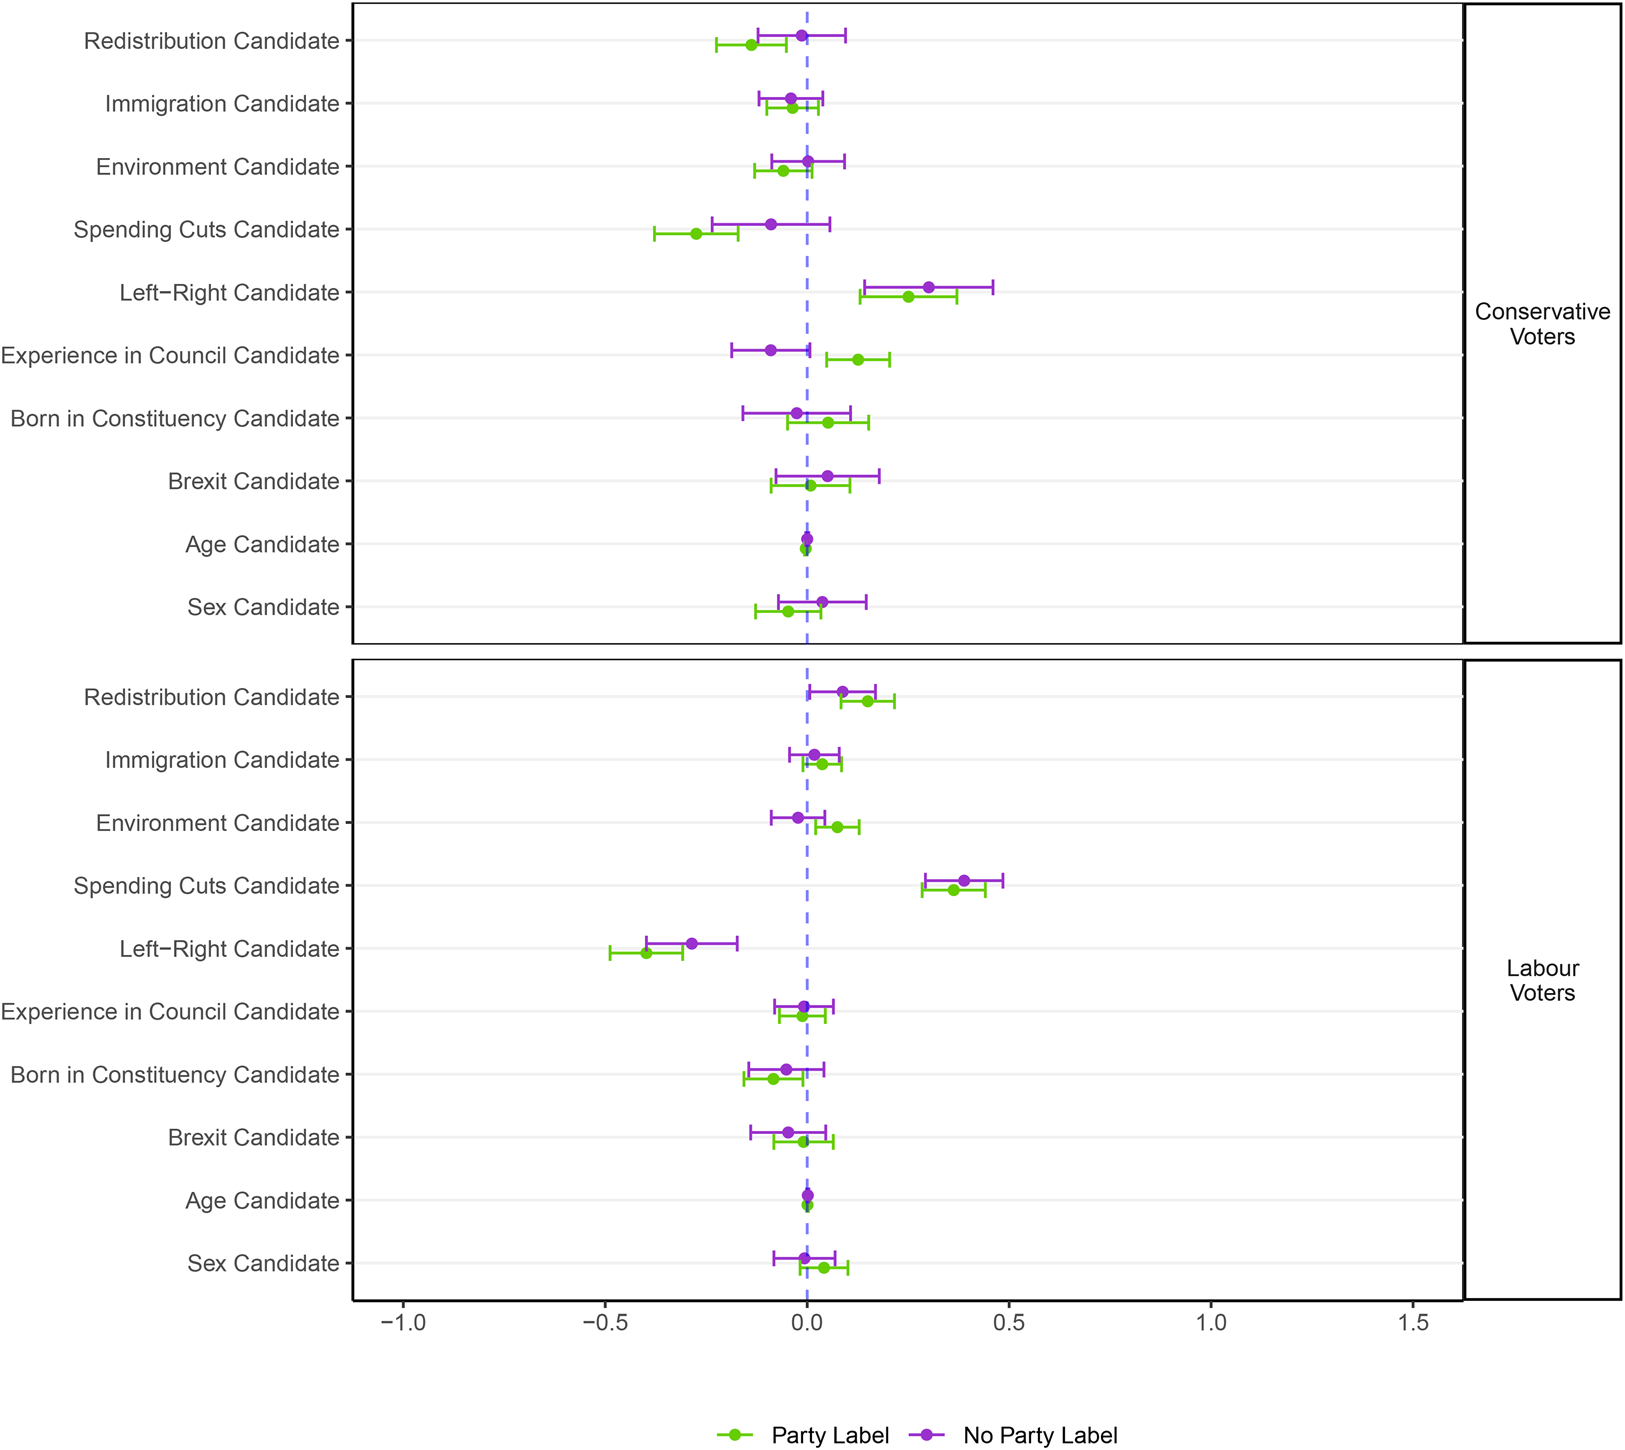
Figure 4. Estimates of regression coefficients for respondents’ choice predicted by candidates’ difference on each attribute or position. Party affiliation of candidates is omitted from model. To facilitate comparisons, the difference in position on redistribution, immigration, environment, and spending cuts, as well as difference son the left–right positions have been scaled so that the mean difference is 0 and the standard deviation is 1.
Next, we add the party affiliation of the candidate as an explanatory variable. We include this variable also in the no-labels condition so as to make both models comparable. The results of such analysis are shown in Figure 5. Whereas several of the candidate position variables are significant in Figure 4, once we control for party affiliation of the candidates this is no longer the case. Notably, candidates’ party affiliation seems to capture most of the predictive effect of candidate positions, even in the condition where we do not show candidates’ party party to respondents. Put differently, within-party variation in candidate positions do not significantly predict variation in candidate choices, even in the condition where respondents are not told which candidate is from which party.
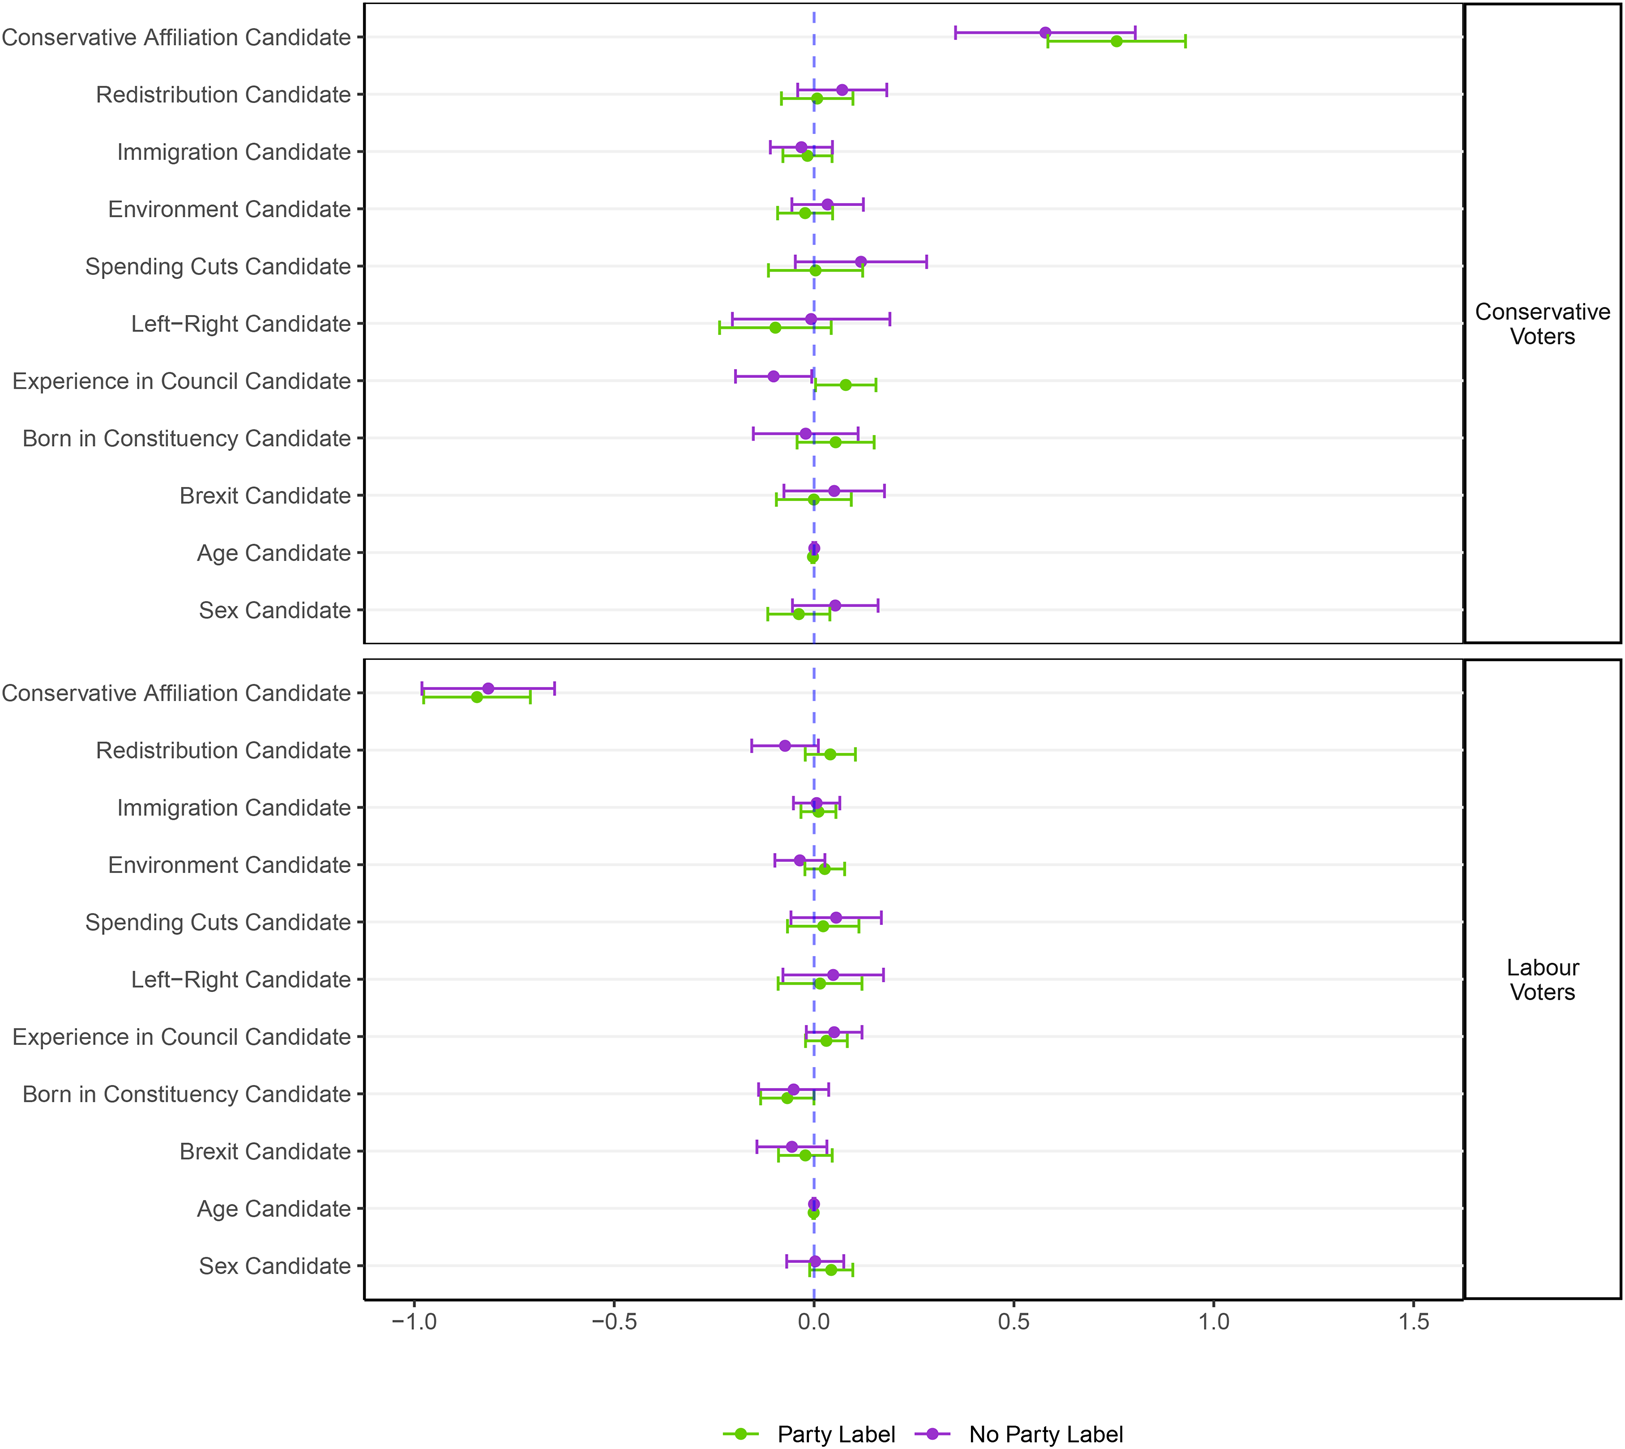
Figure 5. Estimates of regression coefficients for respondents’ choice predicted by candidates’ difference on each attribute or position. To facilitate comparisons, the difference in position on redistribution, immigration, environment, and spending cuts, as well as difference son the left–right positions have been scaled so that the mean difference is 0 and the standard deviation is 1.
Does this mean that candidate positions do not matter? Not necessarily, as the above analysis is on average across 2019 vote groups, and does not include respondents’ own positions. We now present an alternative analysis of the data in Figure 6, where we examine how the proximity of candidates’ positions and characteristics to those of respondents predict the choices of respondents with versus without party labelsFootnote 4. We see that, without party labels, closeness on all issue positions is significant for respondents’ choice (the four broad policies, Brexit, and the left–right positions), while the more descriptive characteristics of candidates are not (to be born in constituency, council experience, age, and sex). Including party labels in this model renders closer positions on immigration, environment, and Brexit non-significant. However, the relative proximity of respondent and candidate positions on the left–right spectrum, redistribution, and spending cuts remain significant. In Figure 7, we fit these models separately for past Labour and Conservative voters and in the two party labels conditions of the experiment. As in Figure 6, we see more significant coefficients of proximity of candidates’ positions and characteristics in the no party labels condition than the party labels condition.
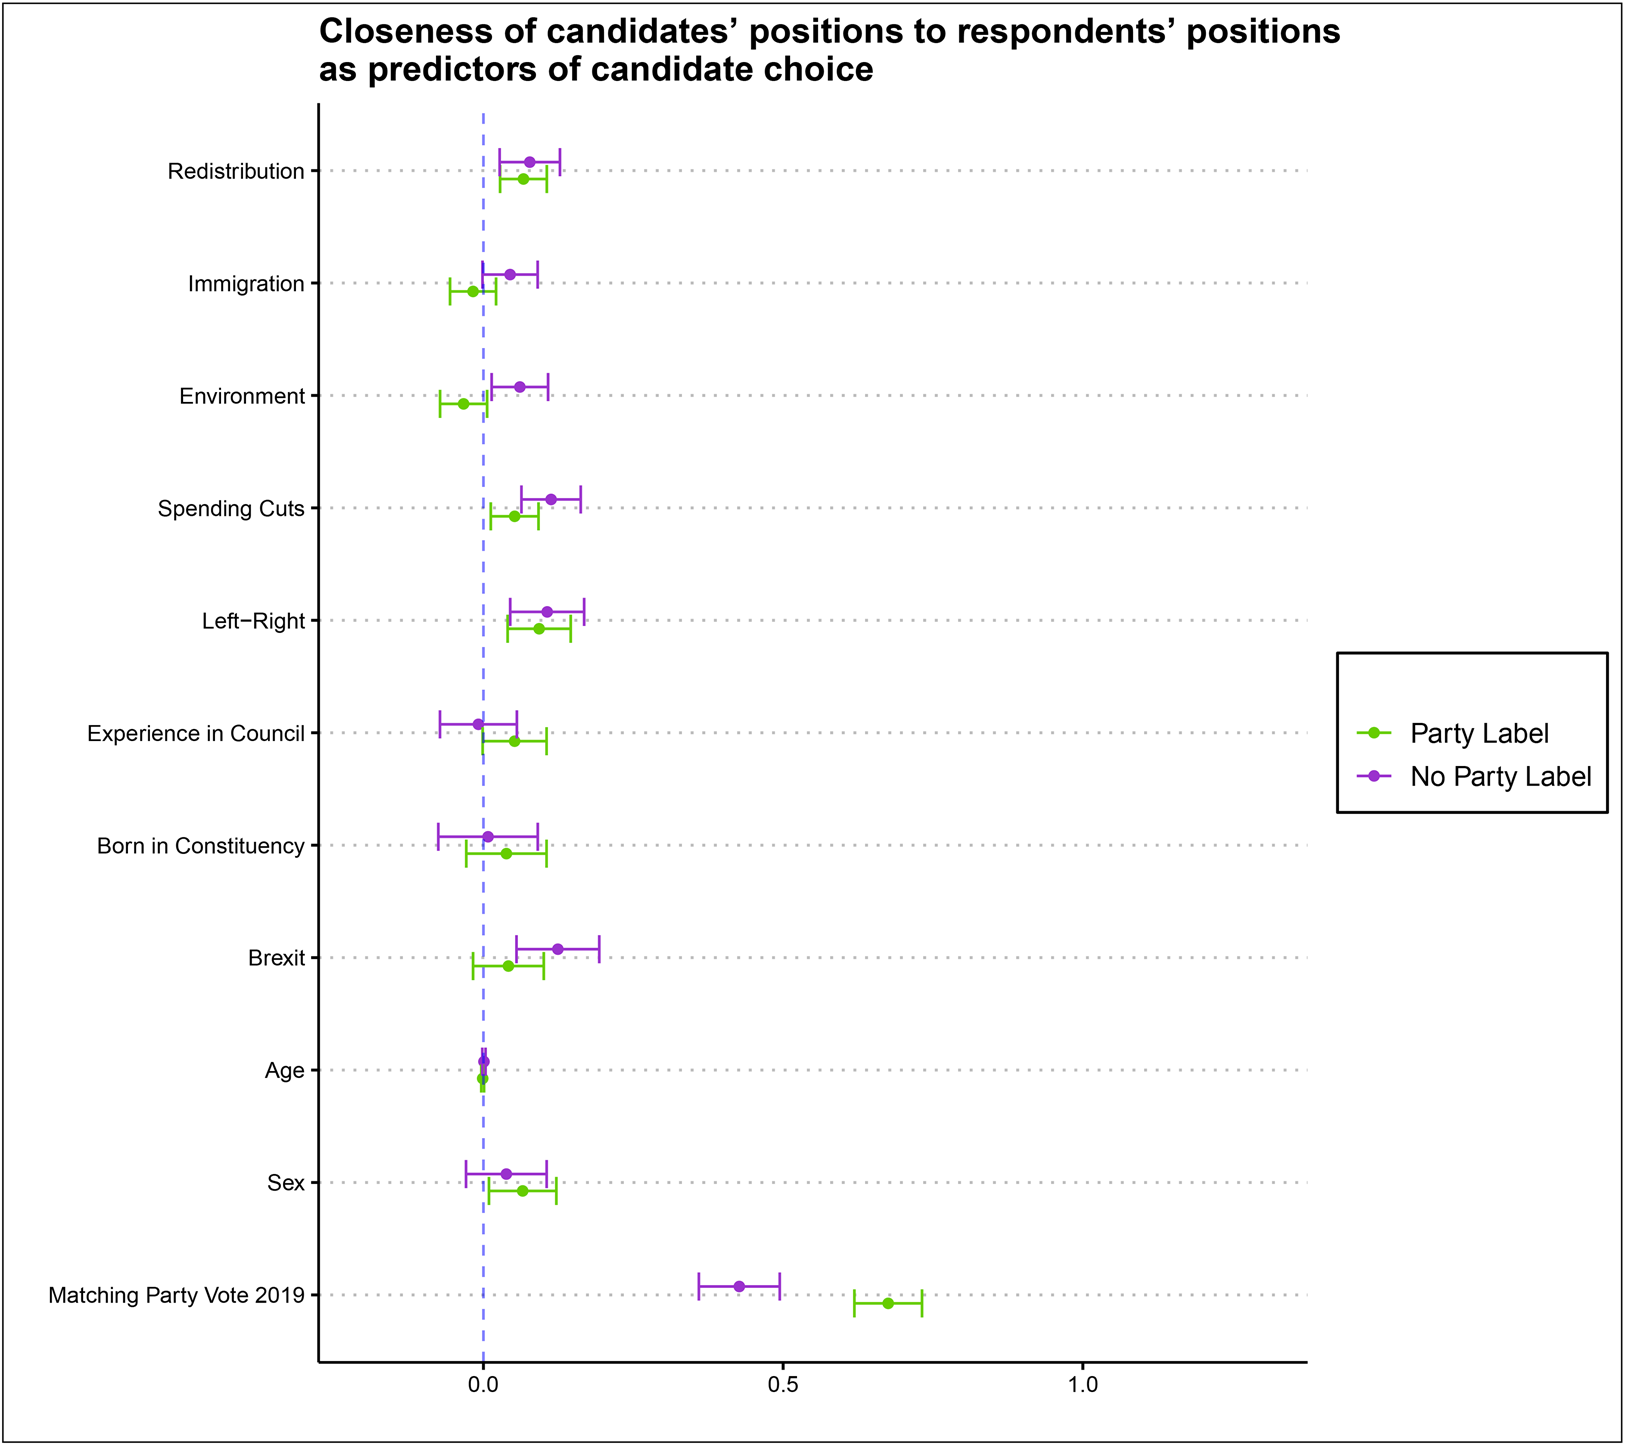
Figure 6. Closeness of candidates’ positions to respondents’ positions with and without party labels as predictors of candidate choice. Redistribution, Immigration, Environment, Spending cuts, left–right positions have been standardized to have mean 0 and standard deviation of 1. Note: only Conservative and Labour voters in the 2019 general election included.
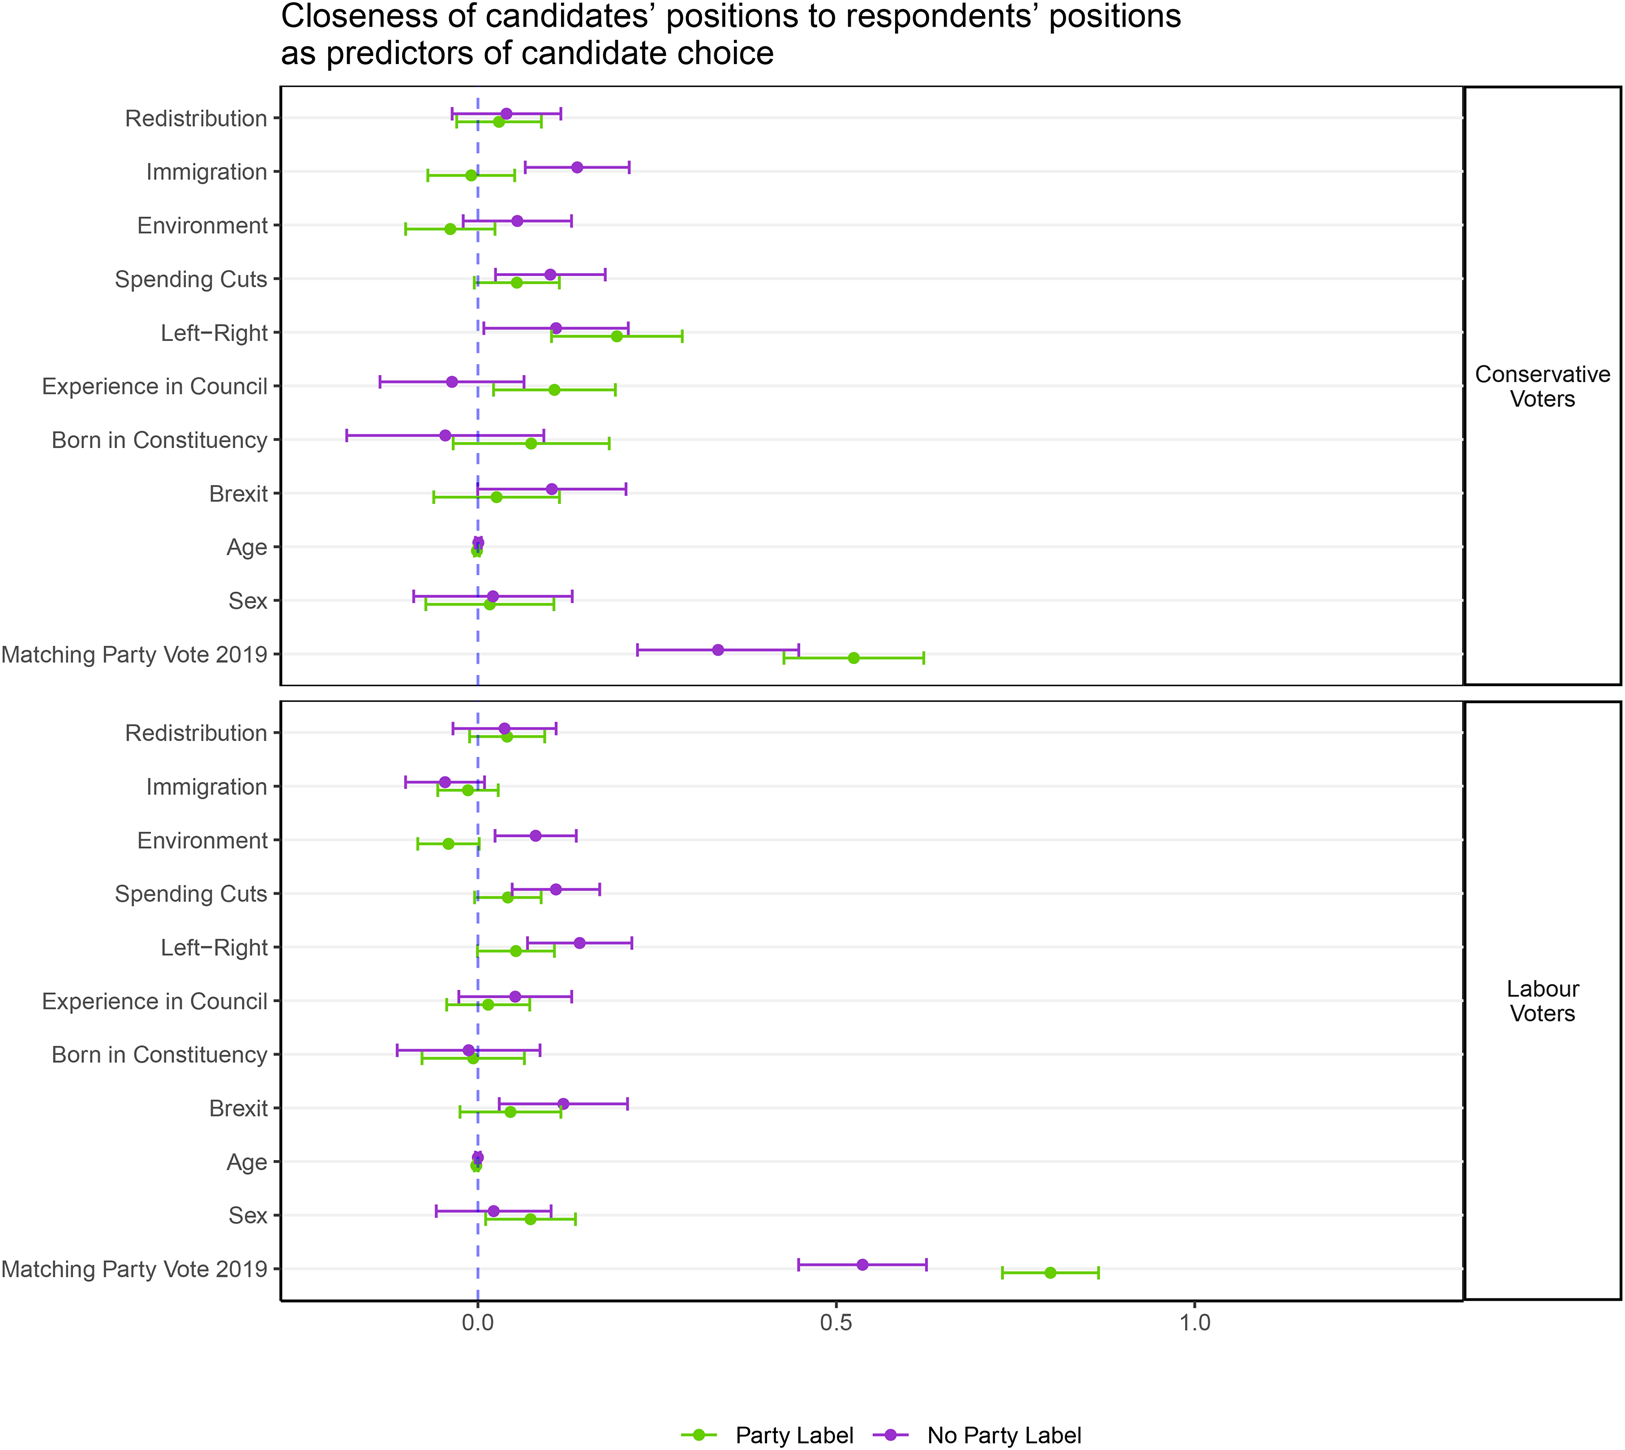
Figure 7. Closeness of candidates’ positions to respondents’ positions with and without party labels as predictors of candidate choice. For 2019 Conservative voters (top) and for 2019 Labour voters (bottom). Redistribution, Immigration, Environment, Spending cuts, left–right positions have been standardized to have mean 0 and standard deviation of 1. Note: only Conservative and Labour voters in the 2019 general election included.
Once again, however, even in the no party label condition, in both Figure 6 and Figure 7, the match between respondents’ past vote and a candidate's party is the strongest predictor of choice in our experiment. The coefficients of party vote are smaller (in absolute terms) than those in Figure 5 because proximity of positions does have some predictive power, but the coefficients of 0.335 for past Conservative voters and 0.537 for past Labour voters are still by far the largest coefficients in the model.
Our initial analysis of the party label versus no party labels conditions revealed modest average treatment effects, concentrated among 2019 Conservative (and Brexit Party) voters, on party choice in our experiment overall. Our subsequent analyses of the relationship between candidate choice and candidate positions (with and without respondent positions) reveal why party label revelation has such a modest impact: respondents are already far more responsive to candidate party than to any of our individual candidate positions or characteristics, even when we do not tell them candidate party explicitly. When given candidate positions and characteristics that are realistic representations of Labour and Conservative candidates, respondents are mostly responsive to candidate party and only weakly responsive to within-party variation in positions.
7. Why is party affiliation predicting choices in the no-labels condition?
We have found that the relationship between respondent past vote and candidate party affiliation is a significant predictor of the chosen candidate, this is true for both model with only candidates’ characteristics and in models based on similarity between respondent and candidates, and it is true even in the experimental condition where respondents are not explicitly told the candidate's party affiliation. One possible explanation for this is that a substantial fraction of respondents are making inferences about which candidate is from which party on the basis of candidate positions, but then voting on the basis of that inference rather than the connection between their personal positions and those of the candidates presented. Another possible explanation is that respondents are voting based on some function of their personal positions and those of the candidates, but we have somehow modeled the relationship incorrectly.
In order to minimize the risk that the latter is occurring, we test a few alternative specifications of our models, in an effort to see if the magnitude of the party affiliation coefficient in the no labels condition can be substantially reduced or eliminated by respecifying the model. Appendix Figure A5 shows the results of an analysis that, rather than modeling the choice in terms of proximity, incorporates the effects of candidates’ position, respondents’ positions, and the interaction of said positions. Again, this shows similarly strong effects of candidate party affiliation, even in the no labels condition. Appendix Figure A2 presents a model with all the first order interactions. We find little evidence of any first-degree interaction with a significant effect on respondents’ choice. While the fact that the interaction coefficients are non-significant should be interpreted with caution due to reduced statistical power, the fact that past vote remains a strong predictor of candidate choice suggests that interaction between attributes is not the main factor driving candidate choice. We similarly do not find evidence supporting a quadratic relationship in the model, as can be observed in Figure A3 in the appendix. Again, all quadratic coefficients are small (only redistribution is marginally significant), and matching past vote is still the strongest predictor of choice.
Despite the fact that we cannot explain away the significant coefficient on the party label when it is not visible to the respondent through these model respecifications, it necessarily arises from some form of residual model misspecification, however this misspecification is related to omitted variables that the respondents know and we, as the analysts, do not. In particular, we do not know the individual-level models by which respondents might be relating observed positions of candidates to inferred party affiliations. We might think that these would be well-approximated by homogenous linear functions of the candidates positions and characteristics, but our results suggest that they are not.
We do think that the fact that candidates’ party affiliation is a strong predictor of choice in this model, in the absence of party labels, across all these specifications, argues in favor of the interpretation that respondents are predominantly voting based on the perceived party of the candidates. Where the party of the candidates is presented explicitly, this is easily done. Where the party of the candidates is not presented, the no labels condition, it seems that most respondents are nonetheless able to infer which candidate is from which party and vote accordingly. We emphasize that this does not mean respondents do not care about policy. There are many policy dimensions that they might care about besides those in the experiment. It does mean that the information in the candidate positions and the party labels are largely substitutes for one another, whether because respondents care about other policy issues or aspects of party performance beyond the ones we present, or because they have affective ties to the parties.
The findings still suggest that respondents’ preferences and positions play a role in choosing a candidate. Respondents’ choice does not exclusively appear to be the result of “guessing” which candidate belongs to which party, there is some responsiveness to proximity on some issues even in the party labels condition. We see some evidence of tension between some of the Conservative candidates’ positions on redistribution and spending cuts and public opinion at the time of the survey, such that without the presentation party labels past Conservative voters are more likely to “mistakenly” choose Labour candidates, in the sense that they make a different choice when the labels are present. This might be because the presentation of the party label enables them to better capture their other reasons for generally voting Conservative.
8. Conclusion
Our experiment contributes to a long-standing debate about the relevance of candidates’ party labels, positions and characteristics in the presence of party competition and established party systems. It also illustrates the use of a novel measurement strategy building on previous work with conjoint experiments. The novel contribution of this study is that we anchor the treatment distribution (the candidates characteristics) of our experiment on a real distribution, the estimated characteristics of the 2017 general elections candidates, for both Labour and Conservative. By doing this, we aim to address the question of how much candidates’ positions matter in the presence of party competition, as well as the extent to which the availability of the party cue suppresses voters’ response to candidate positions, given the actual distribution of policy positions of candidates in each party. This experimental design sacrifices design-based causal inference for the impact of each individual attribute or policy position. However, we maintain design-based causal inference for complete profiles and, model-based causal inference for individual attributes and policy positions. Additionally, it is important to notice that, as in any survey experiment, the survey format provides respondents with more issue information than they might ordinarily have about candidates. This may tend to exaggerate the role of issues on vote choice.
We show that, in the absence of party labels, respondents’ preferences are associated with the candidates that they select. The introduction of party labels only slightly modifies these relationships. 2019 Labour voters are found to prefer Labour candidates regardless of whether party labels are presented in the experiment. 2019 Conservative voters are less likely to select Conservative candidates in the absence of party labels, but even for them the relationship between the positions of their candidate choices and their policy positions only changes with respect to a couple of issues. We find partisan sorting of both respondents and candidates, especially on the left–right spectrum, which means that policy voting and partisan voting tend not to be in tension with one another. However, for most issues we do find substantial numbers of voters differ from the positions of the candidates of the party they voted for in the last election, making it possible to observe whether issue positions of candidates relative to respondents predict candidate selection in the experiment, holding party constant. We find that they do, although not very strongly relative to the party label.
Strikingly, we find that candidate party is the strongest predictor of vote choice even when the party label is not presented to the respondent. We suggest that this is because of a mechanism whereby respondents can infer candidate party from positions, and then largely vote on party label. When respondents are presented with candidates whose party affiliation is omitted, respondents use other attributes as a way of inferring the candidates’ party affiliation (Schaffner and Streb, Reference Schaffner and Streb2002; Titelman and Lauderdale, Reference Titelman and Lauderdale2021).Footnote 5 This inferential mechanism makes sense whether you are a policy-oriented voter (who cares about policies in addition to those presented, which are effectively proxied by party) or a party-oriented voter (who cares about party as such). This might appear to be an argument against the the policy voting hypothesis, however it is only an argument against the most extreme form of that hypothesis, because of the possibility that respondents care as much or more about issues that we did not present in the experiment in forming their party preference.
At the same time, our findings do not support the strongest forms of the “partisan intoxication” hypothesis either. If respondents were blindly choosing candidates for their party affiliation, we would expect them to choose these candidates regardless of their own and the candidate's positions. We also might not expect them to be as good at mapping issue positions of unlabeled candidates onto parties as they appear to be. The respondents’ preferences and positions predict the chosen candidates in the labels-free condition of our experiment, and while these relationships are weakened with labels, they do not go away entirely. Nonetheless, the dominant mechanism appears to be one that runs through party: respondents use the available information about policy to infer the party of the candidates, rather than because they are strongly responsive to the match with their own positions on the presented issues. Fundamentally, these findings are in line with the argument made by Orr et al. (Reference Orr, Fowler and Huber2023), that information on partisan affiliation of fellow citizens influences beliefs about policy positions, and information about policy positions influences belief on party affiliation. The fact that voters can make these connections–inferring party affiliation from observed positions as well as unobserved positions from party affiliation–makes separating a purely affective party-oriented versus a purely instrumental policy-oriented mechanism for candidate choice extremely difficult. Our analysis does suggest, in line with Rogers (Reference Rogers2020), little evidence for the extreme versions of either interpretation.
Supplementary material
The supplementary material for this article can be found at https://doi.org/10.1017/psrm.2024.20. To obtain replication material for this article, https://dataverse.harvard.edu/dataset.xhtml?persistentId=doi:10.7910/DVN/0WMHSD&version=DRAFT&faces-redirect=true


 Open access