


1. Introduction
Politicians often use government resources for political purposes. In democracies, politicians increase government spending to boost their re-election chances, creating a pattern commonly termed “political business cycles” (Nordhaus, Reference Nordhaus1975; Tufte, Reference Tufte1978). Studies on distributive politics have also identified general political favoritism in targeting government goods in many democracies (Golden and Min, Reference Golden and Min2013). Similar to how government funds are used as pork barrel by politicians in democracies, in autocracies politicians use government budget strategically for career advancement and personal enrichment. In authoritarian regimes with non-competitive elections, autocrats use expansionary fiscal policy to earn votes and win elections (Wright, Reference Wright2011). In South Korea during President Chung-hee Park's rule, phases of economic recovery and boom tracked dates of national elections and referendums (Soh, Reference Soh1988). During Malaysia's autocratic years, the ruling coalition systematically increased government spending before elections (Pepinsky, Reference Pepinsky2007). In Egypt under Mubarak, there was clear evidence of budget manipulations by the regime to court key constituencies during an election year (Blaydes, Reference Blaydes2010).
How do politicians make and implement economic policies when there is little electoral considerations? In autocratic regimes such as China and Vietnam, it is unclear to politicians ex ante how to distribute government funds to achieve their career goals. Fiscal incentives such as tax breaks attract investment (Guo, Reference Guo2009; Jensen and Malesky, Reference Jensen and Malesky2018), but also cut into the local government budget. In addition, policy implementation comes with potential risks. Expansive policies could increase local government debt and the likelihood of social instability. Investment projects that fail to reach the desired outcome might become a notable waste of public resources that hurt politicians’ reputation. Overall, it remains unclear how local politicians balance these factors to benefit their career.
We argue that promotion-seeking politicians consider political risks as well as political returns when making economic decisions. Especially when the payoffs are not immediately clear and when politicians do not have a good understanding of local conditions, politicians make decisions that minimize political risks. Firm ownership types serve as an informational shortcut for politicians especially when they arrive at a new locality, providing them with inferential information about firms’ political importance. The status of state-owned enterprises (SOEs) suggests more connectedness with the government, and more systemic importance in the economy (Leutert, Reference Leutert2018; Chen et al., Reference Chen, Jin and Xu2021). Government officials might prefer to be associated with SOEs especially when they do not have a solid understanding of local conditions and have not yet established trusted relationships with private firms. However, SOE's advantage may wane as a politician learns about the local conditions and establishes new connections with individual private firms, and private firms can gradually gain better access to preferential policies and government resources (Hou, Reference Hou2019).
We test our argument in the context of China during its fiscal stimulus period starting in 2008. In response to the global financial crisis in 2008, the Chinese government introduced a large stimulus package (totaling 4 trillion yuan or 586 billion USD) which injected a flood of new funding into the local economy. China during this round of fiscal expansion provides an ideal case to test our theory—the stimulus provides local politicians with new opportunities to distribute resources to select firms within their discretion. Research finds that the stimulus package has benefited SOEs and businesses more connected to local leaders (Bai et al., Reference Bai, Hsieh and Song2016).
Using firm-level subsidies data combined with leadership turnover data from 2007 to 2015, we show that, contrary to the prevailing narrative, the state sector has not uniformly benefited from government stimulus. Local leadership rotation has a significant effect on the distribution of resources among firms. More specifically, we find that SOEs receive a larger amount of subsidies relative to private firms after local political turnovers, and the effect lasts for around two years on average. As a governor's local knowledge increases and new connections with private firms are established, SOEs lose their status advantage. Consistent with existing scholarship, we argue that private firms catch up in government treatment by establishing ties with new governors and engaging in elite exchange (Frye, Reference Frye2002; Bai et al., Reference Bai, Hsieh and Song2020). Further, this subsidy distribution strategy tends to be adopted by the more politically savvy governors who were more likely to be promoted after their tenure.
This study advances our understanding of political economy and decision making in autocracies in several important ways. First, our paper contributes to the literature on the political determinants of economic policies (Oi, Reference Oi1999; Bernhard and Leblang, Reference Bernhard and Leblang2002; Betz and Pond, Reference Betz and Pond2020; Ma, Reference Ma2022). Similar to Earle and Gehlbach (Reference Earle and Gehlbach2015), we show that political turnovers generate distributional effects due to particularistic rather than general economic decisions. We go a step further by showing how such distributional effects evolve over time: perhaps counter-intuitively, the advantageous position of SOEs resulted from political turnovers is short-lived. As new governors learn about local conditions and establish new ties with private firms, the gap between state firms and private firms’ statuses narrows. This finding challenges conventional wisdom that Chinese SOEs have always benefited from government support relative to private enterprises (Harrison et al., Reference Harrison, Meyer, Wang, Zhao and Zhao2019; Lardy, Reference Lardy2019).
Second, earlier research on unelected officials shows that their decisions on resource distribution are made to serve the interest of higher-ups who determine their career advancement (Bueno de Mesquita et al., Reference Bueno de Mesquita, Alastair, Siverson and Morrow2003; Lei and Zhou, Reference Lei and Zhou2022) or to directly contribute to local economic growth (Chen and Zhang, Reference Chen and Zhang2021). We propose a different aspect of authoritarian distributive politics: new politicians, while still learning about the local conditions, tend to distribute resources in a manner that avoids political disasters.
2. Economic policies, political incentives, and firm types
In democracies, a key driver of economic policy making is electoral competition (Jensen and Malesky, Reference Jensen and Malesky2018). Politicians use policy instruments mainly to boost their reelection prospects. As voters are primarily concerned about (un)employment, incumbent politicians increase spending and incentives to attract investment to improve the probability of being reelected. The political logic of economic policy making is quite different in non-democracies, as politicians do not face electoral pressure from below. Although politicians can be publicly spirited and could have social welfare in mind, it is fair to assume that their primary goal is career advancement.
A growing body of literature examines how performance is rewarded in authoritarian contexts, especially in single-party states where clear promotional ladders make performance criteria credible (Magaloni, Reference Magaloni2006). Many of these studies use the empirical case of China, where economic performance, together with a number of other measures, are found to be highly correlated with promotion to higher office (Li and Zhou, Reference Li and Zhou2005; Landry et al., Reference Landry, Lü and Duan2017). Existing studies (Guo, Reference Guo2009; Cao et al., Reference Cao, Kostka and Xu2019; Chen and Zhang, Reference Chen and Zhang2021) provide a variety of “outcome tests” that identify outcome measures that lead to promotion, but they do not address the policy-making process of local politicians, especially when the outcomes of policy decisions by these politicians are not entirely certain ex ante.
In other words, there is political uncertainty when politicians make decisions, so even though it is clear ex post that some decisions are beneficial to one's career by boosting GDP growth and fiscal extraction (the regular outcome variables studied in the literature), it is not clear ex ante. We contend that it is insufficient to use these outcome tests to understand the policy-making process of politicians in non-democracies, and that we need to consider the calculation of political risk when understanding politicians’ economic decision making. Risk orientation affects politicians’ behavior in policy implementation and innovation, and politicians are motivated by both positive incentives (expected returns) as well as negative incentives (expected costs) (Loose et al., Reference Loose, Hou and Berinsky2018; Lu, Reference Lu2020). Political risk comes in part from uncertainty, and in the context or our paper, we conceptualize political risk as the risk of jeopardizing one's political career.
We now place this understanding of political incentives and uncertainty in the context of firm subsidy distribution in China. China during fiscal expansion provides an ideal case for understanding politicians’ career incentives, political uncertainty, and economic policy making. In China's highly decentralized economic system, local politicians have significant discretion in economic policy making (Oi, Reference Oi1992, Reference Oi1999; Xu, Reference Xu2011). Provincial leaders, in particular, play a decisive role in distributing fiscal resources to lower-level governments and businesses, and they are well connected with local business elites (Jiang and Zhang, Reference Jiang and Zhang2020).
China has a unique cadre management system where politicians are regularly rotated to different regions (Jiang and Mei, Reference Jiang and Mei2020). Rotation of local officials officially occurs every five years when the National People's Congress is held, but the actual rate of turnover is more frequent based on the decisions of the Chinese Communist Party's (CCP) Organization Department. With limited knowledge of local political economy and elite networks, a new local politician faces uncertainty and bears startup costs of managing new development projects and identifying reliable local business elites to work with (Shi et al., Reference Shi, X Zhang and Zhang2021). During political turnovers, local connections between the leadership and certain local firms are destabilized, and new leadership comes into the scene with weaker ties to local economic actors (Fang et al., Reference Fang, Li, Xu and YanForthcoming).
Given these uncertainties, when a politician is rotated into a province as the new governor, he is likely to start by making politically prudent decisions that minimize risk and distribute resources to obviously important actors, while learning about local conditions and establishing connections with important business actors. SOEs are generally considered more politically important than private firms. SOEs, whose top executives are part of the CCP's nomenklatura system, have designated seats in important political bodies such as the local legislatures, and have direct access to local political elites (Wang, Reference Wang2018). SOEs also serve unique political functions of advancing industrial policies, funding state initiatives, paying higher taxes, as well as maintaining social stability and helping with redistribution (Han et al., Reference Han, Li and OiForthcoming; Leutert, Reference Leutert2020). SOEs are also less likely to be investigated during anti-corruption campaigns, making them a safer choice to be associated with (Fang et al., Reference Fang, Wu, Zhang and Zhou2022).
The relationship between local politicians and firms is dynamic rather than static. As a new governor gains more knowledge about local political economy and establishes new ties with firms, he can gradually move away from making decisions based on firm ownership. Governors have strong incentives to forge new connections with local economic elites (Zhang and Liu, Reference Zhang and Liu2019), and they are known for offering special deals to select private firms (Ang, Reference Ang2020). These special deals with carefully chosen private firms, including better access to government resources such as subsidies, can benefit local leaders politically because these deals are usually growth-enhancing, and local leaders can derive private benefits (Bai et al., Reference Bai, Hsieh and Song2020). Similar to other contexts, this relationship is better characterized by elite exchange than by state capture (Frye, Reference Frye2002).
We therefore expect that governor turnovers benefit SOEs in the short-run, but private firms gradually catch up, and establish ties and special deals with new politicians. In the meanwhile, politically important SOEs continue to receive subsidies and other benefits—they lose their advantages gradually, but they do not become disadvantaged as compared with private firms.
Taken together, we hypothesize that after governor turnovers, new governors will disproportionately favor SOEs by granting them more government subsidies compared to private firms. This turnover effect gradually attenuates as the new governor acquires more information about local firms, establishes new connections with select private firms, and adjusts his economic policy making accordingly. We test our hypothesis using firm information and turnover data in China during the stimulus period.
3. The 2008 stimulus program, political turnover, and firm subsidies
In response to the global financial crisis, China announced an unprecedented fiscal stimulus program in the total amount of 4 trillion Chinese RMB (586 billion USD) in November 2008.Footnote 1 This stimulus package, which amounted to about 11 percent of China's annual GDP, was mostly to be spent on infrastructure projects by 2010 (Bai et al., Reference Bai, Hsieh and Song2016). Some of these policy directives also extend beyond 2010 (Naughton, Reference Naughton2009). According to the National Development and Reform Commission (NDRC), most of the package was to be spent on public infrastructure.Footnote 2 Figure A.2 illustrates the structure of the plan. In this paper, we are focusing on the fiscal transfer (both from the central and provincial level) part of the stimulus plan.
After the central government announced the stimulus plan, provincial governments subsequently announced complementary investment strategies (Zhou, Reference Zhou2017, p.240) and injects additional funds into the local economy. The government of Shanghai promised a direct investment of 160 billion RMB and the Zhejiang Provincial government pledged 350 billion RMB direct investment. Provincial proposals for investment and plans for projects are evaluated by the NDRC, which then approves “block grants” of investment funds from the central government to the localities. One channel to implement the stimulus plan is through government direct subsidies to firms that are industry-specific. For example, the policy targeting the automobile industry outlined an increase in public funds to subsidize automobile purchases in the amount of five billion RMB (Naughton, Reference Naughton2009).
We find that SOEs are most heavily subsidized after provincial governor turnovers, but their advantages gradually attenuate as private firms receive more subsidies. Bai et al. (Reference Bai, Hsieh and Song2016) argue that local governments were actively providing special deals to favored businesses during the stimulus period. Cong et al. (Reference Cong, Gao, Ponticelli and Yang2018) show that stimulus-driven credit expansion disproportionately favored SOEs. We provide a revision to existing work on subsidies during the 2008 stimulus period by investigating the interaction effect of fiscal stimulus and political turnover.
China is a one-party state, and the CCP's Central Organization Department appoints provincial leaders and regularly rotates politicians to different regions. Among all provincial leaders between 1999 and 2014, all had worked in more than one province and more than 40% had served in leadership positions (i.e., party secretary or governor) in two or more provinces (Jiang and Mei, Reference Jiang and Mei2020). Each province has two political leaders: the provincial party secretary and the governor. Party secretaries are ranked higher than governors, but governors have the executive power and make key economic decisions (Yao and Zhang, Reference Yao and Zhang2015). Provincial governors serve to oversee and coordinate deployment of projects such as those from the fiscal stimulus program (Interview S1). Provincial party secretaries are less directly involved in economic affairs. Compared to governors, party secretaries are more likely to rely on established patron–client networks, and might have less incentives to solicit support from local actors. Conversely, governors—and especially new governors—might have stronger needs to build new connections and a support base from below (Zhang and Liu, Reference Zhang and Liu2019). We therefore expect provincial governor turnovers to affect subsidy distributions and do not expect party secretary turnovers to have similar effects on subsidy distribution.
In our sample, a governor's average and median tenure are both four years (see Figure A.4). These provincial leaders are regularly rotated across positions. Political turnover and promotions are often linked with economic performance and patronage ties in China (Li and Zhou, Reference Li and Zhou2005; Jiang, Reference Jiang2018).
4. Data and research design
Our data include firm subsidies, other firm-level variables, and leadership turnover information in 31 provincial-level regions in China. The firms are publicly listed in the Shanghai and Shenzhen stock exchanges. We use subsidy amounts that firms receive from the government and firm ownership types as reported in their financial statements. We combine these data with the Chinese Political Elite Database (CPED, Jiang, Reference Jiang2018) that includes provincial official information.
Firm ownership types include SOEs with the central government as the controlling shareholder (Central SOEs) or local governments and/or the State-owned Assets Supervision and Administration Commission (SASAC) as the controlling shareholder (Local SOEs), private firms, and other. Our main interest is in comparing subsidies received by private enterprises and state-owned enterprises, including those owned by the central and local governments.
To analyze the effect of the 2008 stimulus program, we subset our data to relevant industries. The bulk of the stimulus was allocated toward infrastructure construction, including large-scale infrastructure, affordable housing, rural infrastructure, earthquake reconstruction and the like. We therefore select the construction, hydro, environment, and public facility management, electricity, thermo, gas and water production and supply industries for our analysis. Subsidies received by firms in these industries increase almost every year from 2007 to 2015, with a significant jump in subsidies occurring from 2007 to 2008.Footnote 3 The total numbers of firms that belong to these industries are listed in Table A.2.
The summary statistics of the main variables are shown in Table 1. SOEs are, on average, much larger than private firms in terms of total assets and total revenues. Private firms are more profitable than SOEs. On average, SOEs receive larger amounts of government subsidies compared to private firms.
Table 1. Descriptive statistics: firms and politicians
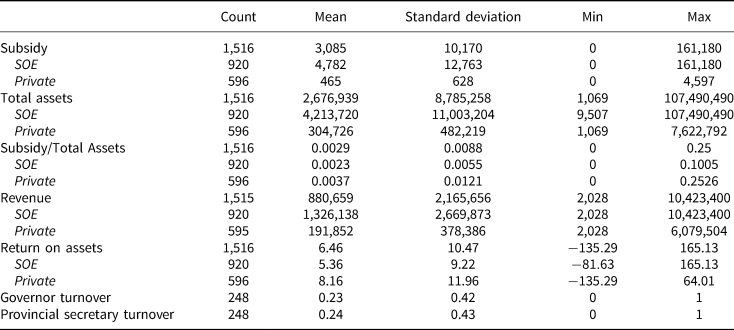
Notes: Units for subsidies, total assets, and revenue are in 10,000 RMB. Firms in our sample are all publicly listed by when we last accessed WIND financial terminal in July 2019. They are not necessarily publicly listed for the entire duration of 2007–2015. In years when firms were not publicly listed, we do not have their firm-level characteristics. These firm-year observations are not included. Politician turnover data cover 31 provinces across 8 years in our sample.
We study variation in the amount of subsidies that SOEs receive relative to private enterprises following local leadership turnovers within each province from 2008 to 2015. Our model of estimation is as follows:

where the dependent variable $Subsidy_{i, j, p, t}$ is the amount of subsidies (in 10,000 RMB) that a firm i in province p and in industry j receives in year t, standardized by the amount of assets of the firm by end of the same year.Footnote 4 Leadership $Turnover_{p, t}$
 is a binary variable indicating whether province p has a political turnover in year t. This variable is lagged by one year to show the effect of turnover on the subsequent year's subsidies to firms. $FirmType_{i, j, p, t}$
 is a factor variable that denotes whether the ownership type of firm i in year t is private or state-owned. ${\bf X}_{i, j, p, t-1}$
 indicates other firm-level characteristics such as firm size (total assets or revenue) and profitability (ROA) in the previous year. We include combinations of different fixed effects in estimating the model: $\delta _p$
 , $\gamma _t$
 , and $\eta _j$
 are province, year, and industry fixed effects. Our full model includes governor and industry-year fixed effects. The main coefficient of interest is $\beta _{3}$
 , the interaction effect of leadership turnover with firm ownership type.
Our empirical strategy rests on the assumption that provincial-level political rotation is exogenous to most firms within the province. That is, $Turnover_{p, t-1}$ is uncorrelated with the error terms. We do not suggest that political rotation is an exogenous event. It is well documented that local economic performance and patronage ties explain political turnover in China (Li and Zhou, Reference Li and Zhou2005; Jiang, Reference Jiang2018). We also do not rule out the possibility that a few well-connected firms could be informed about provincial leadership changes, but we do not expect many firms to be informed and able to act ahead. There is also no evidence that SOEs or other powerful firms directly influence where exactly a politician rotates to.
5. Main results
Table 2 shows our main results. Models (1) to (3) include year, province, and industry fixed effects, and model (4) to model (5) varies different combinations of fixed effects. We refer to model (5) as our full model, which includes governor and industry-year fixed effects.Footnote 5
Table 2. Effect of governor turnover on firm subsidies private versus SOE firms
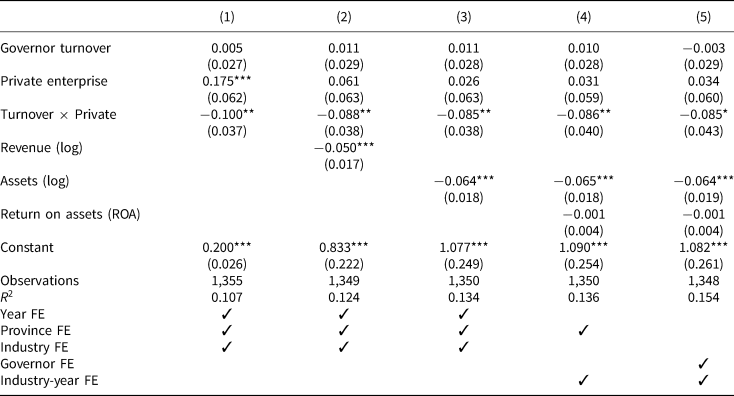
Governor turnover, revenue, total assets, and ROA are lagged by 1 year. Robust standard errors clustered by province in parentheses. ***${\rm p}< 0.01$ , **${\rm p}< 0.05$
 , *${\rm p}< 0.1$
 .
.
The binary variable recording whether a firm is a private enterprise is not statistically significant across specifications. This suggests that private firms and SOEs tend to receive similar levels of subsidies when a province does not experience governor turnover a year before. This changes in the year following provincial governor turnover. The statistically significant and negative interaction term between governor turnover and private enterprise indicates that, on average, the amount of subsidies going to private enterprises decreases relative to SOEs after a governor turnover. This result is robust across specifications (Table 2).Footnote 6
The interaction effect of provincial governor turnover with private firms is substantively and statistically significant. For a private firm with the average subsidy over total assets of 0.319 percent, the full model suggests that this measure decreases to 0.234 percent ($= 0.319-0.085$ ), or a 26.6% ($= {0.085\over 0.319}$
 ) drop in government subsidies (standardized by total assets) in the year after a governor turnover. For a private firm with median subsidy over total assets in our sample, 0.127 percent, this decrease in subsidies corresponds to 0.042 percent ($= 0.127-0.085$
 ) of total assets, or a 66.9% ($= {0.085\over 0.127}$
 ) drop in standardized subsidies following the turnover. Compared to an SOE of similar sizes, this average private firm would receive about 258 thousand RMB less in subsidies (=$303,\; \, 648,\; \, 000 \times {0.085\over 100}$
 ) in the year after a turnover.
To visualize the effect, we plot the coefficient of the interaction term in Figure 1 for the two years prior to, the year of, and for the five years following a turnover. The depressing average effect of governor turnover on private firm subsidies does not exist until after the turnover, persists for two years, and disappears in the third year onward. Later in a new governor's tenure, we expect that the governors’ knowledge about and connections with private firms increase and as a result, no longer relies on ownership types to distribute subsidies.
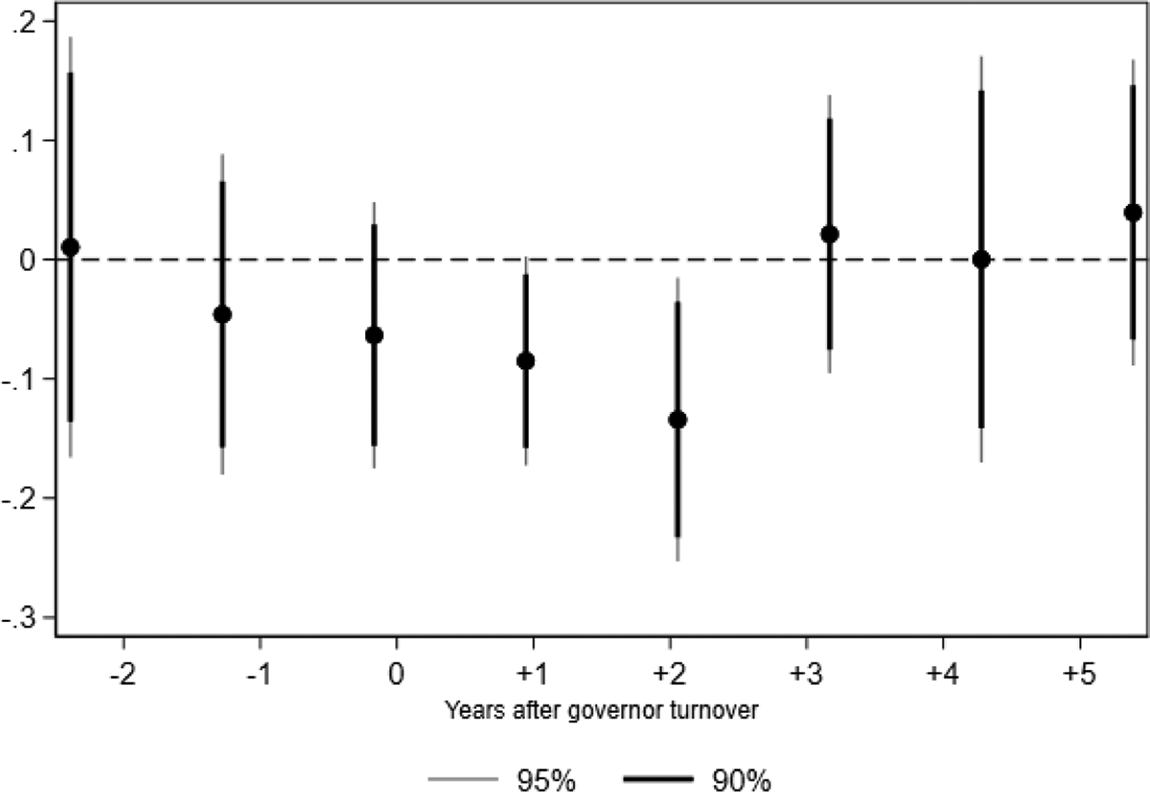
Fig. 1. Effect of governor turnover on subsidy received by private firms relative to SOEs. Notes: The y-axis represents the coefficient for the interaction between private enterprises and governor turnover under model 5. Each coefficient is estimated by a separate model, with governor turnover leading by 2–0 years or lagged by 1–5 years respectively. The underlying results are shown in Table A.8.
Importantly, we do not find any “placebo” effects in subsidies received by private and SOE firms in the two years leading up to governors’ turnovers (Figure 1). This result strengthens the plausibility of our research design because it suggests that there are no unobserved variables leading to differential trends in the subsidies received between SOEs and private firms prior to governor turnovers.
Further, we implement a sensitivity analysis (Cinelli and Hazlett, Reference Cinelli and Hazlett2019) and show that it is unlikely that our findings are driven by unobserved potential confounding variables.Footnote 7 We also confirm that provincial party secretaries, because of their less direct role in economic affairs, do not affect firm subsidies in the same way that governors affect subsidy distributions. We find that provincial party secretary turnover does not yield a similar effect on firm subsidy distribution as governor turnover (see Table A.11).
6. How governor rotations affect firm subsidies
Drawing on the results above, this section probes potential mechanisms through which governor rotation affects the amount of government subsidies.
New governors favor SOEs early in their tenure
When a governor is rotated to a new location, he has yet to grasp local political economic conditions and to understand individual firms’ political status, connections, quality, and demands. Facing uncertainties, a new governor is likely to use informational shortcuts to guide initial policy making while learning about local conditions.Footnote 8 Firm ownership, therefore, serves as a useful source of informational shortcut for political importance, especially in the early days of a new politician's tenure. As discussed, SOEs are usually considered more politically connected and important than privately owned firms. We therefore propose that a new governor is likely to make economic decisions that benefit SOEs initially.
New governors’ itineraries during their first days on the job provide useful evidence suggesting that they often prioritize SOEs while catching up on local conditions. For instance, Chen Quanguo, who became the new governor of Hebei province in December 2009, organized his first business and economics meeting with Shenhua Group, a state-owned mining and energy company to discuss their investment in Hebei the second month he took office.Footnote 9 His first open letter, issued in January 2010, was addressed to the provincial SOE reform and development committee to encourage their research and development.Footnote 10 In March 2010, the new governor visited CRRC Tangshan, a state-owned railway equipment manufacturing company. The company subsequently received a large government subsidy totaling 161 million yuan.Footnote 11 Zhao Kezhi, new governor to Guizhou province whose term started in August 2010, took a similar approach with SOEs early in his tenure. His first meetings with the business sector include executives from state firms such as Chalco (Aluminum Corporation of China Limited), China Huadian Corporation, and Sinopec in October, and a meeting with the provincial State-owned Assets Supervision and Administration Commission (SASAC) leadership.Footnote 12 These governors also arranged meetings with private and foreign firms, but early in their tenure they made sure to establish contacts with SOEs first.
SOE's political importance provides political buffer in cases where events do not play out favorably. Kashyap and Dobson (Reference Kashyap and Dobson2006) quote a Chinese bank manager saying, “If I lend money to an SOE and it defaults, I will not be blamed. But if I make a loan to a privately-owned shoe factory and it defaults, I will be blamed” (p. 133). This quote reflects a sentiment shared by many decision makers that they are less likely to bear risks from resource misallocation to SOEs instead of to private firms. On the flip side of this logic, local officials can also “bet on the wrong side” when picking firms to associate with, including when choosing which firms to award with government grants. For instance, Chen et al. (Reference Chen, Jin and Xu2021) document cases where local officials are removed after a corruption crackdown, new officials usually come in and start supporting state-owned firms. Support for SOEs is almost “automatic” (p. 20). For subsidies distributed as part of the 2008 fiscal stimulus program, such political risk is nontrivial for local officials given that NDRC sent supervising teams to localities to detect issues regarding project implementation and corruption.Footnote 13
Special deals between private firms and local politicians
We have established that new governors prefer politically important SOEs when making decisions early in their tenure. What explains their subsidy distribution patterns later in the tenure, and why do governors change their subsidy distribution strategies by increasing subsidies to private firms later? We next evaluate a possible explanation: the special deals theory.
The special deals theory posits that Chinese private firms usually obtain special deals from local politicians, which enable them to obtain favorable access to resources and coordinate with their business development (Bai et al., Reference Bai, Hsieh and Song2020). The nature of special deals is highly individualistic, in that local politicians become the “point person” for a subset of private firms. These personalized relationships are mutually beneficial: firms with special deals gain better access to resources and preferential policies, and politicians gain political advantage if these deals turn out to be growth-enhancing. Politicians might also extract (personal) rents from these deals (Ang, Reference Ang2020). Because of the personal nature of these special deals, politicians choose private firms carefully and only work with firms they have built trust with.
The special deal story helps explain our finding that political turnovers hurt private firms in the short run, but not necessarily in the long run. Private business owners build and rely on personal connections with individual local politicians while SOEs rely more on institutional ties with governments (Zhou, Reference Zhou2017; Chen et al., Reference Chen, Jin and Xu2021). As such, promises and commitments made by the local government to a private business, such as subsidies, can be highly dependent on the individual politician, and might not be kept by the successor (Lei, Reference Lei2018). In some cases, businesses are asked to pay back waived taxes arranged with previous politicians (Zhu and Zhang, Reference Zhu and Zhang2017), and in other cases, preferential policies given to private firms are revoked by the new leader.Footnote 14 Private companies sometimes even list “leadership turnover” explicitly as a risk factor in their annual reports.Footnote 15 On rare occasions, private entrepreneurs take it to the media and accuse new government officials for changing policies in a “capricious manner.”Footnote 16 Secondary evidence suggests that private firms usually respond to local turnover by investing more in building new political connections while SOEs are less likely to do so. For instance, Fang et al. (Reference Fang, Li, Xu and YanForthcoming) find that firms increase their “perk spending” (e.g., travel expenses, business entertainment expenses) to invest in political connections after local turnovers. Compared with SOEs, private firms are more likely to increase such perk spending, suggesting that private firms are in greater need to build new connections after political turnovers.
We also provide quantitative evidence that political connections aid private firms in obtaining special deals. Using data from the China Stock Market & Accounting Research Database (CSMAR) which records the past positions of board members serving in listed firms in China, we code a board member as having political connections if she has served in government institutions (e.g., CCP local committees, government agencies) and produce a political connection measure that records the ratio of firm board members with political connections. We find that more politically connected private firms obtain more subsidies.Footnote 17 This evidence corroborates our special deals story.
In sum, the individualistic and covert nature of special deals between local politicians and private firms prevents us from conducting a more systematic analysis, but it is highly plausible that private firms gradually develop “special deals” with new governors, and one benefit of these special deals is more targeted subsidies. Private firms are initially disadvantaged because they lose their deals and individualistic connections with outgoing governors, but they catch up by building new connections and establishing special deals with new governors.
Governors’ career incentives
Next, we assess the effectiveness of this resource distribution strategy on governors’ career. We first show that governors near retirement are less motivated to change their subsidy distribution pattern. We then use additional career information of governors to show that the turnover effect is more likely to exist during the tenure of governors who are promoted to the central government afterwards. This finding provides suggestive evidence that it is in new governors’ career interests to favor SOEs earlier in their tenure. It is also consistent with the special deal mechanism that politicians who engage in special deals with private firms might be rewarded later if the deals are growth-enhancing.
Politicians have different ambitions given their personal background (Meserve et al., Reference Meserve, Pemstein and Bernhard2009). In China, governors who expect to leave their position close to their retirement age should be less motivated to boost their career prospects through favoring SOEs earlier in their term. Provincial governors (and provincial party secretaries) are at the Minister rank, and are ineligible for promotion to the next rank of Deputy State Leader after the age of 63 (Jiang and Zhang, Reference Jiang and Zhang2020).Footnote 18 Given that the average length of governor tenure from 2007 to 2015 is 4 years, incoming governors at the age of 59 and above would reasonably expect themselves to be likely to retire on the job. We therefore test whether governors starting their positions at age 59 and above exhibit different distribution of subsidies towardprivate firms as compared to other governors. This group of governors comprises of 10 governors in 10 provinces.Footnote 19 Using the same specifications as in the main analysis, with the exception of province fixed effects that is perfectly correlated with the governor turnover variable in each province in this small sample, we find evidence that the governors that commence their positions close to retirement age indeed behave differently with regards to subsidy distribution (Table A.13). Most notably, the private ownership dummy variable is statistically significant across several specifications (models (1), (4), (5)). It is also of larger coefficient size than the interaction term between governor turnover and firm private ownership, which is statistically insignificant across all models. This finding suggests that on average, private enterprises tend to receive the same amount or even more of the subsidies than SOEs of similar size and profitability, including in the year after governor turnover. In other words, governors assuming their positions close to their retirement do not make the effort to award subsidies disproportionately to SOEs in the earlier period of their tenure. We acknowledge that the total number of observations in this analysis is relatively small, and to address the small sample issue, we use an alternative triple interaction model that interacts a dummy variable indicating governors near retirement with governor turnover and firm ownership. We find these results (shown in Table A.14) consistent with our interpretation of the subgroup analysis shown in Table A.13.
Next, we look at governors’ career trajectories. We find that provincial governors who are promoted to the central government, or from provincial governor to provincial party secretary position after their tenure are more likely to have distributed more subsidies toward SOEs in the first two years after assuming their positions. Figure 2 shows the effect of turnover on firm subsidies in the first to fifth years after governor turnover for the subsample of governors promoted after their tenures compared with governors who are not. While private firms receive less subsidies than SOEs on average in the first and second years of governor tenure in the promoted governors sample (panel (a), Figure 2), there is no differential distribution of subsidies for governors in the “other” category (panel (b), Figure 2).Footnote 20
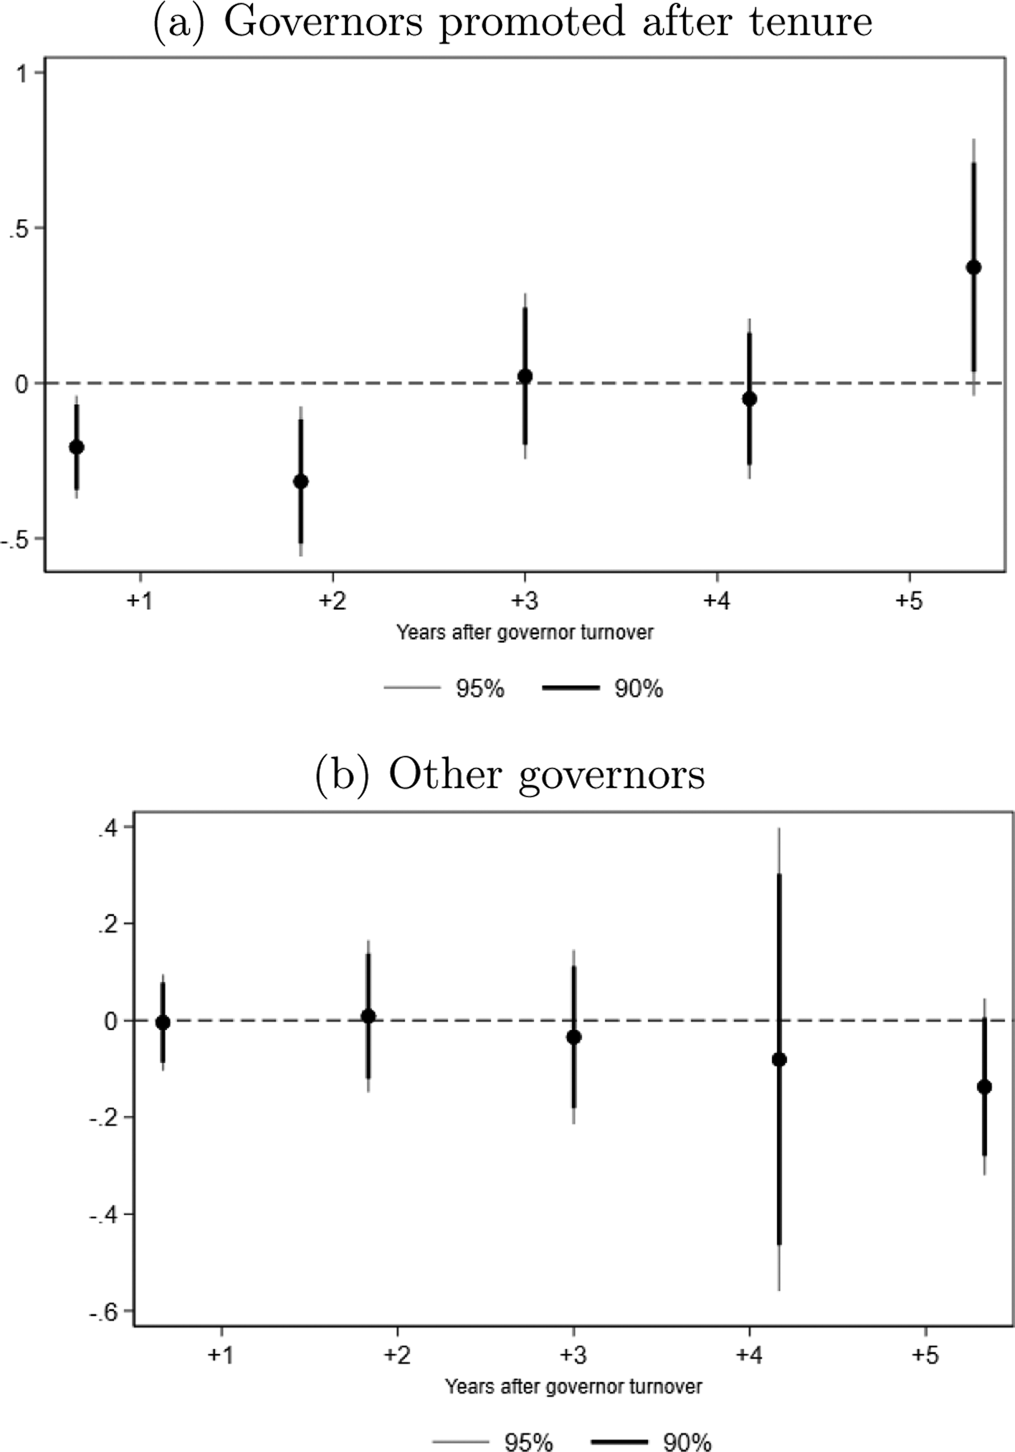
Fig. 2. Analysis on provincial governor subgroups: promoted versus not. (a) Governors promoted after tenure, (b) other governors. Notes: The y-axis represents the coefficient size for the interaction term between private enterprises and governor turnover (1–5 year(s) after turnover). Each coefficient is estimated from a separate model, with governor turnover lagged by 1–5 years respectively. Panel (a) includes governors who are promoted to other positions after their tenure. The “promoted” group (${\rm N} = 41$ ) includes governors promoted to the central government or provincial party secretary in their next position. Panel (b) includes all other governors (N=36), including those who would certainly retire after the current term (i.e., those starting their positions at age 59 and above).
7. Alternative explanation: distribution by merit
In our main analysis, we find that overall, more profitable firms do not necessarily receive more subsidies. But do governors distribute subsidies by merit in certain periods of their tenure? We next evaluate an alternative mechanism: new governors use firm performance (e.g., profit) as a metric to distribute subsidies, and firm performance happens to follow a pattern that coincides with political turnover. To explain the disadvantage that private firms have during the first two years of a governor turnover, this mechanism would suggest that: private firms happen to be less qualified for subsidies in the first two years of a governor's term due to poorer performance.
We test this alternative mechanism by studying subsidy distribution as a function of how long a new governor has taken office. Guided by the year-by-year results shown in Figure 1, we separate the sample into (i) all firms in provinces that have experienced a governor turnover within the last two years, and (ii) the rest. First, we find that on average, private firms are as profitable as SOEs of similar sizes within the same industry, same province, and same year. This is the case not only in sample (i), sample (ii), but also in the full dataset. We can therefore rule out the possibility that private firms are given smaller amounts of subsidies after turnover because they are less profitable during this period. The relevant analysis is shown in Figure A.6 and Table A.15.
We then examine whether profit levels affect the amount of subsidies received by private firms in these two time periods separately. We again divide our samples into two: (i) all firms in provinces that have experienced a governor turnover within the last two years, and (ii) the rest. In this analysis, the dependent variable is the same subsidy measure as in the main analysis. We use the same fixed effects specifications as the main analysis (model (5) of Table 2), but use an interaction term of the private firm indicator and firm profit (ROA) to test for the effect of ROA on subsidy for private firms.Footnote 21 Results are shown in Table 3. Our findings show that private firms that are more profitable tend to receive more subsidies on average, and that this effect is quite similar in samples (i) and (ii). The interaction term of private firms and ROA is consistently positive and statistically significant across the two samples, indicating that more profitable private firms always get more subsidies compared to less profitable ones, which is consistent with the special deal theory that all else equal, political leaders prefer to help more profitable firms (Bai et al., Reference Bai, Hsieh and Song2020). The coefficient on ROA is statistically significant and negative in both model (1) and model (2), indicating that SOEs that are in fact less profitable tend to receive more subsidies on average. In sum, we do not find that lower levels of profitability serve to explain why private firms tend to receive less subsidies in the first two years of a governor's term.
Table 3. Subsidy distribution: year 0–2 and 3 years or more after turnover

Notes: All specifications use the same subsidy measures used in the main analysis as the dependent variable. Total assets and ROA are lagged by 1 year. Robust standard errors clustered by province in parentheses. ***${\rm p}< 0.01$ , **${\rm p}< 0.05$
 , *${\rm p}< 0.1$
 .
.
8. Conclusion
Governments all over the world use stimulus packages to boost their economy, especially in times of crisis. Most recently, the United States passed a $\dollar 1.9$ trillion pandemic relief stimulus bill in March 2021, after having already installed two big stimulus packages in 2020. The Chinese government has also taken a series of large-scale stimulus measures to combat the economic impact of the pandemic.Footnote 22 A large portion of these stimulus packages target businesses and generate distributional impacts that affect big and small firms differently.
In this paper, we assess the impact of government stimulus on firms and its effect on local business–state relations in a period when the 2008 Chinese stimulus package was unleashed into the economy, paying special attention to local political turnover. We show that after a new provincial governor assumes position, private enterprises on average receive a significantly smaller amount of government subsidies, compared with SOEs among listed companies. This distribution pattern suggests that new governors, while learning about local economic and political conditions, use firm ownership information to make economic decisions that minimize political risks. Notably, this turnover effect is short-lived, waning after two years as new governors gain more local knowledge, after which private firms gain ground in receiving subsidies.
Our findings illustrate that the effect of fiscal stimulus—and more generally, economic policy—can be dynamic rather than static, and is conditional on political events such as political turnovers. Importantly, SOEs do not always maintain advantage over private firms in accessing government resources. The 2008 Chinese stimulus package benefits SOEs more than private firms, but only in the earlier years after a new governor takes office. In later years, private firms that are able to establish ties with new governors receive more subsidies and other government resources, while other private firms are not likely to receive more subsidies compared with connected private firms and SOEs. Therefore, governors’ economic policy making generates important distributional consequences across firm types and these distributional effects evolve over time.
One limitation of this research is that we do not have a direct measure of political risk and systematic evidence on special deals between politicians and firms. We welcome future work that explores these concepts more directly and offers a more comprehensive evaluation of mechanisms through which political rotations affect resource distribution. We also avoid making broad-stroke claims about how to best distribute government subsidies, because we would also have to bring in non-listed firms to systematically study how local governments should allocate subsidies to maximize efficiency, innovative capacity, or neediness among all firms in the same locality. Given data availability, our focus is only on publicly listed firms, which tend to be more politically connected than non-listed firms.
Importantly, government subsidies are not correlated with firm profits, suggesting that these government-administered subsidies can be a cause of misallocation of resources if firms that receive subsidies are less productive than their competitors on the margin (Rotemberg, Reference Rotemberg2019). We therefore see the behaviors of new governors as contributing to within-sector resource misallocation, although we acknowledge that the stimulus package was mainly aimed at boosting infrastructure investment rather than targeting short-term returns. How to make political turnover less costly for economic activity and more equal for all economic actors? How do firms respond more efficiently to uncertainties generated by political turnover? What happens to the special deals model after an anti-corruption campaign? These are all important questions for future research.
Supplementary material
The supplementary material for this article can be found at https://doi.org/10.1017/psrm.2022.52. Replication https://doi.org/10.7910/DVN/YOGI36
Acknowledgments
For helpful comments, we thank Yuen Yuen Ang, Quintin Beazer, Ling Chen, Shuo Chen, Hanming Fang, Avery Goldstein, Julia Gray, Guy Grossman, Rachel Hulvey, Junyan Jiang, Adrian Lam, Zhenhuan Lei, Wendy Leutert, Ming Li, Zeren Li, Adam Liu, Melanie Manion, Dan Mattingly, Jean Oi, Andy Walder and seminar participants at APSA 2021, SPSA 2020, NYU QSCC-4, Stanford China Social Science Workshop, and Penn Chinese Economy Working Group. We thank Naiyu Jiang for excellent research assistance.


 Open access