


I. INTRODUCTION
The laboratory-based divergent-beam X-ray diffractometer can provide a wealth of structural and microstructural information about a wide variety of materials. However, to successfully collect and interpret the data, the operator must have both a properly aligned instrument and take into consideration the aberrations inherent in the para-focusing optics. One method to accomplish this is to use standards to evaluate instrument performance. The National Institute of Standards and Technology (NIST) certifies a suite of Standard Reference Materials (SRMs) to address specific aspects of the performance of the powder diffractometer. This report describes SRM 640f, the seventh generation of this powder diffraction standard, which is certified with respect to the lattice parameter. It consists of approximately 7.5 g of silicon powder specifically prepared to have minimal line broadening and is commonly used for calibrating powder diffractometers for line position and line shape.
II. MATERIAL
The silicon feedstock for SRM 640f was prepared from ultra-high purity, intrinsic float-zone silicon boules with a resistivity of greater than 1000 Ω cm, obtained from Siltronic AG, Munich, Germany. (Certain commercial equipment, instruments, or materials are identified in order to adequately specify the experimental procedure. Such identification does not imply recommendation or endorsement by the NIST, nor does it imply that the materials or equipment identified are necessarily the best available for the purpose.) Lattice parameter measurements of the single-crystal silicon boules were performed on the NIST lattice comparison apparatus (Kessler et al., Reference Kessler, Henins, Deslattes, Nielsen and Arif1994). This provided a test of the material uniformity as well as an International System of Units (SI) traceable measurement of the lattice parameter from the as-supplied material. A total of 11 crystal samples were prepared from the boules, and a total of 32 lattice comparison measurements were performed along both the longitudinal (growth direction) and radial boule directions. The relative lattice parameter variation, Δd/d, of the input material from these measurements was ±4.7 × 10⁻⁸ (95% confidence level) verifying that the material was sufficiently uniform for use as a line position SRM to be certified for the lattice parameter (Kessler et al., Reference Kessler, Szabo, Cline, Henins, Hudson, Mendenhall and Vaudin2017). The average lattice spacing for the Si single-crystal boules was 0.543 101 9 nm.
The boules were then crushed and jet milled to a narrow particle size distribution between 1 and 10 μm. The comminution was performed by Hosokawa Micron Powder Systems, Summit, NJ. Typical particle size data from laser scattering measurements (Laser Scattering Particle Size Distribution Analyzer LA-950V2, Horiba, Ltd., Kyoto, Japan) are shown in Figure 1. The low end of the distribution being above 1 μm ensured that diffraction data from SRM 640f would have negligible size broadening. The resulting powder was annealed in 42 lots of approximately 200 g each to remove crystallographic defects that would otherwise lead to strain broadening. The annealing was performed in quartz boats under flowing gettered argon (Centorr Associates Model 2B gettering furnace) at a temperature of 1000 °C for 2 h (van Berkum et al., Reference van Berkum, Sprong, de Keijser, Delhez and Sonneveld1995). The furnace was evacuated and backfilled with argon three times to minimize oxygen levels before the start of each annealing run. In addition, an oxygen monitor (Ametek Oxygen Analyzer 3-SA) was placed in the outflow from the furnace to monitor oxygen levels within the furnace during annealing. This analyzer has a sensitivity of 0.001%, and during annealing, the oxygen sensor reads zero continuously. Bottling of the annealed powder was performed under argon to protect against humidity. Given that the starting material was single crystal, the powder consists of single-crystal particles. The combination of controlled particle size and the annealing operation rendered the microstructure of this Si powder appropriate for the characterization of the instrument profile function (IPF). Procedures associated with this characterization are discussed by Cline et al. (Reference Cline, Mendenhall, Black, Windover and Henins2015); the reader is also referred to Figure 38 therein which compares the full width at half maximum values of various SRMs determined from data collected on a divergent-beam instrument.
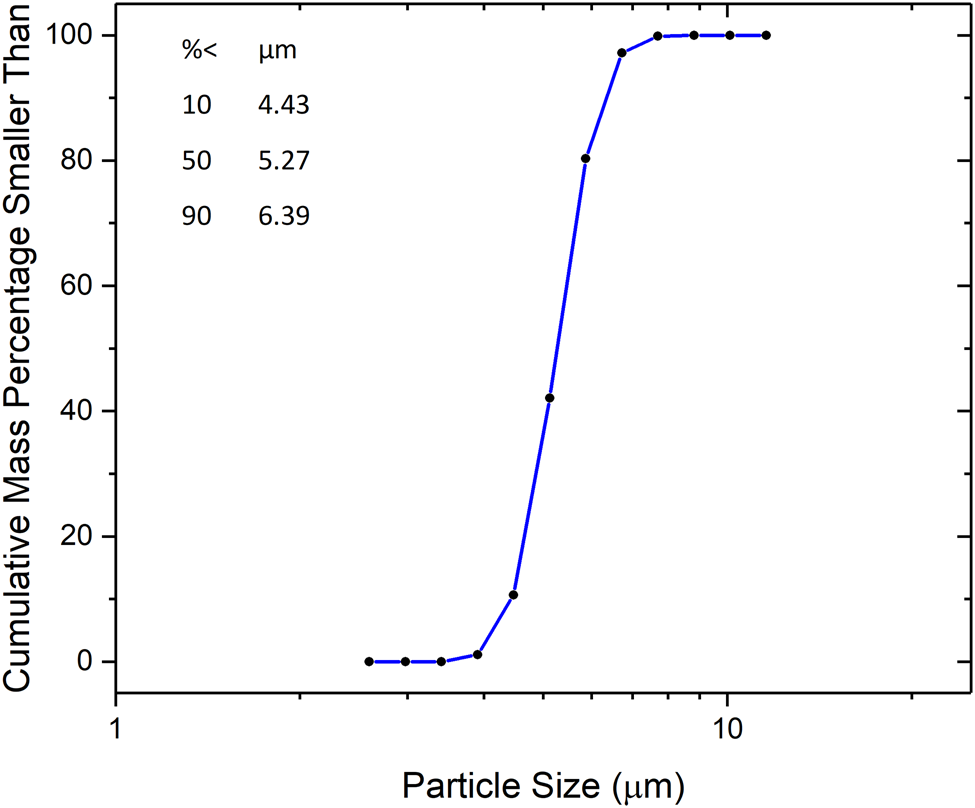
Figure 1. Particle size distribution of silicon feedstock.
In order to assess the crystallite size of SRM 640f, data were collected at the Advanced Photon Source on the 11BM high-resolution powder diffractometer (Wang et al., Reference Wang, Toby, Lee, Ribaud, Antao, Kurtz, Ramanathan, Von Dreele and Beno2008). The resolution of this machine is sufficiently high that a credible analysis of the crystallite size broadening of the silicon of SRM 640f could be performed. TOPAS (Bruker, 2017) was used to analyze the data using the fundamental parameters approach (FPA) method (Cheary and Coelho, Reference Cheary and Coelho1992) with Pawley fits to the data (Pawley, Reference Pawley1981). Included in the refinements was a parameter for Lorentzian broadening varying as 1/cosθ interpreted as crystallite size-induced broadening. This resulted in a volume-weighted mean crystallite size, 〈L〉vol, of 525 nm, based on an assumption of spherical crystallites. This degree of crystallite size broadening is undetectable on laboratory X-ray equipment. No strain broadening, using a Lorentzian profile varying with tanθ, could be detected.
III. EXPERIMENT
X-ray powder diffraction data were collected on a NIST-built diffractometer, the divergent-beam diffractometer, an instrument that includes several advanced design features. A full discussion of this machine, its alignment and calibration can be found in Cline et al. (Reference Cline, Mendenhall, Black, Windover and Henins2015, Reference Cline, Mendenhall, Black, Windover and Henins2018). The optical layout is that of a conventional divergent-beam Bragg–Brentano diffractometer equipped with a Johansson incident beam monochromator, sample spinner, and a position-sensitive detector (PSD).
Certification data were collected from 20 samples, 2 samples prepared with material extracted from each of the 10 randomly selected bottles. The 1.5 kW copper tube of fine focus geometry was operated at a power of 1.2 kW. The variable divergence incident slit was set to a nominal value of 0.9°. A 1.5° Soller slit was located in front of the PSD window to limit axial divergence; no Soller slits were used in the incident beam. The total scan time for each sample was approximately 2.5 h. The PSD was operated in the “picture taking” mode wherein data from the full length of the PSD window were recorded at each position in the scan. The window length was 14.4 mm, which is divided into 192 px of 75 μm each, and with a goniometer radius (R) of 217 mm, this corresponds to a 2θ range of 3.8°, and a 2θ angular resolution (1 px) of 0.02°. The data were recorded using a combination of coarse steps of 0.3152° 2θ and between each course step, four fine steps of 0.005° 2θ, which allowed for both timely data collection and high resolution. The machine was equipped with an automated anti-scatter slit located directly above the sample centerline to prevent air scatter of the incident beam from entering the PSD and contributing to the low angle background. Its height above the specimen was varied as αR/(2cosθ) where α is the full equatorial divergence angle of the incident beam. The diffractometer was located within a temperature-controlled laboratory space where the control of temperature over the time of a run was ±0.1 °C. The temperature was monitored using two 10 kΩ thermistors with a Hart/Fluke BlackStack system that was calibrated at the NIST temperature calibration facility (Vaughn and Strouse, Reference Vaughn and Strouse2001) to ±0.002 °C. The X-ray source was allowed to equilibrate at operating conditions for at least 1 h prior to recording any certification data. The performance of the machine was qualified with the use of NIST SRM 660c and SRM 676a using procedures discussed by Cline et al. (Reference Cline, Mendenhall, Black, Windover and Henins2015, Reference Cline, Mendenhall, Black, Windover and Henins2018).
IV. DATA ANALYSIS
Bragg–Brentano laboratory diffractometers are para-focusing and as such, the observed shapes of the profiles exhibit complexities due to the various optical aberrations inherent in the para-focusing geometry. Data from these diffractometers cannot be fit in a rigorous manner using analytical profile shape functions. The FPA was developed more than 25 years ago to address this difficulty. In this approach, the aberrations of the profiles are individually modeled and convoluted together to yield the calculated fit to the observation. This technique uses the full form of the CuKα emission spectrum as the basis for constructing the refined profile shapes.
The CuKα emission spectrum has been characterized in a manner traceable to the SI (BIPM, 2006) and provides the linkage of the refined lattice parameters to the SI (Mendenhall et al., Reference Mendenhall, Henins, Hudson, Szabo, Windover and Cline2017). The FPA also affords an additional dimension of internal consistency checks, as the models for the optical aberrations are parameterized based on physical aspects of the equipment, e.g. source size, axial divergence, and specimen transparency among others. Failure of the refined parameters to be consistent with the known instrument values for these parameters is indicative of difficulty. The Pawley approach to data analysis uses only the crystal symmetry to constrain the peak positions in accordance with the lattice parameter. Therefore, this approach offers the potential for improved fit quality when only the lattice parameters are of interest. Nonetheless, data were also analyzed with the Rietveld method as a check on data integrity.
The certification data were analyzed using the FPA method with Pawley refinements as implemented in TOPAS. Mendenhall et al. (Reference Mendenhall, Mullen and Cline2015) verified that TOPAS operated in accordance with published models for the FPA. This analysis used the energies of the CuKα emission spectrum as characterized by Mendenhall et al. (Reference Mendenhall, Henins, Hudson, Szabo, Windover and Cline2017). The optics of the divergent-beam diffractometer were modeled as a combination of a Johansson incident beam monochromator and a powder sample using the well-understood behavior of a two-crystal monochromator, where the sample acts as the second crystal. The resulting “bandpass” model provides a “window” function which modifies the intensity of the native copper emission line from the X-ray tube, effectively cutting off the Lorentzian tails, providing good agreement with the shape of the tails of the diffraction peaks. It also adds a dispersion term to the FPA emission model which contributes to the width of the modeled lines, resulting in a better match to the shape of the central part of the diffraction peaks (Mendenhall et al., Reference Mendenhall, Black and Cline2019). The parameters associated with the IPF, the position of the center of the bandpass window, the incident slit angle, and the Soller slit angles of the “full” axial divergence model (Cheary and Coelho, Reference Cheary and Coelho1998a, Reference Cheary and Coelho1998b) were refined using data from SRM 660c. SRM 660c was used to establish these instrument-specific parameters since the large attenuation of the LaB6 minimizes the sample absorption correction providing a better characterization of the IPF. These parameters were then fixed at the SRM 660c values for the subsequent analyses of SRM 640f. The sample dependent refined parameters included the scale factors, Chebyshev polynomial terms for the background, the lattice parameters, specimen displacement and attenuation terms, and a term for Lorentzian size broadening. The results from the Pawley analyses were used to obtain the certified lattice parameters. The refined lattice parameters were individually adjusted using the coefficient of thermal expansion values found by Schödel and Bönsch (Reference Schödel and Bönsch2001) to values at 22.5 °C, and shown in Table I. The corresponding peak positions are not certified but given in Table II as informational values only.
TABLE I. Certification data for SRM 640f.

TABLE II. Information values for peak positions computed for SRM 640f using CuKα radiation, λ = 0.15405929 nm.
Uncertainties in the data were analyzed in the context of both type A, assigned by statistical analysis, and type B, based on knowledge of the nature of uncertainties in the measurements, to result in robust uncertainties for the certified values (Taylor and Kuyatt, Reference Taylor and Kuyatt1994; JCGM 100, 2008). The statistical analysis of the data indicated that the mean of the measurements was 0.543 114 4 nm with a k = 2 type A expanded uncertainty of 0.000 000 54 nm. However, a type B uncertainty due to systematic uncertainty must be incorporated into the uncertainty bounds of the certified lattice parameter. In order to estimate the magnitude of the systematic uncertainty, a comparison was made between the single lattice parameter obtained from the global Pawley analysis and the lattice parameters obtained from the refinement of the individual profiles from each sample, i.e. 20 samples with 11 peaks yielding 330 individual lattice parameter values. In the absence of any systematic uncertainty, there would be no variation in the lattice parameters obtained from the whole pattern method and those obtained using the individual profiles. A more detailed description is given by Black et al. (Reference Black, Mendenhall, Brown, Henins, Filliben and Cline2020). The results from this analysis are shown in Figure 2. The consideration of these data leads to an assignment of a type B uncertainty of ±0.000 008 nm.

Figure 2. Difference between the lattice parameter determined from the “whole pattern” Pawley method vs. that obtained from the individual profiles. Error bars indicate one standard deviation.
The certified lattice parameter value of 0.543 114 4 nm is significantly larger than the value of 0.543 101 9 nm obtained from the single-crystal boules. This discrepancy is thought to be because of the native oxide layer on the surface of the silicon particles. This surface oxide layer is under compression (EerNisse EP, Reference EerNisse1979) and, therefore, produces a hydrostatic tensile stress on the crystallites themselves. This dilates the lattice and leads to the larger measured lattice parameter value for the silicon powder.
V. CONCLUSION
A NIST-built divergent-beam diffractometer, incorporating many advanced design features, has been used to certify the lattice parameter of silicon powder for SRM 640f. The powder was specifically prepared to minimize the effects of size and strain broadening to facilitate the development of the IPF. Both type A, statistical, and type B, systematic, errors have been assigned to yield a certified value for the lattice parameter of a = 0.5431144 ± 0.000008 nm at 22.5 °C.
ACKNOWLEDGEMENTS
The use of the Advanced Photon Source at Argonne National Laboratory was supported by the U.S. Department of Energy, Office of Science, Office of Basic Energy Sciences, under Contract No. DE-AC02-06CH11357.
DATA DEPOSIT
Diffraction data has been uploaded here: https://doi.org/10.18434/M32251.


