


I. INTRODUCTION
Ethynodiol diacetate (also known and spelled as etynodiol diacetate, sold under the brand names Ovulen, Femulen, and Continuin among others) is a progestin used in birth control pills and functions in preventing ovulation. The systematic name (CAS Registry Number 297-76-7; C24H32O4, 384.26 g/mol) is [(3S,8R,9S,10R,13S,14S,17R)-17-acetyloxy-17-ethynyl-13-methyl-2,3,6,7,8,9,10,11,12,14,15,16-dodecahydro-1H-cyclopenta[a]phenanthren-3-yl] acetate. A two-dimensional molecular diagram of ethynodiol diacetate is shown in Figure 1.
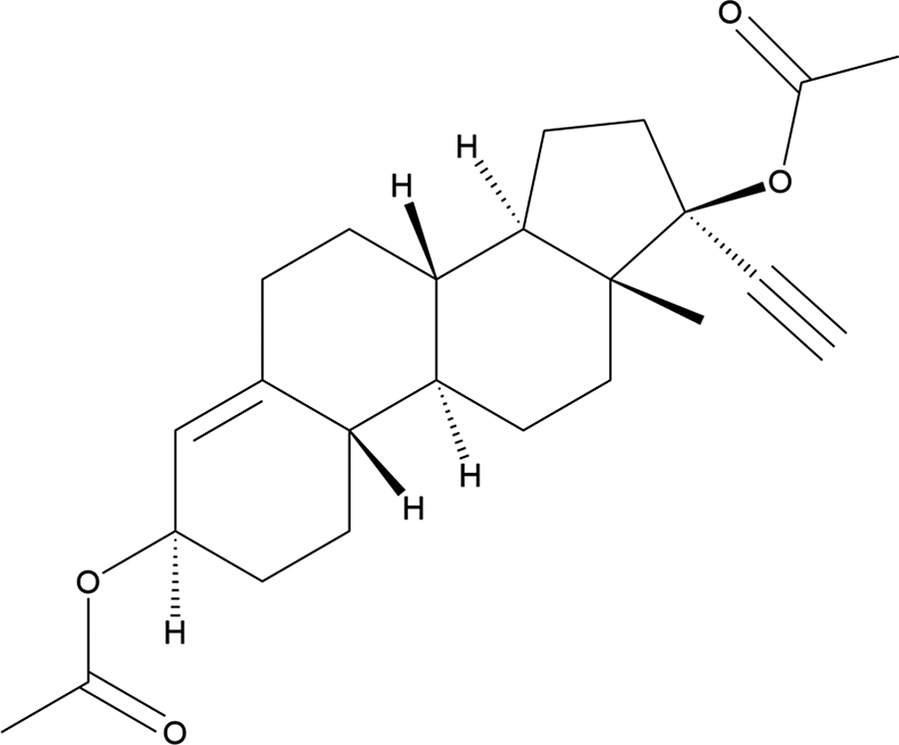
Figure 1. The two-dimensional structure of ethynodiol diacetate.
Ethynodiol diacetate was described as a potent oral inhibitor of ovulation by Pincus et al. (Reference Pincus, Garcia, Paniagua and Shephard1962). The crystal structure of a biotransformation product of ethynodiol diacetate was reported by Zafar et al. (Reference Zafar, Yousuf, Kayani, Saifullah, Khan, Al-Majid and Choudhary2012). Crystal structures of many related compounds (particularly with a carbonyl group on the 6-membered ring of the steroid system at what we name C23) have been reported, but we are unaware of any published crystal structures or powder diffraction data for ethynodiol diacetate.
This work was carried out as part of a project (Kaduk et al., Reference Kaduk, Crowder, Zhong, Fawcett and Suchomel2014) to determine the crystal structures of large-volume commercial pharmaceuticals and include high-quality powder diffraction data for them in the Powder Diffraction File (Kabekkodu et al., Reference Kabekkodu, Dosen and Blanton2024).
II. EXPERIMENTAL
Ethynodiol diacetate was a commercial reagent, purchased from TargetMol (Batch #T0996), and was used as received. The white powder was packed into a 0.5-mm-diameter Kapton capillary and rotated during the measurement at ~2 Hz. The powder pattern was measured at 298(1) K at the Wiggler Low Energy Beamline (Leontowich et al., Reference Leontowich, Gomez, Diaz Moreno, Muir, Spasyuk, King, Reid, Kim and Kycia2021) of the Brockhouse X-ray Diffraction and Scattering Sector of the Canadian Light Source using a wavelength of 0.819826(2) Å (15.1 keV) from 1.6 to 75.0° 2θ with a step size of 0.0025° and an overall collection time of 3 minutes. The high-resolution powder diffraction data were collected using eight Dectris Mythen2 X series 1 K linear strip detectors. NIST SRM 660b LaB6 was used to calibrate the instrument and refine the monochromatic wavelength used in the experiment.
The pattern was indexed using N-TREOR as incorporated into EXPO2014 (Altomare et al., Reference Altomare, Cuocci, Giacovazzo, Moliterni, Rizzi, Corriero and Falcicchio2013) on a primitive monoclinic unit cell with a = 17.41661, b = 7.25165, c = 19.61664 Å, β = 116.233°, V = 2,222.4 Å3, and Z = 4. The suggested space group was P21, which was confirmed by the successful solution and refinement of the structure. A reduced cell search of the Cambridge Structural Database (Groom et al., Reference Groom, Bruno, Lightfoot and Ward2016) yielded 4 hits, but no structures of ethynodiol diacetate or its derivatives.
An ethynodiol diacetate molecule was downloaded from PubChem (Kim et al., Reference Kim, Chen, Cheng, Gindulyte, He, He and Li2023) as Conformer3D_COMPOUND_CID_9270.sdf. It was converted to a *.mol2 file using Mercury (Macrae et al., Reference Macrae, Sovago, Cottrell, Galek, McCabe, Pidcock and Platings2020) and into a Fenske–Hall Z-matrix using OpenBabel (O’Boyle et al., Reference O’Boyle, Banck, James, Morley, Vandermeersch and Hutchison2011). The crystal structure was solved using parallel tempering as implemented in FOX (Favre-Nicolin and Černý, Reference Favre-Nicolin and Černý2002), using (sinθ/λ)max = 0.32 Å−1 and two ethynodiol diacetate molecules as fragments.
Rietveld refinement was carried out with General Structure Analysis System, II (GSAS-II) (Toby and Von Dreele, Reference Toby and Von Dreele2013). Only the 2.0–37.0° portion of the pattern was included in the refinements (d min = 1.292 Å). The y-coordinate of O1 was fixed to define the origin. All non-H bond distances and angles were subjected to restraints, based on a Mercury Mogul Geometry Check (Bruno et al., Reference Bruno, Cole, Kessler, Luo, Motherwell, Purkis and Smith2004; Sykes et al., Reference Sykes, McCabe, Allen, Battle, Bruno and Wood2011). The Mogul average and standard deviation for each quantity were used as the restraint parameters. The restraints contributed 5.5% to the overall χ2. The hydrogen atoms were included in calculated positions, which were recalculated during the refinement using Materials Studio (Dassault Systèmes, 2023). The U iso of the heavy atoms were grouped by chemical similarity. The U iso for the H atoms were fixed at 1.3× the U iso of the heavy atoms to which they are attached. The peak profiles were described using a uniaxial microstrain model, with [010] as the unique axis. The background was modeled using a 6-term shifted Chebyshev polynomial, with peaks at 3.02 and 10.20° to model the narrow and broad scattering from the Kapton capillary and any amorphous component.
The final refinement of 197 variables using 14,001 observations and 158 restraints yielded the residual R wp = 0.05683. The largest peak (1.93 Å from C82) and hole (2.01 Å from C71) in the difference Fourier map were 0.29(8) and −0.30(8) eÅ−3, respectively. The final Rietveld plot is shown in Figure 2. The largest features in the normalized error plot are in the asymmetries, shapes, and positions of some of the strong low-angle peaks. These misfits probably indicate subtle changes in the specimen during the measurement.
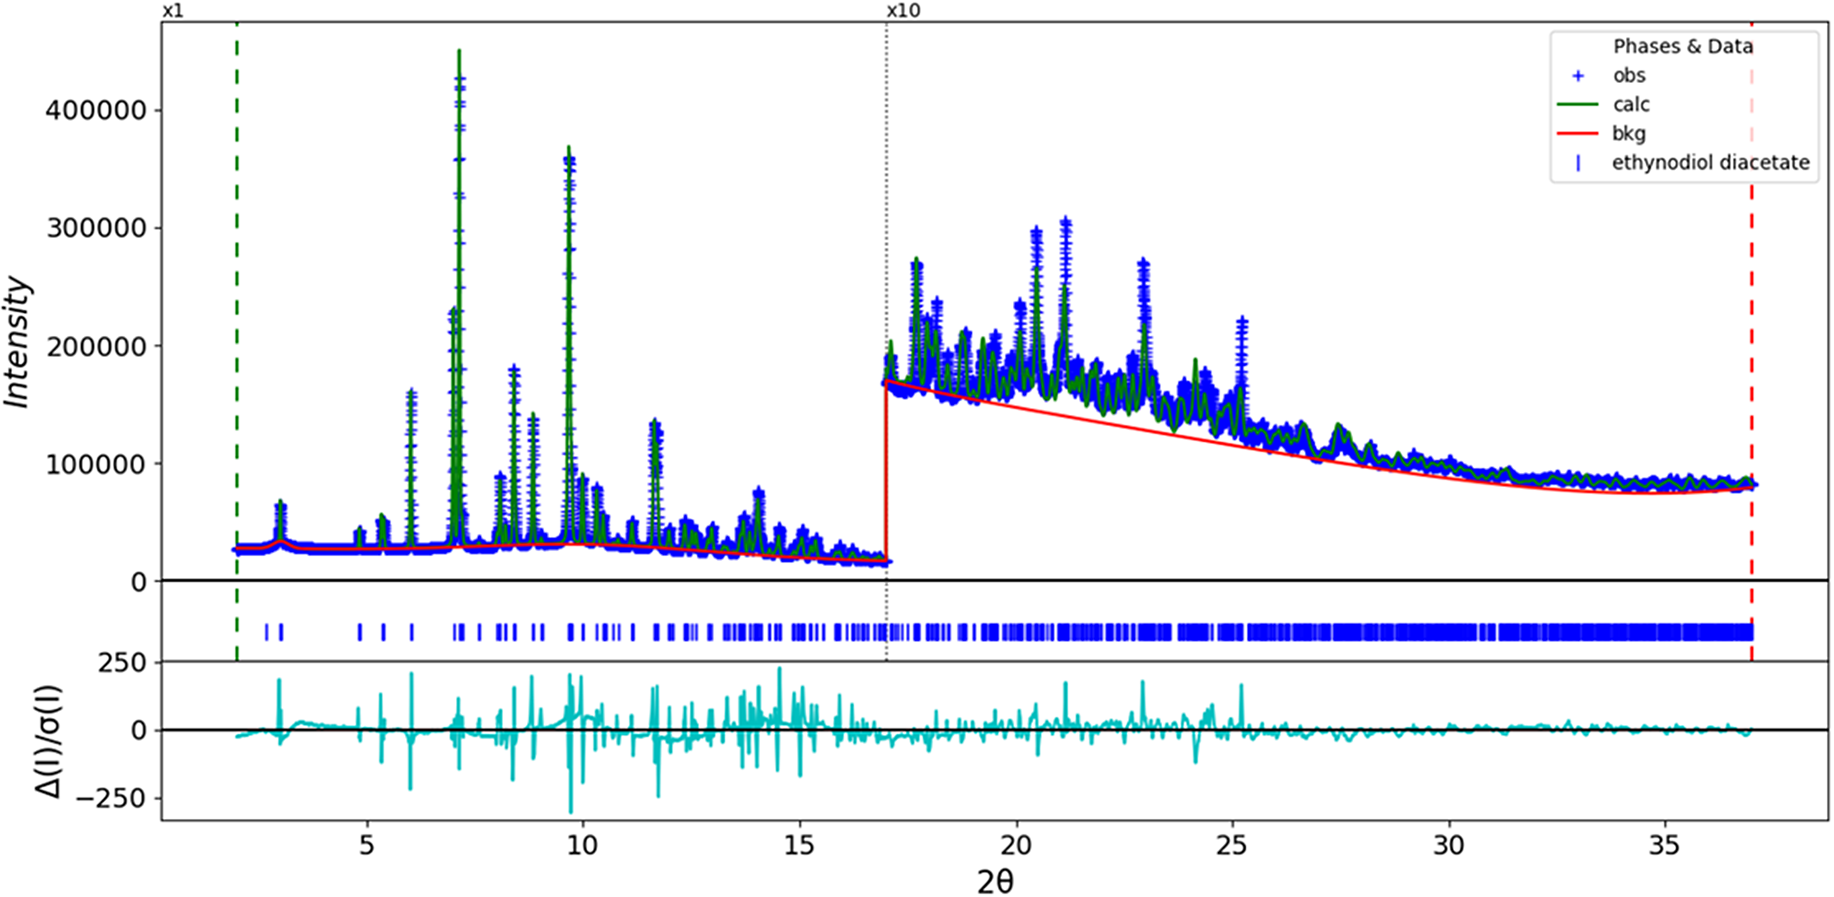
Figure 2. The Rietveld plot for ethynodiol diacetate. The blue crosses represent the observed data points, and the green line is the calculated pattern. The cyan curve is the normalized error plot, and the red line is the background curve. The blue tick marks indicate the ethynodiol diacetate peak positions. The vertical scale has been multiplied by a factor of 10× for 2θ > 17.0̊.
The crystal structure of ethynodiol diacetate was optimized (fixed experimental unit cell) with density functional theory techniques using Vienna ab initio simulation package (VASP) (Kresse and Furthmüller, Reference Kresse and Furthmüller1996) through the MedeA graphical interface (Materials Design, 2024). The calculation was carried out on 32 cores of a 144-core (768 GB memory) HPE Superdome Flex 280 Linux server at North Central College. The calculation used the generalized gradient approximation with the Perdew–Burke–Ernzerhof functional (GGA-PBE) functional, a plane-wave cutoff energy of 400.0 eV and a k-point spacing of 0.5 Å−1 leading to a 1 × 2 × 1 mesh and took ~32.2 hours. Single-point density functional calculations (fixed experimental cell) and population analysis were carried out using CRYSTAL23 (Erba et al., Reference Erba, Desmarais, Casassa, Civalleri, Donà, Bush and Searle2023). The basis sets for the H, C, and O atoms in the calculation were those of Gatti et al. (Reference Gatti, Saunders and Roetti1994). The calculations were run on a 3.5-GHz PC using 8 k-points and the Becke, three-parameter, Lee–Yang–Parr (B3LYP) functional and took ∼7.3 hr.
III. RESULTS AND DISCUSSION
There are two independent ethynodiol diacetate molecules in the asymmetric unit. The root-mean-square (rms) difference of the non-H atoms in the Rietveld-refined and VASP-optimized structures was calculated using the Mercury CSD-Materials/Search/Crystal Packing Similarity tool is 0.462 Å (Figure 3). The rms Cartesian displacements of the non-H atoms in the Rietveld-refined and VASP-optimized structures of molecule 1 and molecule 2, calculated using the Mercury Calculate/Molecule Overlay tool, are 0.261 and 0.309 Å (Figures 4 and 5). The largest differences are in the acetate side chains at the periphery of the molecules. The agreements are at the upper end of the normal range for correct structures (van de Streek and Neumann, Reference van de Streek and Neumann2014). The asymmetric unit is illustrated in Figure 6. The U iso of the acetate group O2/O4/C27/C28 in molecule 1 are larger than those of the other atoms and may indicate a disorder of this side chain. Since we need an ordered model to carry out the DFT optimization, we chose to refine an ordered model, rather than attempt to model any disorder. The remaining discussion will emphasize the VASP-optimized structure.
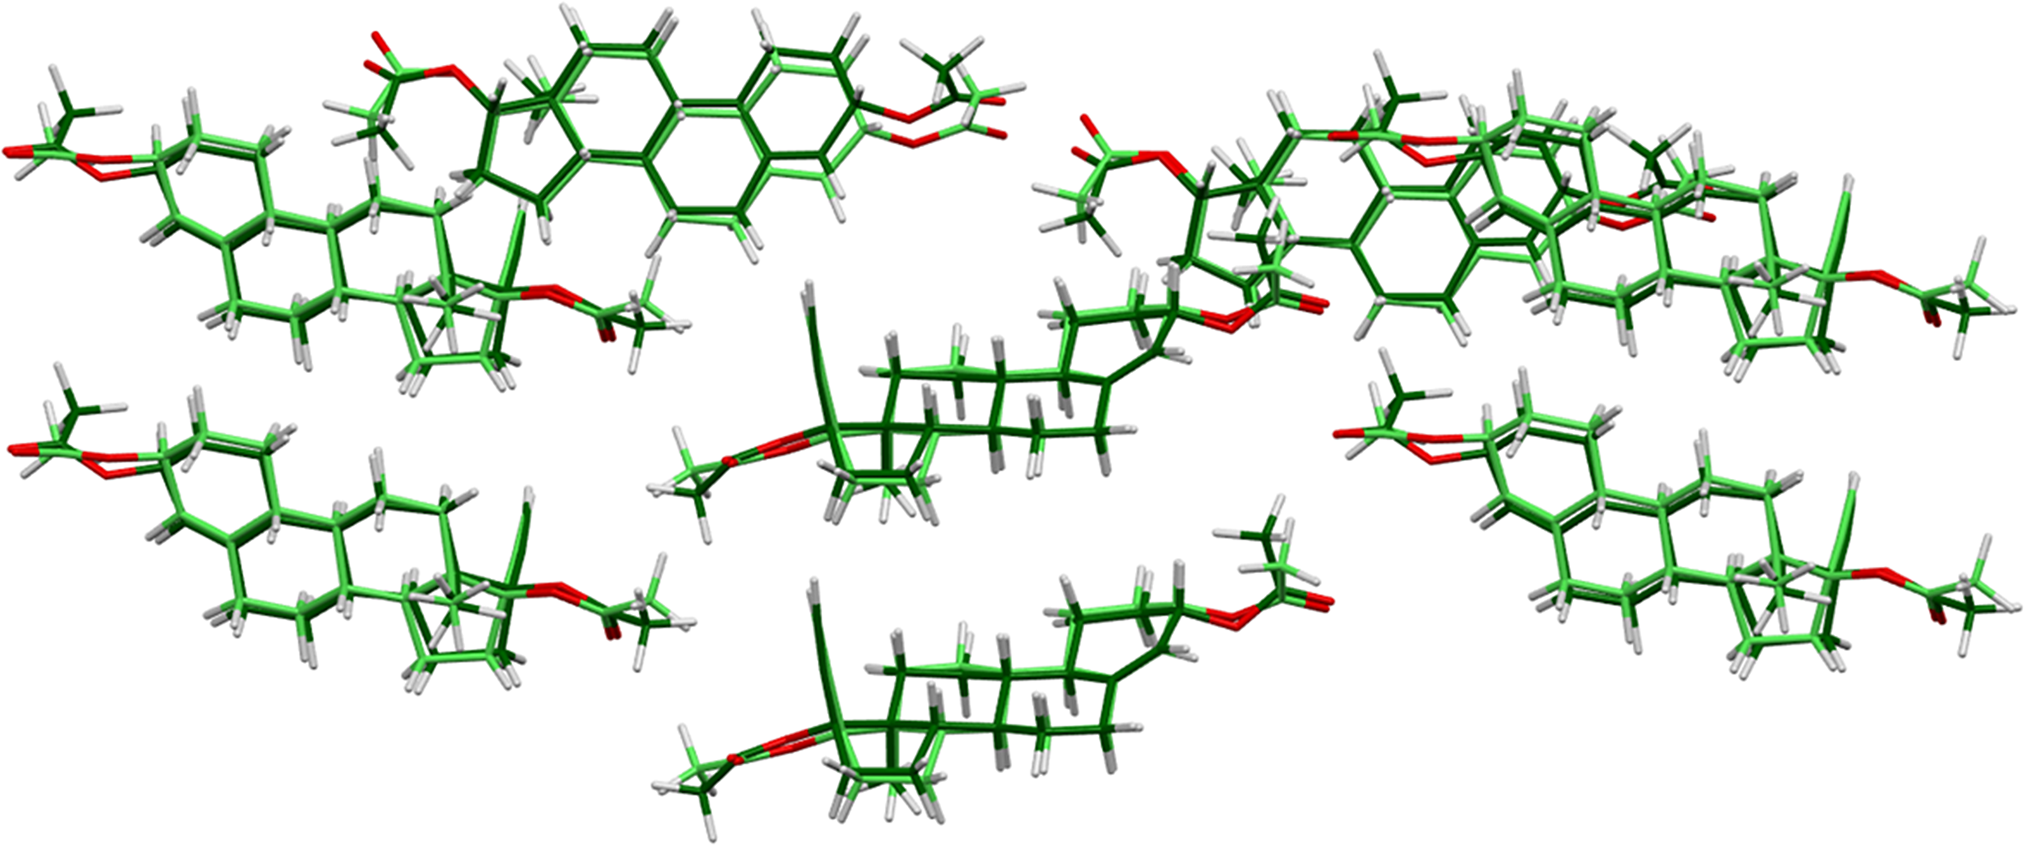
Figure 3. Comparison of the Rietveld-refined (colored by atom type) and VASP-optimized (light green) structures of ethynodiol diacetate, calculated using the Mercury CSD-Materials/Search/Crystal Packing Similarity tool. The root-mean-square Cartesian displacement is 0.462 Å. Image generated using Mercury (Macrae et al., Reference Macrae, Sovago, Cottrell, Galek, McCabe, Pidcock and Platings2020).
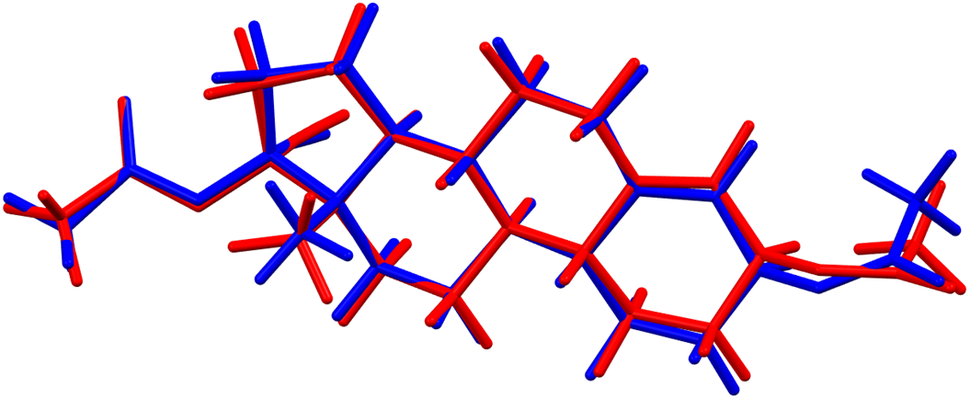
Figure 4. Comparison of the Rietveld-refined (red) and VASP-optimized (blue) structures of molecule 1 in ethynodiol diacetate. The root-mean-square Cartesian displacement is 0.261 Å. Image generated using Mercury (Macrae et al., Reference Macrae, Sovago, Cottrell, Galek, McCabe, Pidcock and Platings2020).
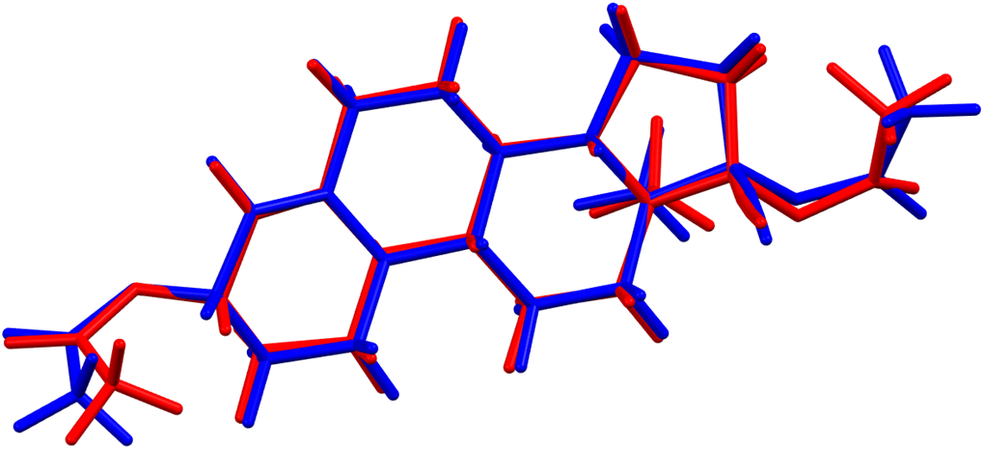
Figure 5. Comparison of the Rietveld-refined (red) and VASP-optimized (blue) structures of molecule 2 in ethynodiol diacetate. The root-mean-square Cartesian displacement is 0.309 Å. Image generated using Mercury (Macrae et al., Reference Macrae, Sovago, Cottrell, Galek, McCabe, Pidcock and Platings2020).
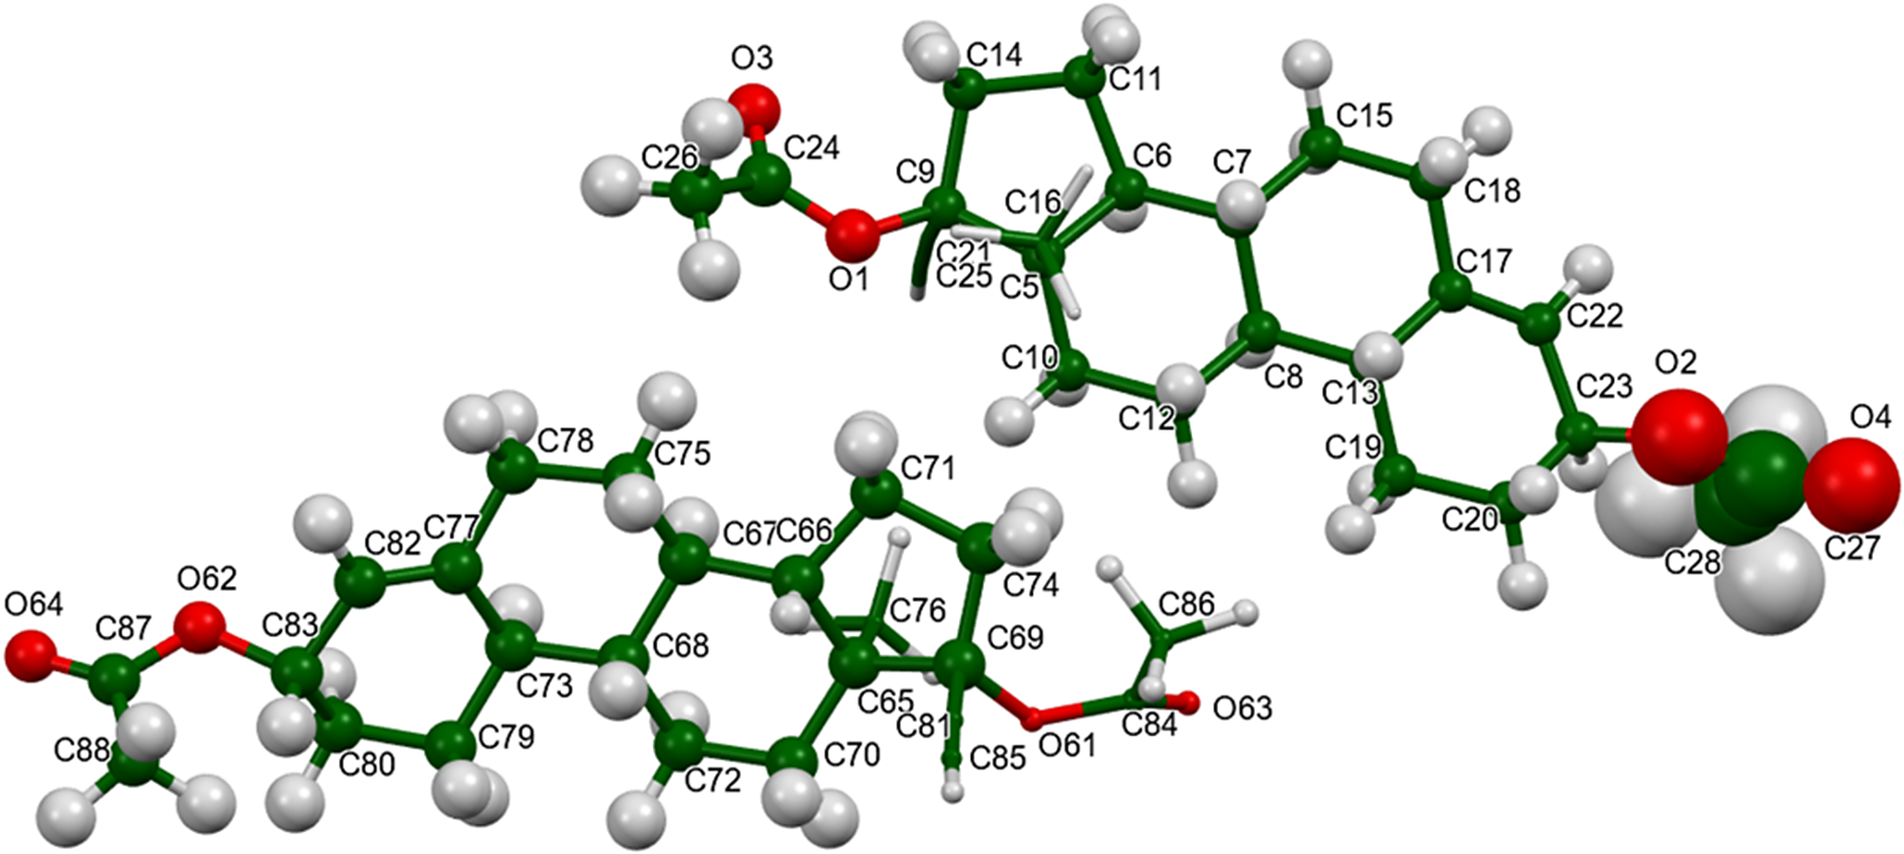
Figure 6. The asymmetric unit of ethynodiol diacetate, with the atom numbering. The atoms are represented by 50% probability spheroids. Image generated using Mercury (Macrae et al., Reference Macrae, Sovago, Cottrell, Galek, McCabe, Pidcock and Platings2020).
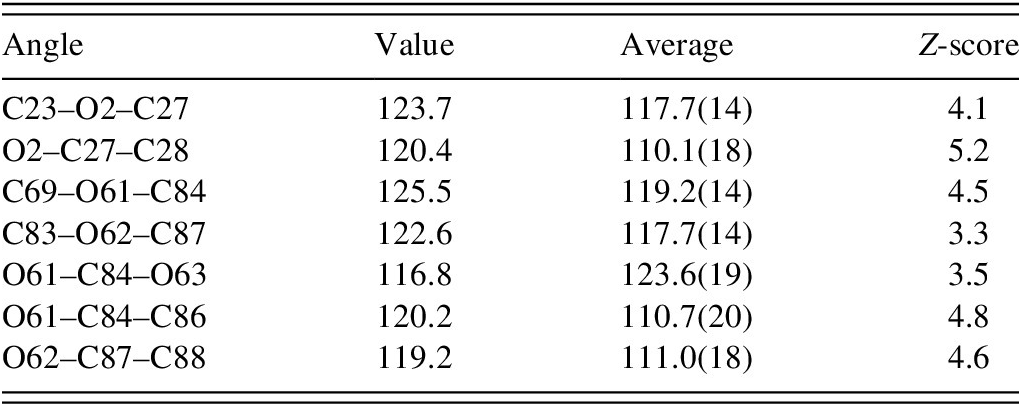
All of the bond distances and most of the bond angles and torsion angles fall within the normal ranges indicated by a Mercury Mogul Geometry check (Macrae et al., Reference Macrae, Sovago, Cottrell, Galek, McCabe, Pidcock and Platings2020). The unusual bond angles are reported in Table I. All of the unusual angles occur in the acetate side chains. Torsion angles involving rotation about the C9–C21 and C69–C81 bonds have few/no hits, the result of the cyano groups. Torsion angles involving rotation about the O2–C27, O61–C84, and O62–C87 bonds are flagged as unusual and occur on the tails of 0/180° peaks in the distributions of similar torsion angles. These occur in the acetate side chains. The acetate groups seem to be unusual.
TABLE I. Unusual bond angles (Mogul) in ethynodiol diacetate
The two molecules have different conformations (Figure 7). The rms difference is 0.782 Å, and the major differences are in the conformations of the acetate groups. Quantum chemical geometry optimizations of isolated ethynodiol diacetate molecules (DFT/B3LYP/6-31G*/water) using Spartan’24 (Wavefunction, Inc., 2023) indicated that the two molecules are essentially identical in energy and converge to the same local minimum. The global minimum-energy conformation (Merck molecular force field [MMFF] force field) is 10.2 kcal/mol lower in energy and has a more linear orientation of the acetate group on the 6 ring. Even though weak, intermolecular interactions apparently affect the solid-state conformations.
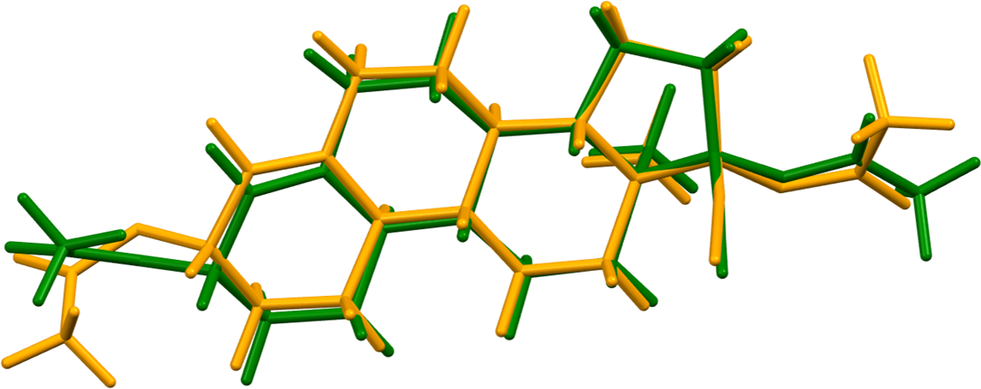
Figure 7. Comparison of molecule 1 (green) and molecule 2 (orange) of ethynodiol diacetate. Image generated using Mercury (Macrae et al., Reference Macrae, Sovago, Cottrell, Galek, McCabe, Pidcock and Platings2020).
The crystal structure (Figures 8 and 9) consists of alternating layers of molecule 1 and molecule 2 parallel to the (101) plane. The mean planes of molecules 1 and 2 are approximately (6, −7, 16) and (6, −2, 7), respectively. Analysis of the contributions to the total crystal energy of the structure using the Forcite module of Materials Studio (Dassault Systèmes, 2023) indicates that the intramolecular energy is dominated by angle distortion terms (as expected for a fused ring system), but that bond and torsion terms are also significant. The intermolecular energy is dominated by electrostatic attractions.
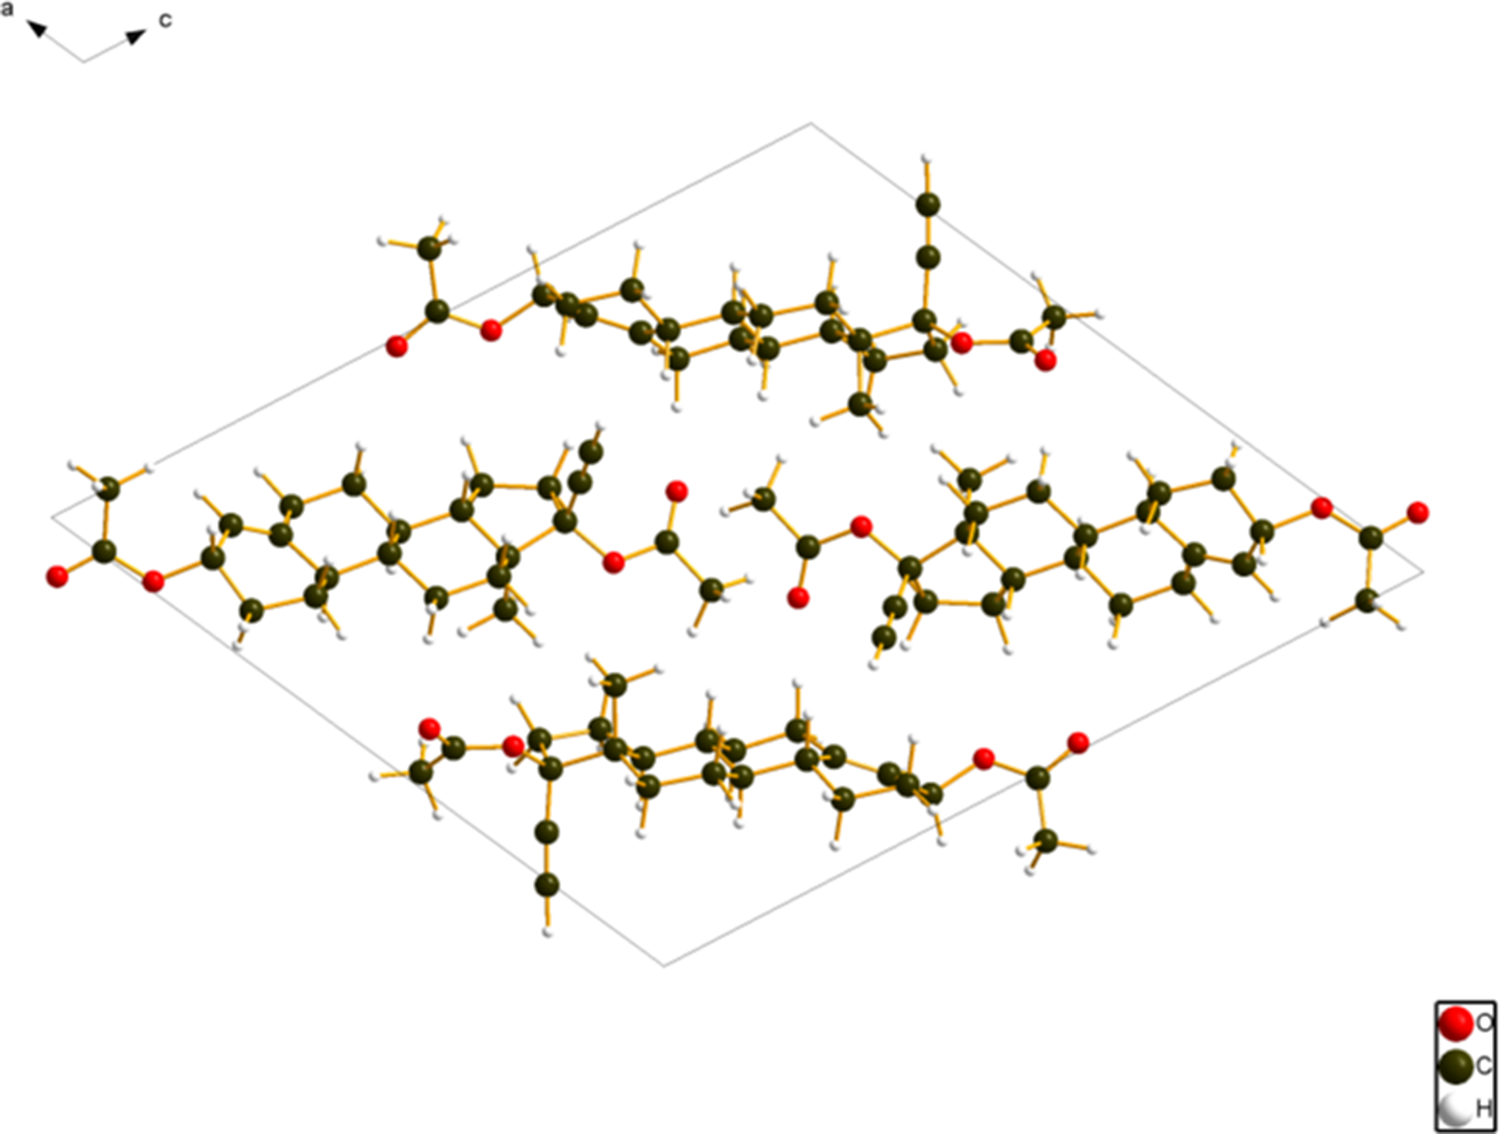
Figure 8. The crystal structure of ethynodiol diacetate viewed down the b-axis. Image generated using Diamond (Crystal Impact, 2023).
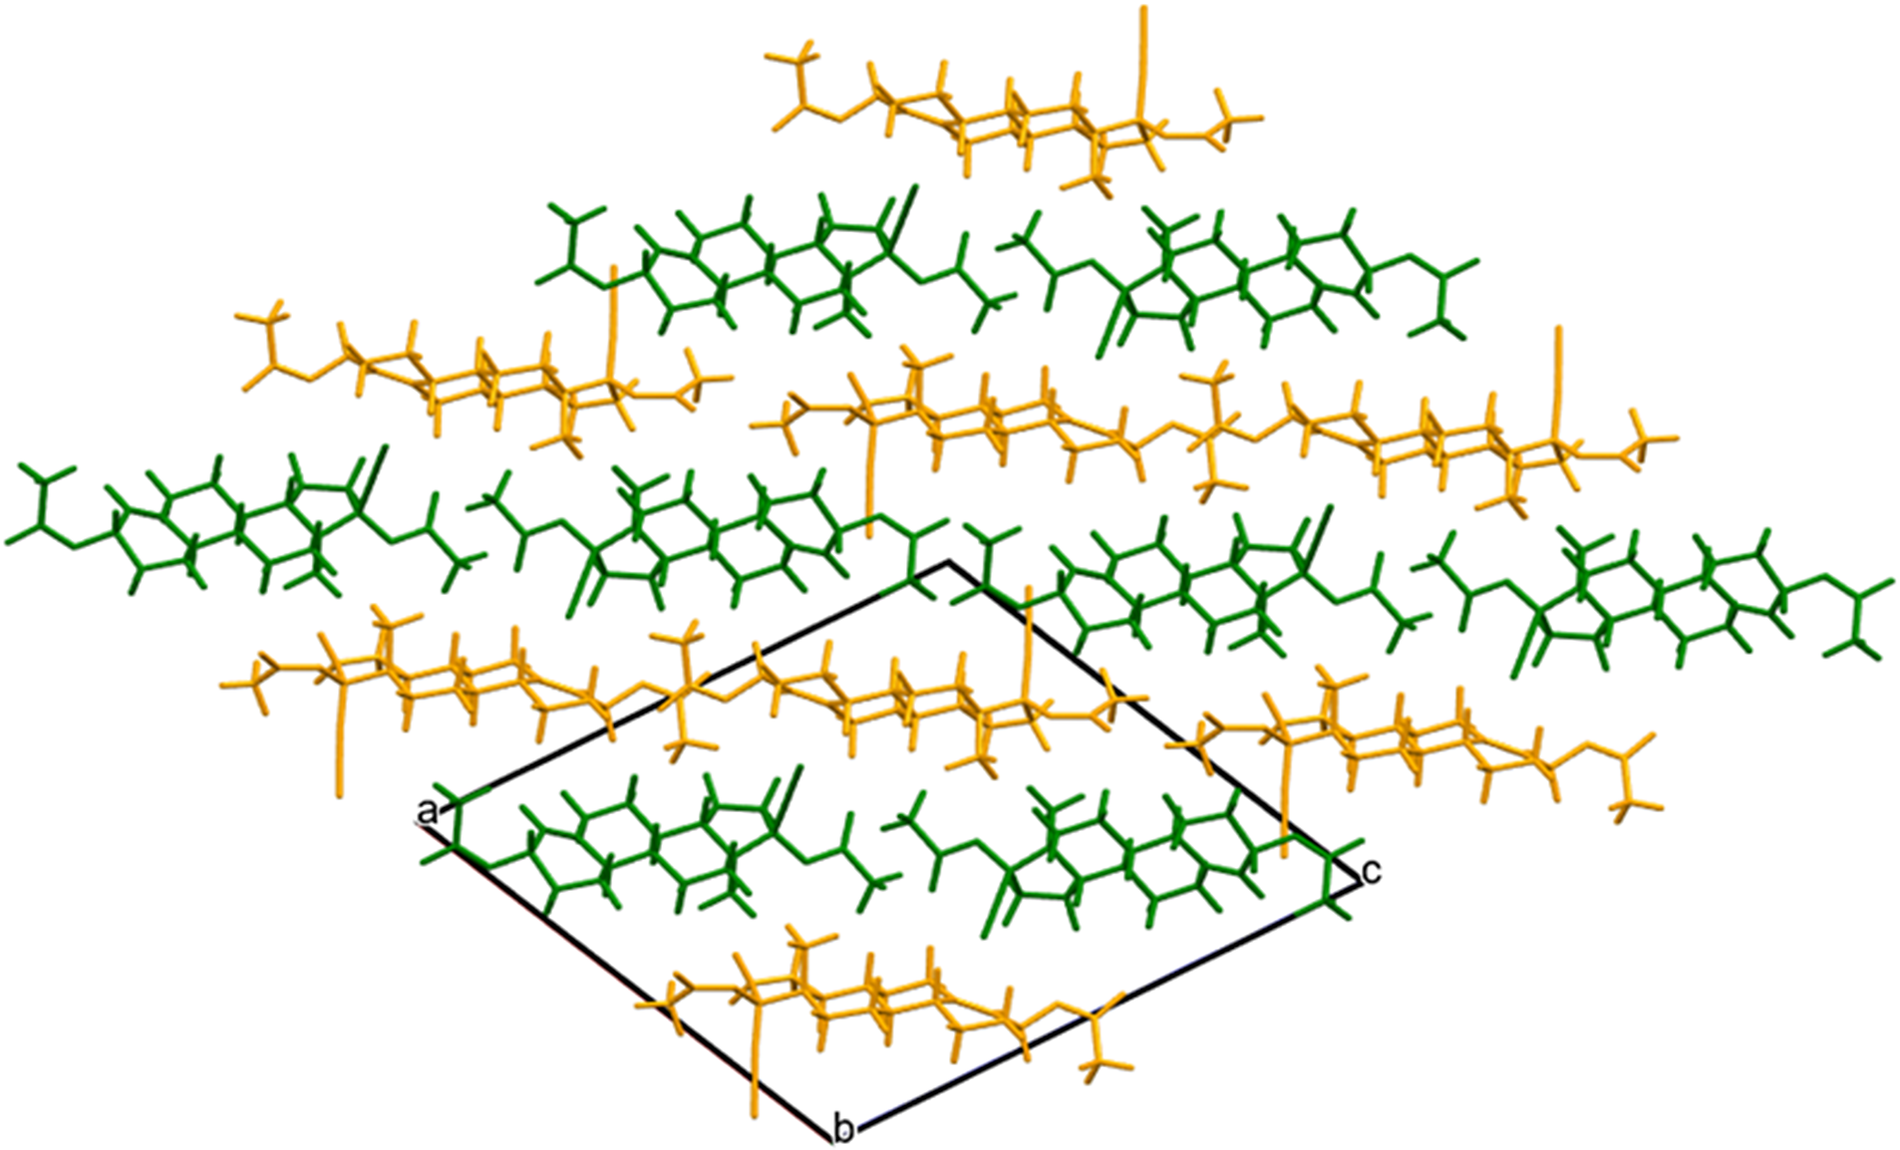
Figure 9. The crystal structure of ethynodiol diacetate, viewed down the b-axis. Molecule 1 is in green, and molecule 2 is in orange. Image generated using Mercury (Macrae et al., Reference Macrae, Sovago, Cottrell, Galek, McCabe, Pidcock and Platings2020).
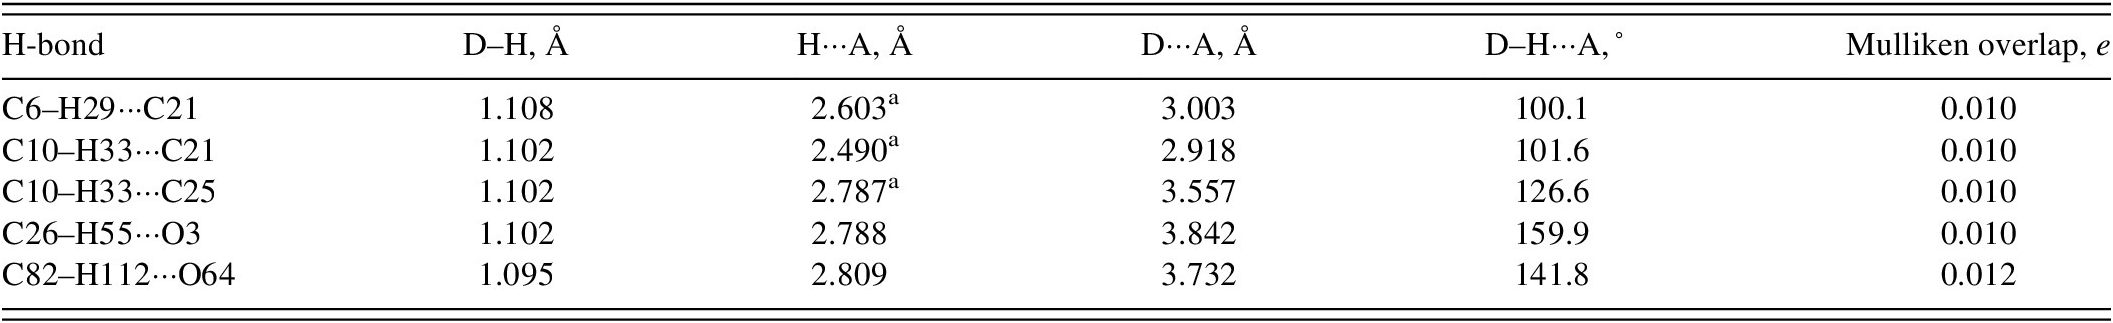
There are no classical hydrogen bonds in the structure (Table II). Only a small number of C–H···O and C–H···C (involving the cyano groups) hydrogen bonds represent directional interactions among the molecules. Fingerprint plots (Spackman et al., Reference Spackman, Turner, McKinnon, Wolff, Grimwood, Jayatilaka and Spackman2021) indicate that H···H contacts make up 66.66% of the intermolecular contacts (Figure 10) and that O···H contacts make up 13.4% of the interactions. The molecules do not interact strongly with each other.
TABLE II. Hydrogen bonds (CRYSTAL23) in ethynodiol diacetate
a Intramolecular.
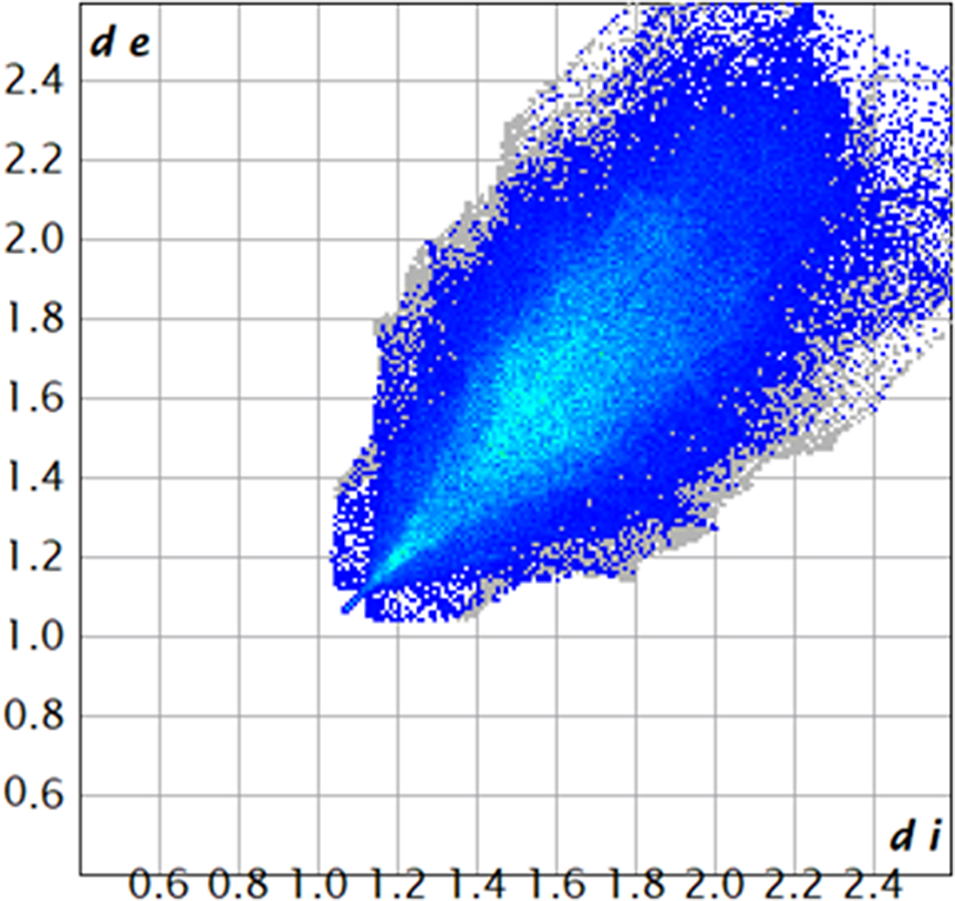
Figure 10. A fingerprint plot for ethynodiol diacetate, illustrating the H···H contacts. Image generated using CrystalExplorer (Spackman et al., Reference Spackman, Turner, McKinnon, Wolff, Grimwood, Jayatilaka and Spackman2021). de is the distance from the Hirshfeld surface to the nearest nucleus outside the surface. di is the corresponding distance to the nearest nucleus inside the surface. The blue and cyan points represent H···H contacts, and the total area of these contacts is 66.66% of the area of the Hirshfeld surface.
The volume enclosed by the Hirshfeld surface of ethynodiol diacetate (Figure 11; Hirshfeld, Reference Hirshfeld1977; Spackman et al., Reference Spackman, Turner, McKinnon, Wolff, Grimwood, Jayatilaka and Spackman2021) is 1098.90 Å3, 98.98% of 1/2 of the unit cell volume. The packing density is lower than normal, reflected by the low density of 1.150 g/cm3. There are very few close contacts (red in Figure 11). The volume/non-hydrogen atom is larger than normal at 19.8 Å3.
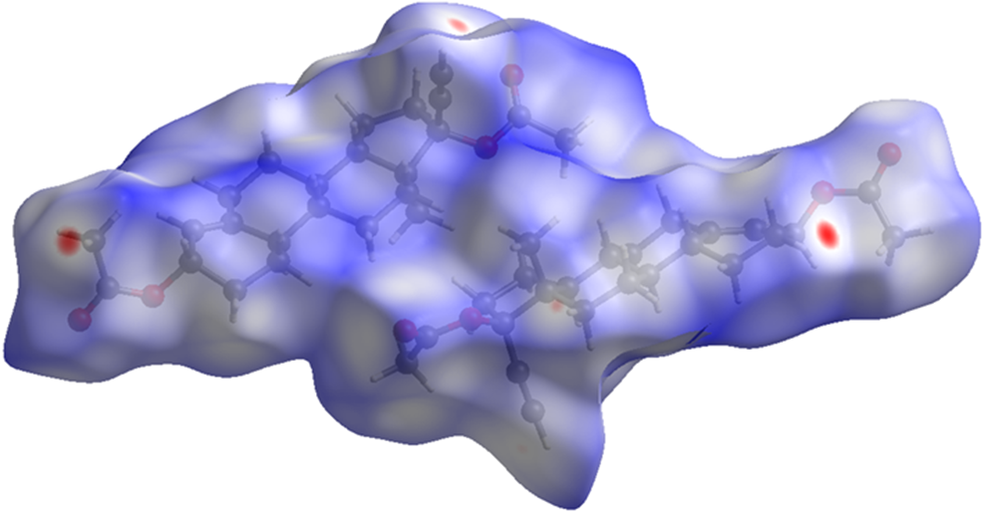
Figure 11. The Hirshfeld surface of odiol diacetate. Intermolecular contacts longer than the sums of the van der Waals radii are colored blue, and contacts shorter than the sums of the radii are colored red. Contacts equal to the sums of radii are white. Image generated using CrystalExplorer (Spackman et al., Reference Spackman, Turner, McKinnon, Wolff, Grimwood, Jayatilaka and Spackman2021).
The Bravais–Friedel–Donnay–Harker algorithm (Bravais, Reference Bravais1866; Friedel, Reference Friedel1907; Donnay and Harker, Reference Donnay and Harker1937) suggests that we might expect elongated morphology for ethynodiol diacetate, with [010] as the major axis. A second-order spherical harmonic model was included in the refinement. The texture index was 1.004(0), indicating that the preferred orientation was insignificant in this rotated capillary specimen.
DEPOSITED DATA
The powder pattern of ethynodiol diacetate from this synchrotron data set has been submitted to the International Centre for Diffraction Data (ICDD) for inclusion in the Powder Diffraction File. The Crystallographic Information Framework (CIF) files containing the results of the Rietveld refinement (including the raw data) and the density functional theory (DFT) geometry optimization were deposited with the ICDD. The data can be requested at pdj@icdd.com.
ACKNOWLEDGEMENTS
We thank Adam Leontowich for his assistance in the data collection. We also thank the ICDD team – Megan Rost, Steve Trimble, and Dave Bohnenberger – for their contribution to research, sample preparation, and in-house XRD data collection and verification.
FUNDING STATEMENT
Part or all of the research described in this paper was performed at the Canadian Light Source, a national research facility of the University of Saskatchewan, which is supported by the Canada Foundation for Innovation (CFI), the Natural Sciences and Engineering Research Council (NSERC), the Canadian Institute of Health Research (CIHR), the Government of Saskatchewan, and the University of Saskatchewan. This work was partially supported by the International Centre for Diffraction Data.
CONFLICTS OF INTEREST
The authors have no conflicts of interest to declare.


 Open access