


I. INTRODUCTION
Nequinate is an antiprotozoan used as a coccidiostat for poultry and rabbits. Nequinate treats coccidiosis, a parasitic disease, caused by a spore-forming, single-cell protozoa called coccidia. Coccidia are from the same class of organisms (sporozoa) that cause malaria. The systematic name (CAS Registry Number 13997-19-8) is methyl 6-butyl-4-oxo-7-phenylmethoxy-1H-quinoline-3-carboxylate. A two-dimensional molecular diagram is shown in Figure 1.
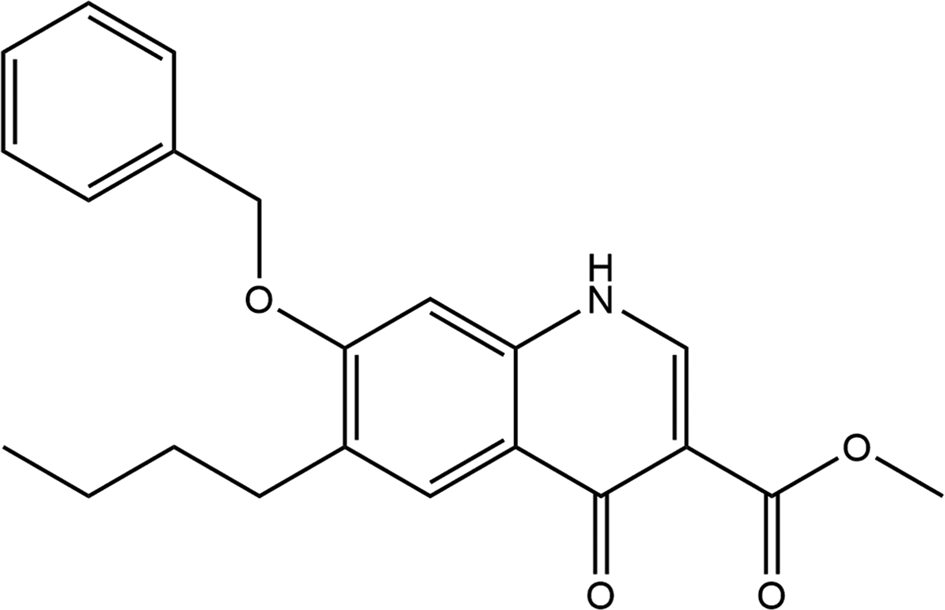
Figure 1. The 2D molecular structure of nequinate.
We are unaware of any published X-ray diffraction data for nequinate. This work was carried out as part of a project (Kaduk et al., Reference Kaduk, Crowder, Zhong, Fawcett and Suchomel2014) to determine the crystal structures of large-volume commercial pharmaceuticals and include high-quality powder diffraction data for them in the Powder Diffraction File (Gates-Rector and Blanton, Reference Gates-Rector and Blanton2019).
II. EXPERIMENTAL
Nequinate was a commercial reagent, purchased from TargetMol (Batch #143800), and was used as-received. The white powder was packed into a 1.5 mm diameter Kapton capillary and rotated during the measurement at ~50 Hz. The powder pattern was measured at 295 K at beam line 11-BM (Antao et al., Reference Antao, Hassan, Wang, Lee and Toby2008; Lee et al., Reference Lee, Shu, Ramanathan, Preissner, Wang, Beno, Von Dreele, Ribaud, Kurtz, Antao, Jiao and Toby2008; Wang et al., Reference Wang, Toby, Lee, Ribaud, Antao, Kurtz, Ramanathan, Von Dreele and Beno2008) of the Advanced Photon Source at Argonne National Laboratory using a wavelength of 0.458208(2) Å from 0.5 to 50° 2θ with a step size of 0.001° and a counting time of 0.1 s step−1. The high-resolution powder diffraction data were collected using 12 silicon crystal analyzers that allow for high angular resolution, high precision, and accurate peak positions. A silicon (NIST SRM 640c) and alumina (SRM 676a) standard (ratio Al2O3:Si = 2:1 by weight) was used to calibrate the instrument and refine the monochromatic wavelength used in the experiment.
The pattern was indexed using JADE Pro 8.1 (MDI, 2021) and N-TREOR (Altomare et al., Reference Altomare, Cuocci, Giacovazzo, Moliterni, Rizzi, Corriero and Falcicchio2013) on a high-quality primitive monoclinic unit cell with a = 18.35662(20), b = 11.68784(6), c = 9.06122(4) Å, β = 99.3314(5)°, V = 1918.352(13) Å3, and Z = 4. The space group suggested by both programs was P21/c, which was confirmed by successful solution and refinement of the structure. A reduced cell search in the Cambridge Structural Database (Groom et al., Reference Groom, Bruno, Lightfoot and Ward2016) yielded 21 hits but no structures of nequinate derivatives.
A nequinate molecule was downloaded from PubChem (Kim et al., Reference Kim, Chen, Cheng, Gindulyte, He, He, Li, Shoemaker, Thiessen, Yu, Zaslavsky, Zhang and Bolton2019) as Conformer3D_CID_26383.sdf. It was converted into a *.mol2 file using Mercury (Macrae et al., Reference Macrae, Sovago, Cottrell, Galek, McCabe, Pidcock, Platings, Shields, Stevens, Towler and Wood2020) and into a Fenske-Hall Z-matrix file using OpenBabel (O'Boyle et al., Reference O'Boyle, Banck, James, Morley, Vandermeersch and Hutchison2011). The structure was solved using FOX (Favre-Nicolin and Černý, Reference Favre-Nicolin and Černý2002) using sinθ/λ max = 0.32 Å−1.
Rietveld refinement was carried out using GSAS-II (Toby and Von Dreele, Reference Toby and Von Dreele2013). Only the 1.0–25.0° portion of the pattern was included in the refinement (d min = 1.058 Å). All non-H-bond distances and angles were subjected to restraints based on a Mercury/Mogul Geometry Check (Bruno et al., Reference Bruno, Cole, Kessler, Luo, Motherwell, Purkis, Smith, Taylor, Cooper, Harris and Orpen2004; Sykes et al., Reference Sykes, McCabe, Allen, Battle, Bruno and Wood2011). The Mogul average and standard deviation for each quantity were used as the restraint parameters. The restraints contributed 2.3% to the final χ 2. The hydrogen atoms were included in calculated positions, which were recalculated during the refinement using Materials Studio (Dassault Systèmes, 2021). The Uiso were grouped by chemical similarity. The Uiso for the H atoms were fixed at 1.3× the Uiso of the heavy atoms to which they are attached. The peak profiles were described using the generalized microstrain model. The background was modeled using a 6-term shifted Chebyshev polynomial, plus a peak at 5.94° 2θ to model the scattering from the Kapton capillary and any amorphous component.
The final refinement of 109 variables using 24 039 observations and 68 restraints yielded the residuals Rwp = 0.07133 and goodness of fit (GOF) = 1.44. The largest peak (1.85 Å from C10) and hole (1.99 Å from O2) in the difference Fourier map were 0.18(5) and −0.21(5) eÅ−3, respectively. The largest error in the difference plot (Figure 2) is in the shape of the strong low-angle (100) peak.
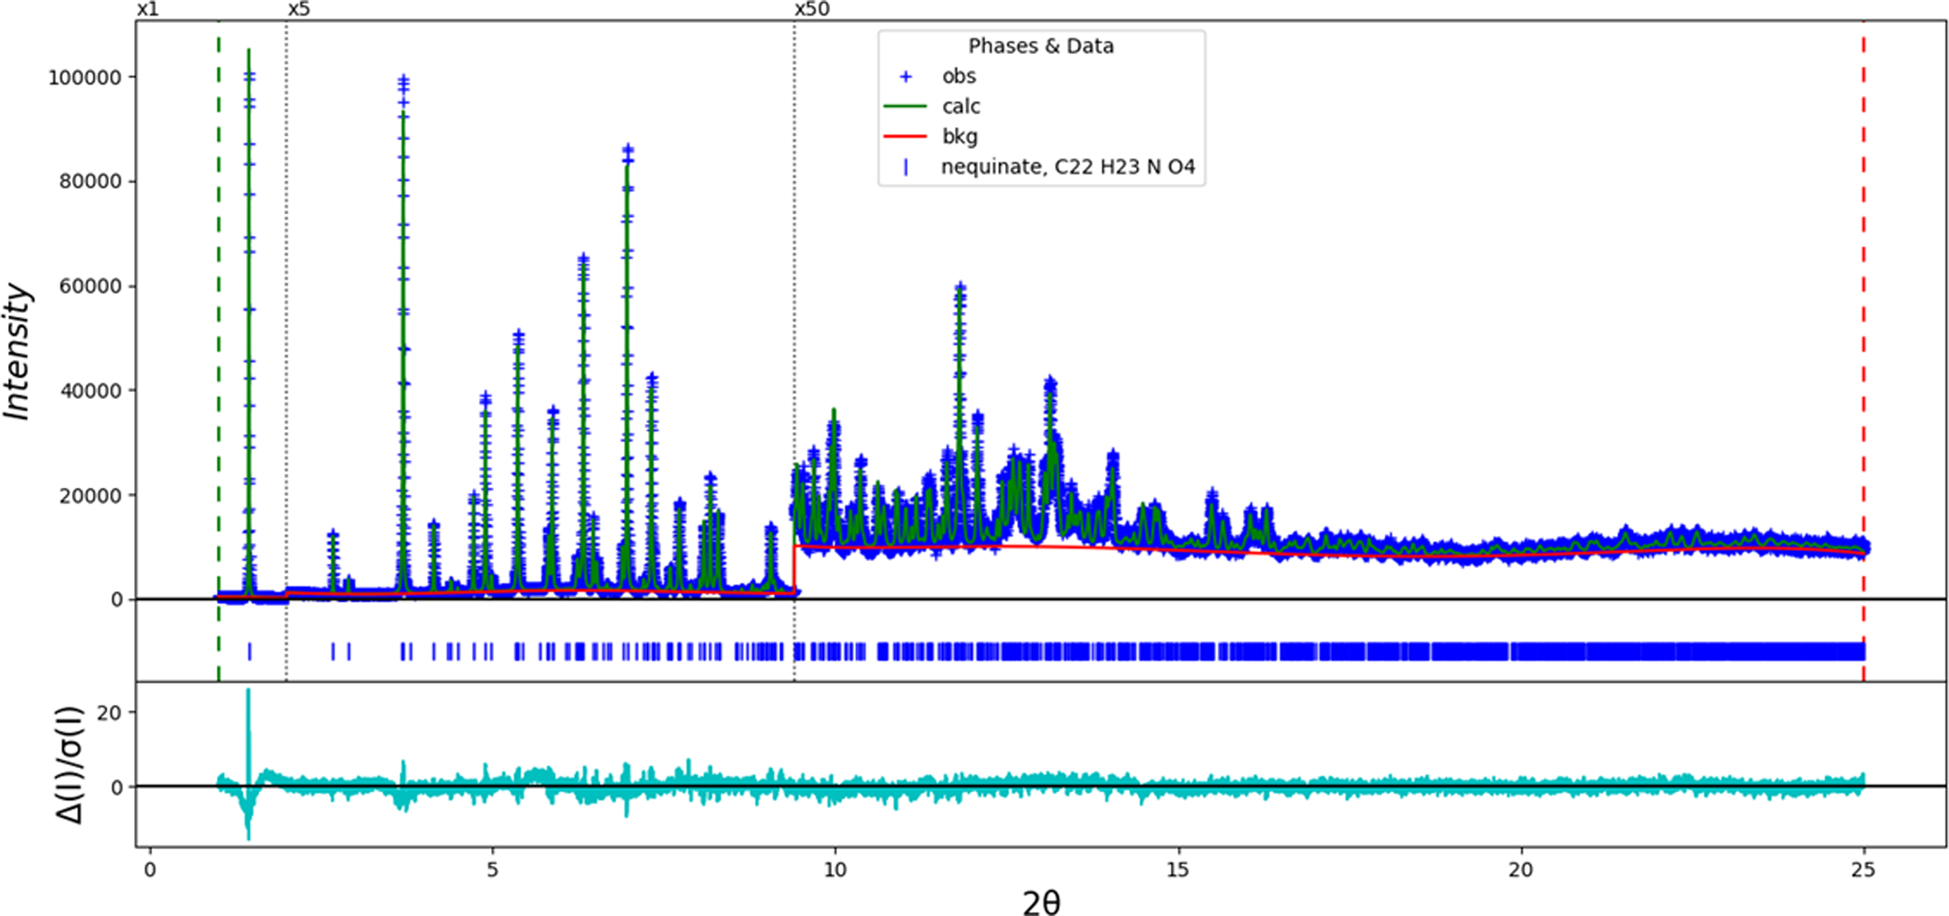
Figure 2. The Rietveld plot for the refinement of nequinate. The blue crosses represent the observed data points, and the green line is the calculated pattern. The cyan curve is the normalized error plot. The vertical scale has been multiplied by a factor of 5× for 2θ > 2.0° and by a factor of 50× for 2θ > 9.4°.
The structure of nequinate was optimized using Vienna Ab initio Simulation Package (VASP) (Kresse and Furthmüller, Reference Kresse and Furthmüller1996) (fixed experimental unit cell) through the MedeA graphical interface (Materials Design, 2016). The calculation was carried out on 16 2.4 GHz processors (each with 4 Gb RAM) of a 64-processor HP Proliant DL580 Generation 7 Linux cluster at North Central College. The calculation used the GGA-PBE functional, a plane wave cutoff energy of 400.0 eV, and a k-point spacing of 0.5 Å−1 leading to a 1 × 2 × 2 mesh and took ~28 h. A single-point density functional calculation (fixed experimental cell) and population analysis were carried out using CRYSTAL17 (Dovesi et al., Reference Dovesi, Erba, Orlando, Zicovich-Wilson, Civalleri, Maschio, Rerat, Casassa, Baima, Salustro and Kirtman2018). The basis sets for the H, C, N, and O atoms in the calculation were those of Gatti et al. (Reference Gatti, Saunders and Roetti1994). The calculations were run on a 3.5 GHz PC using 8 k-points and the B3LYP functional, and took ~2.6 h.
III. RESULTS AND DISCUSSION
The root-mean-square (rms) Cartesian displacement between the Rietveld-refined and density functional theory (DFT)-optimized structures of nequinate is 0.106 Å (Figure 3); the maximum deviation is 0.299 Å at the methyl group C17. The excellent agreement provides strong evidence that the structure is correct (van de Streek and Neumann, Reference van de Streek and Neumann2014). This discussion concentrates on the DFT-optimized structure. The asymmetric unit (with atom numbering) is illustrated in Figure 4. The crystal structure is shown in Figure 5 and is dominated by the stacking of the approximately planar molecules. The mean plane is approximately (8,−1,9). The molecules form layers parallel to the bc-plane. The inter-layer contacts are hydrocarbon–hydrocarbon. All of the bond distances, bond angles, and torsion angles fall within the normal ranges indicated by a Mercury Mogul Geometry check (Macrae et al., Reference Macrae, Sovago, Cottrell, Galek, McCabe, Pidcock, Platings, Shields, Stevens, Towler and Wood2020).
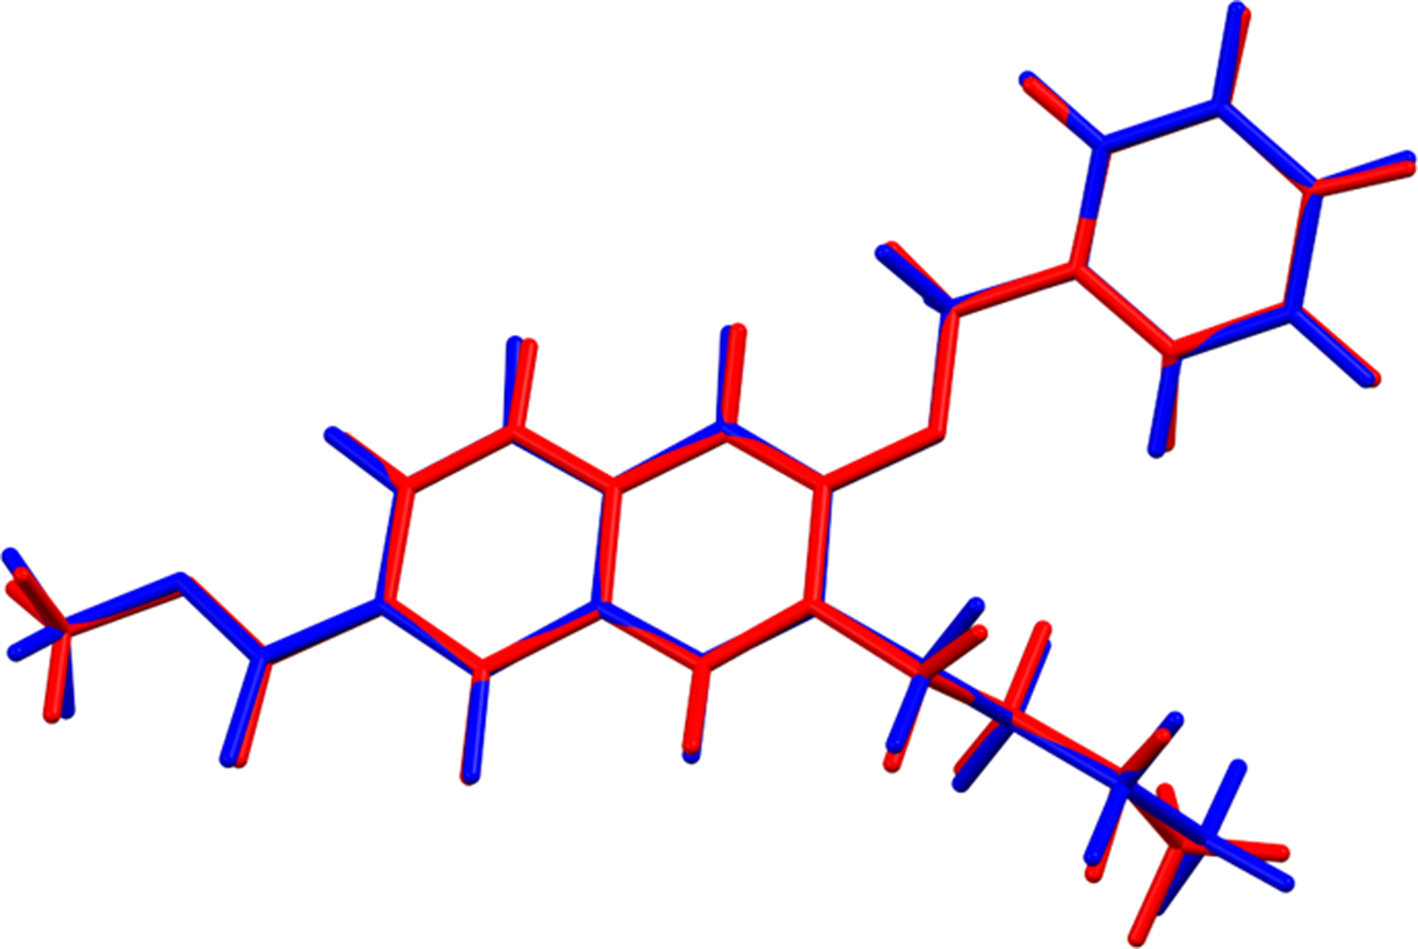
Figure 3. Comparison of the Rietveld-refined (red) and VASP-optimized (blue) structures of nequinate. The rms Cartesian displacement is 0.106 Å.
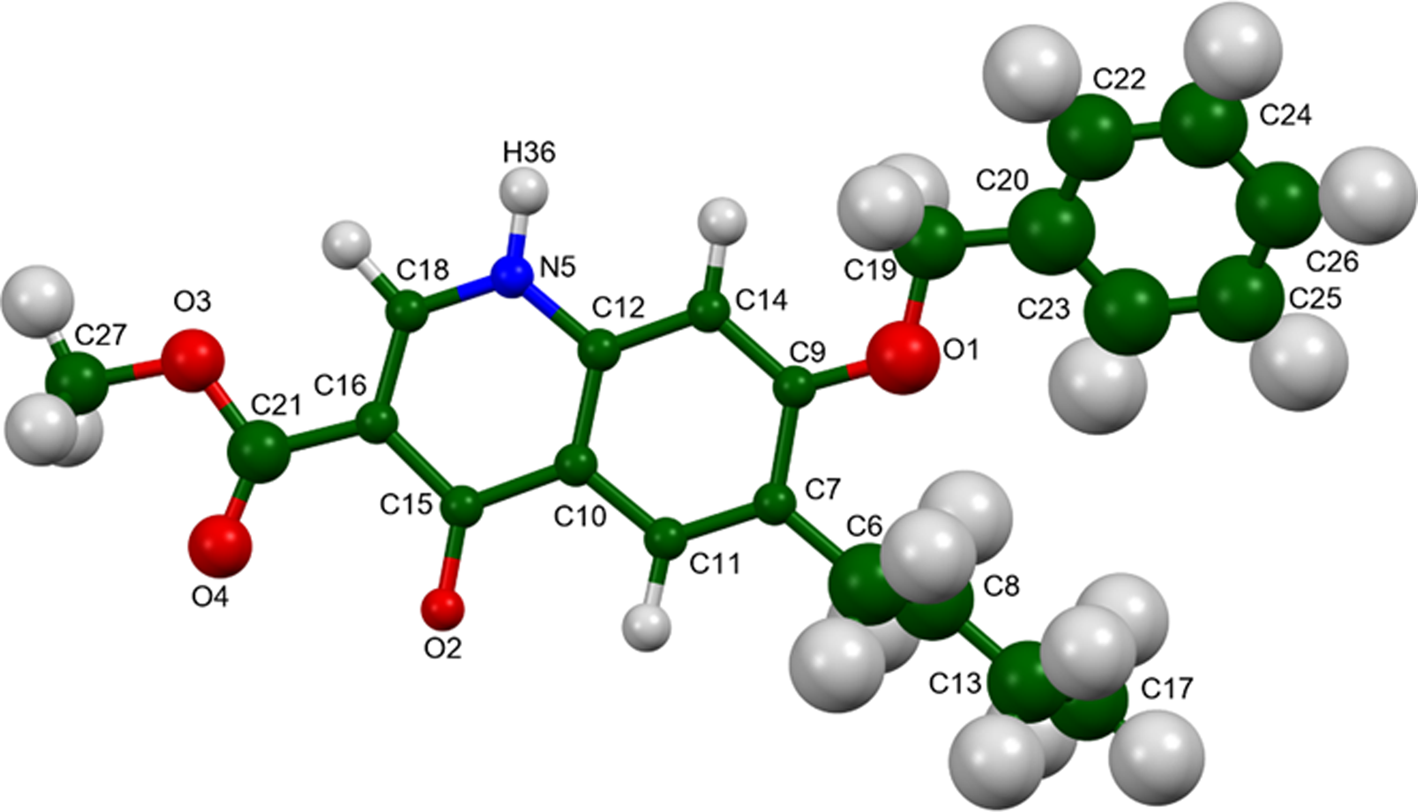
Figure 4. The asymmetric unit of nequinate, with the atom numbering. The atoms are represented by 50% probability spheroids.
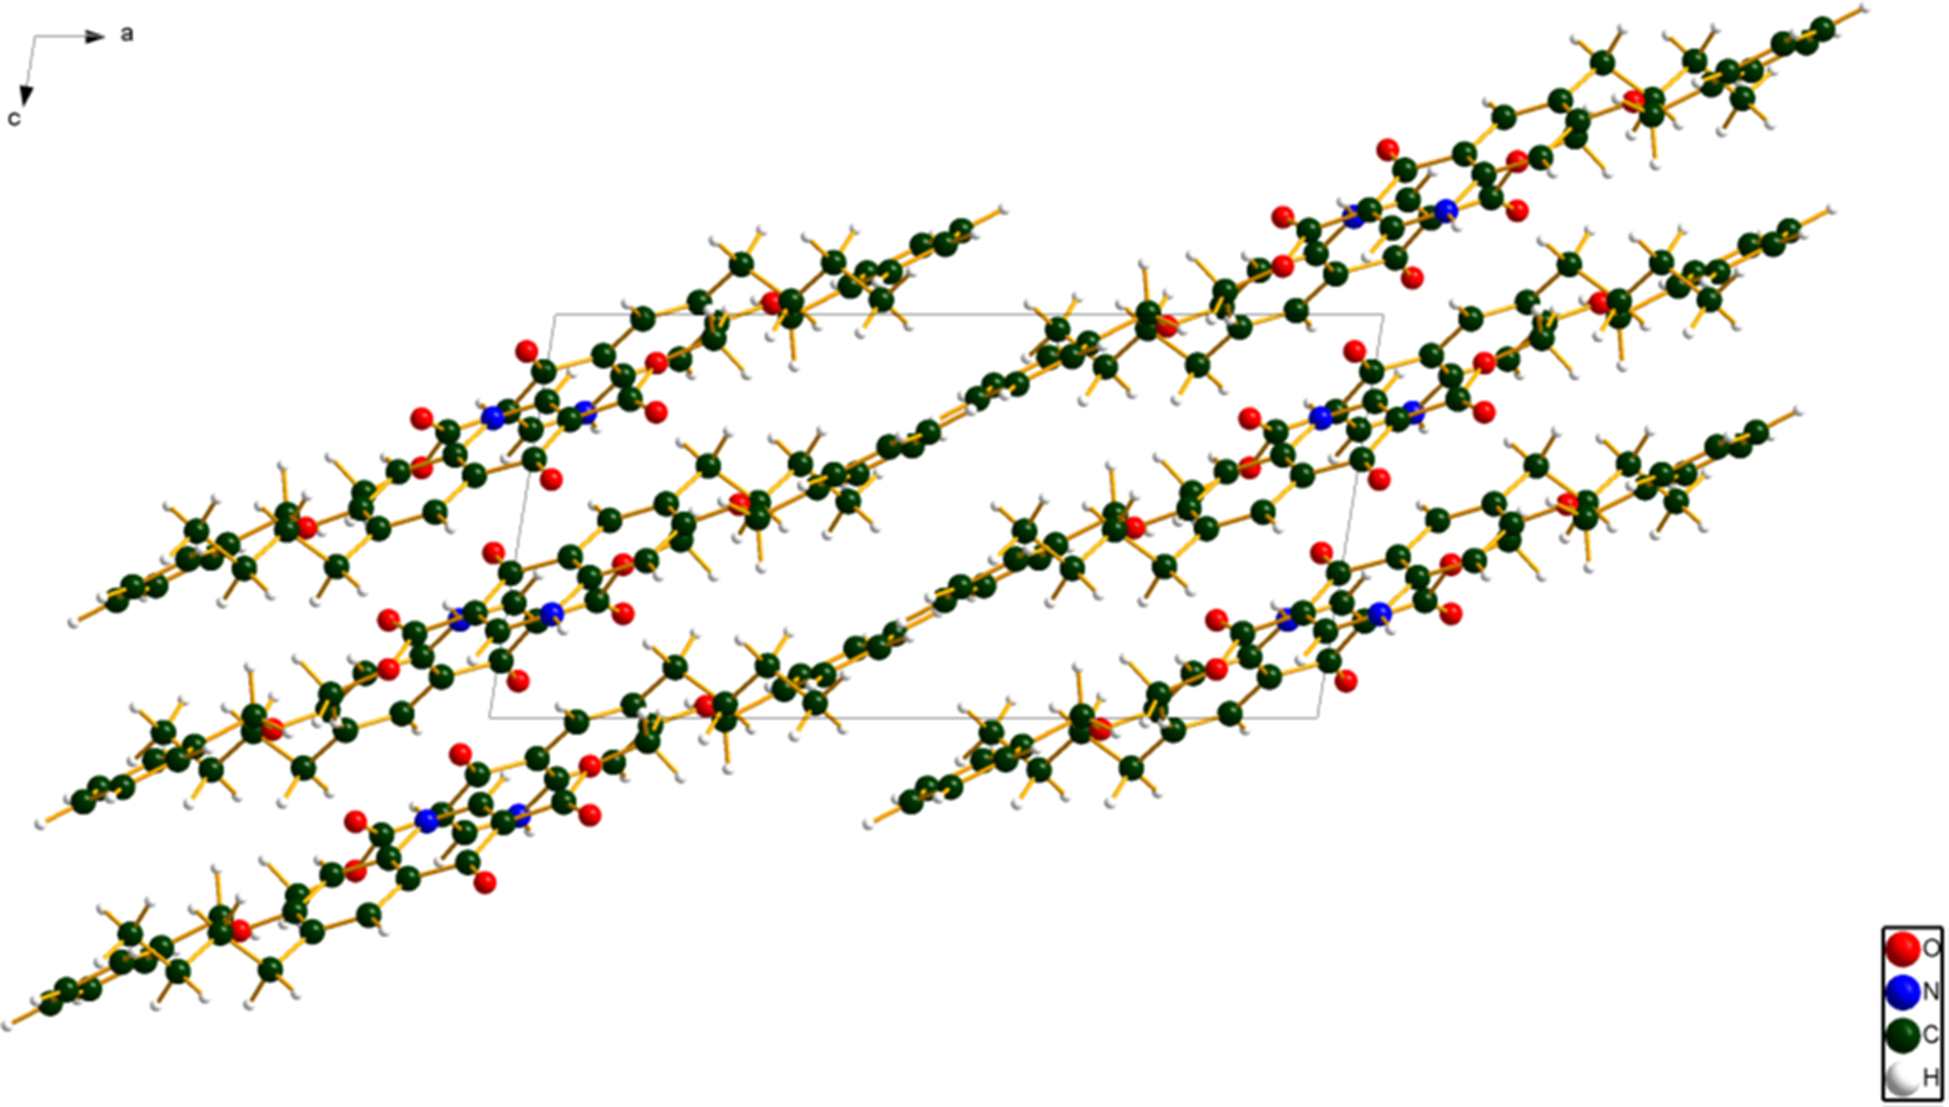
Figure 5. The crystal structure of nequinate, viewed down the b-axis.
Quantum chemical geometry optimization of the nequinate molecule (DFT/B3LYP/6-31G*/water) using Spartan ‘18 (Wavefunction, Inc., 2020) indicated that the observed conformation is 2.7 kcal mol−1 higher in energy than the local minimum, which is, in general, similar, but has a different orientation of the C35–40 phenyl ring. A conformational analysis (MMFF force field) shows that the observed solid-state conformation is 2.3 kcal mol−1 higher in energy than the global minimum-energy conformation of an isolated molecule. The main difference is in the orientation of the methyl ether. The differences show that, despite the weak intermolecular interactions, they are important in determining the solid-state conformation.
Analysis of the contributions to the total crystal energy of the structure using the Forcite module of Materials Studio (Dassault Systèmes, 2021) suggests that bond, angle, and torsion distortion terms contribute significantly to the intra-molecular deformation energy. The intermolecular energy is dominated by van der Waal's attractions and electrostatic repulsions, which, in this force field analysis, also include hydrogen bonds. The hydrogen bonds are better analyzed using the results of the DFT calculation.
There is only one traditional hydrogen bond in the structure (Table I) between the amino group N5–H36 and the carbonyl group O2. The energy of this hydrogen bond was calculated using the correlation of Wheatley and Kaduk (Reference Wheatley and Kaduk2019). These hydrogen bonds link adjacent molecules into chains parallel to the b-axis. Several inter- and intra-molecular C–H⋯O hydrogen bonds also contribute to the lattice energy.
Table I. Hydrogen bonds (CRYSTAL17) in nequinate.
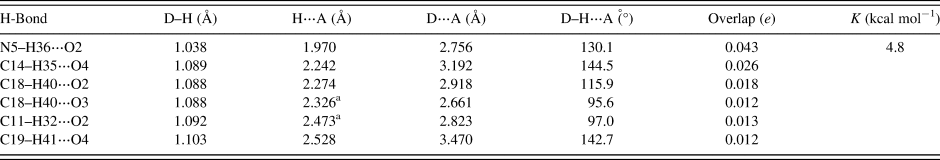
a Intramolecular.
The volume enclosed by the Hirshfeld surface of the nequinate molecule (Figure 6, Hirshfeld, Reference Hirshfeld1977; Turner et al., Reference Turner, McKinnon, Wolff, Grimwood, Spackman, Jayatilaka and Spackman2017) is 471.40 Å3, 98.29% of 1/4 the unit cell volume. The packing density is thus fairly typical. The only significant close contacts (red in Figure 6) involve the hydrogen bonds. The volume/non-hydrogen atom is typical for pharmaceuticals, at 17.8 Å3.
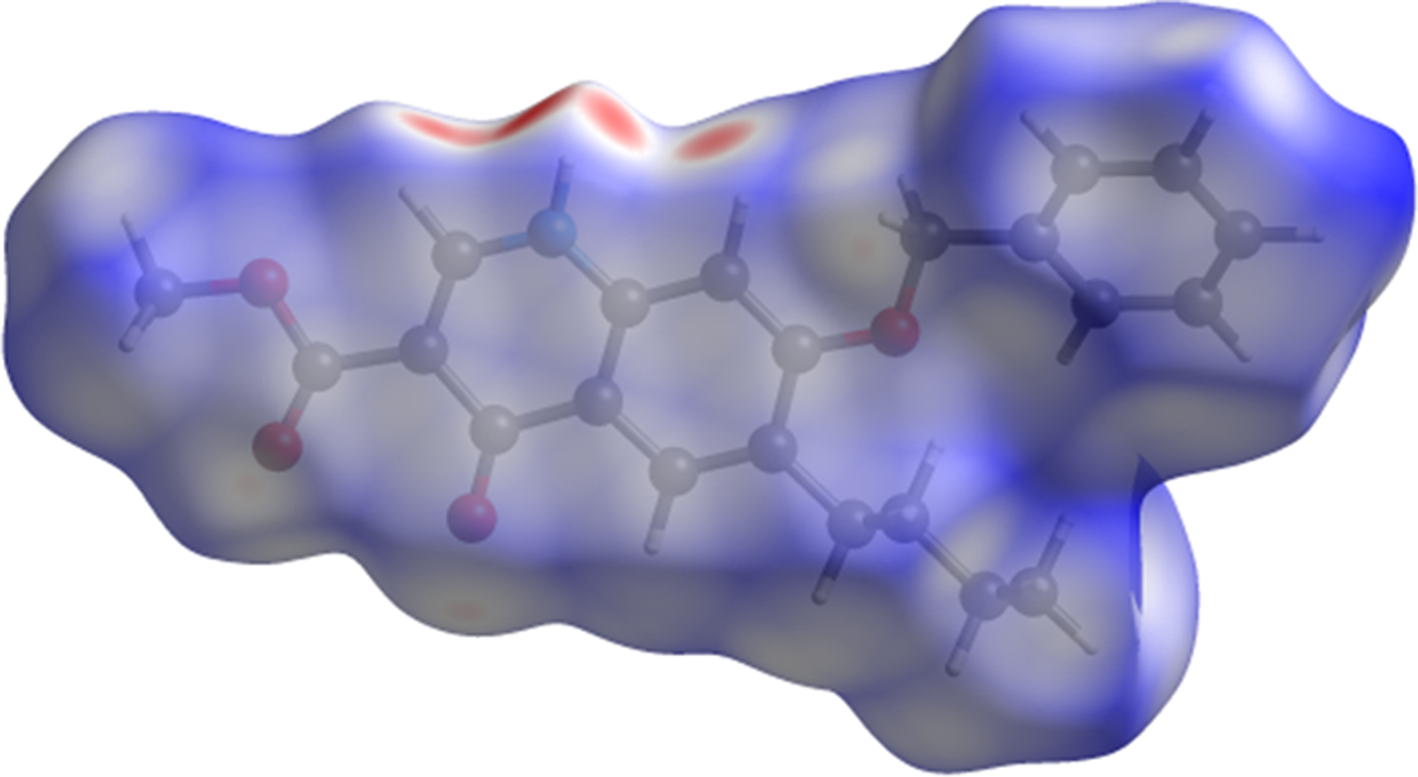
Figure 6. The Hirshfeld surface of nequinate. Intermolecular contacts longer than the sums of the van der Waal's radii are colored blue, and contacts shorter than the sums of the radii are colored red. Contacts equal to the sums of radii are white.
The Bravais–Friedel–Donnay-Harker (Bravais, Reference Bravais1866; Friedel, Reference Friedel1907; Donnay and Harker, Reference Donnay and Harker1937) algorithm suggests that we might expect platy morphology for nequinate, with {100} as the major faces. A second-order spherical harmonic model was included in the refinement. The texture index was 1.029(0), indicating that preferred orientation was slight in this rotated capillary specimen. The powder pattern of nequinate from this synchrotron data set has been submitted to ICDD for inclusion in the Powder Diffraction File.
IV. DEPOSITED DATA
The Crystallographic Information Framework (CIF) files containing the results of the Rietveld refinement (including the raw data) and the DFT geometry optimization were deposited with the ICDD. The data can be requested at info@icdd.com.
ACKNOWLEDGEMENTS
Use of the Advanced Photon Source at Argonne National Laboratory was supported by the U.S. Department of Energy, Office of Science, Office of Basic Energy Sciences, under Contract No. DE-AC02-06CH11357. This work was partially supported by the International Centre for Diffraction Data. We thank Lynn Ribaud and Saul Lapidus for their assistance in the data collection.
CONFLICTS OF INTEREST
The authors have no conflicts of interest to declare.


 Open access