


I. INTRODUCTION
Repotrectinib (sold under the brand name Augtyro) is used for the treatment of cancer. Specifically, it is a tyrosine (https://pubchem.ncbi.nlm.nih.gov/compound/tyrosine) kinase inhibitor used for the treatment of locally advanced or metastatic ROS1-positive non-small cell lung cancer. The systematic name (CAS Registry No. 1802220-02-5) is (3R,11S)-6-fluoro-3,11-dimethyl-10-oxa-2,13,17,18,21-pentazatetracyclo[13.5.2.04,9.018,22]docosa-1(21),4(9),5,7,15(22),16,19-heptaen-14-one. A two-dimensional molecular diagram of repotrectinib is shown in Figure 1.
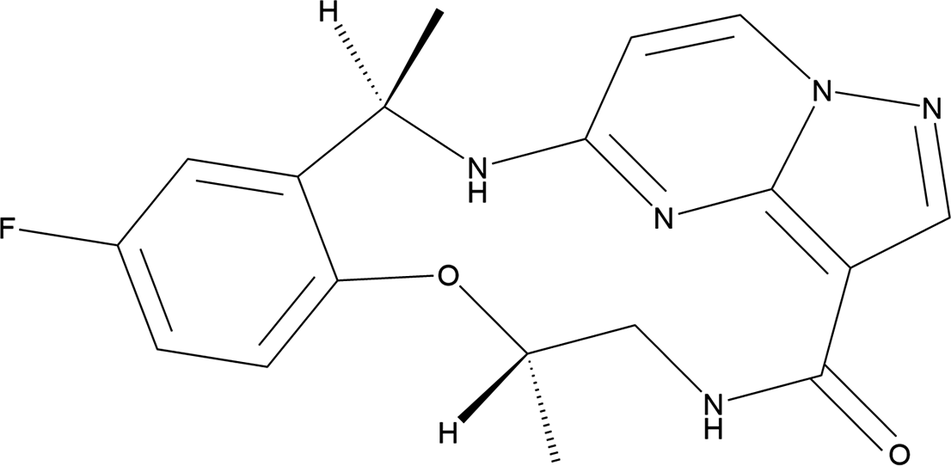
Figure 1. The two-dimensional structure of repotrectinib.
Repotrectinib is claimed in U.S. Patent 10294242 B2 (Cui and Rogers, Reference Cui and Rogers2019; TP Therapeutics), and powder diffraction data are provided. The crystal structures of repotrectinib complexed to two proteins have been reported (Murray et al., Reference Murray, Rogers, Zhai, Dong, Chen, Sprengeler and Zhang2021; PDB entries 7VKN and 7VKO). Murray’s paper indicates that the crystal structure of unbound repotrectinib was also determined, but we can find no evidence that the structure has been published or deposited.
This work was carried out as part of a project (Kaduk et al., Reference Kaduk, Crowder, Zhong, Fawcett and Suchomel2014) to determine the crystal structures of large-volume commercial pharmaceuticals and include high-quality powder diffraction data for them in the Powder Diffraction File™ (Kabekkodu et al., Reference Kabekkodu, Dosen and Blanton2024).
II. EXPERIMENTAL
Repotrectinib was a commercial reagent, purchased from TargetMol (Batch #T4071) and was used as received. The white powder was packed into a 0.5-mm-diameter Kapton capillary and rotated during the measurement at ~2 Hz. The powder pattern was measured at 298(1) K at the Wiggler Low Energy Beamline (Leontowich et al., Reference Leontowich, Gomez, Diaz Moreno, Muir, Spasyuk, King, Reid, Kim and Kycia2021) of the Brockhouse X-ray Diffraction and Scattering Sector of the Canadian Light Source using a wavelength of 0.819563(2) Å (15.1 keV) from 1.6 to 75.0° 2θ with a step size of 0.0025° and a collection time of 3 minutes. The high-resolution powder diffraction data were collected using eight Dectris Mythen2 X series 1K linear strip detectors. NIST SRM 660b LaB6 was used to calibrate the instrument and refine the monochromatic wavelength used in the experiment.
The pattern was indexed using N-TREOR as incorporated into EXPO2014 (Altomare et al., Reference Altomare, Cuocci, Giacovazzo, Moliterni, Rizzi, Corriero and Falcicchio2013) on a primitive orthorhombic unit cell with a = 9.27497(95), b = 11.60771(170), c = 15.63851(130) Å, V = 1,683.7 Å3, and Z = 4. The suggested space group was P212121, which was confirmed by the successful solution and refinement of the structure. A reduced cell search of the Cambridge Structural Database (Groom et al., Reference Groom, Bruno, Lightfoot and Ward2016) yielded three hits, but no structures of repotrectinib or its derivatives.
The structure was solved by direct methods as incorporated into EXPO2014. Several atom types had to be reassigned manually. The positions of the hydrogen atoms were calculated using Mercury (Macrae et al., Reference Macrae, Sovago, Cottrell, Galek, McCabe, Pidcock and Platings2020). Mercury was also used to invert the structure to correspond more closely to that contained in PubChem (Kim et al., Reference Kim, Chen, Cheng, Gindulyte, He, He and Li2023).
Rietveld refinement was carried out with GSAS-II (Toby and Von Dreele, Reference Toby and Von Dreele2013). Only the 4.0–60.0° portion of the pattern was included in the refinements (d min = 0.819 Å). All non-H-bond distances and angles were subjected to restraints, based on a Mercury/Mogul Geometry Check (Bruno et al., Reference Bruno, Cole, Kessler, Luo, Motherwell, Purkis and Smith2004; Sykes et al., Reference Sykes, McCabe, Allen, Battle, Bruno and Wood2011). The Mogul average and standard deviation for each quantity were used as the restraint parameters. The benzene and pyrazolo[1,5-a]pyrimidine ring systems were restrained to be planar. The restraints contributed 6.5% to the overall χ 2. The hydrogen atoms were included in calculated positions, which were recalculated during the refinement using Materials Studio (Dassault Systèmes, Reference Dassault2023). The U iso of the heavy atoms were grouped by chemical similarity. The U iso of the H atoms were fixed at 1.3× the U iso of the heavy atoms to which they are attached. The peak profiles were described using the generalized (Stephens, Reference Stephens1999) microstrain model. The background was modeled using a six-term shifted Chebyshev polynomial, with peaks at 10.29 and 43.47° to model the narrow and broad scattering from the Kapton capillary and any amorphous component.
The final refinement of 102 variables using 22,401 observations and 73 restraints yielded the residual R wp = 0.04561. The largest peak (1.39 Å from O2) and hole (1.20 Å from C22) in the difference Fourier map were 0.30(8) and − 0.30(8) eÅ−3, respectively. The final Rietveld plot is shown in Figure 2. The largest features in the normalized error plot are in the shapes of some of the strong low-angle peaks.
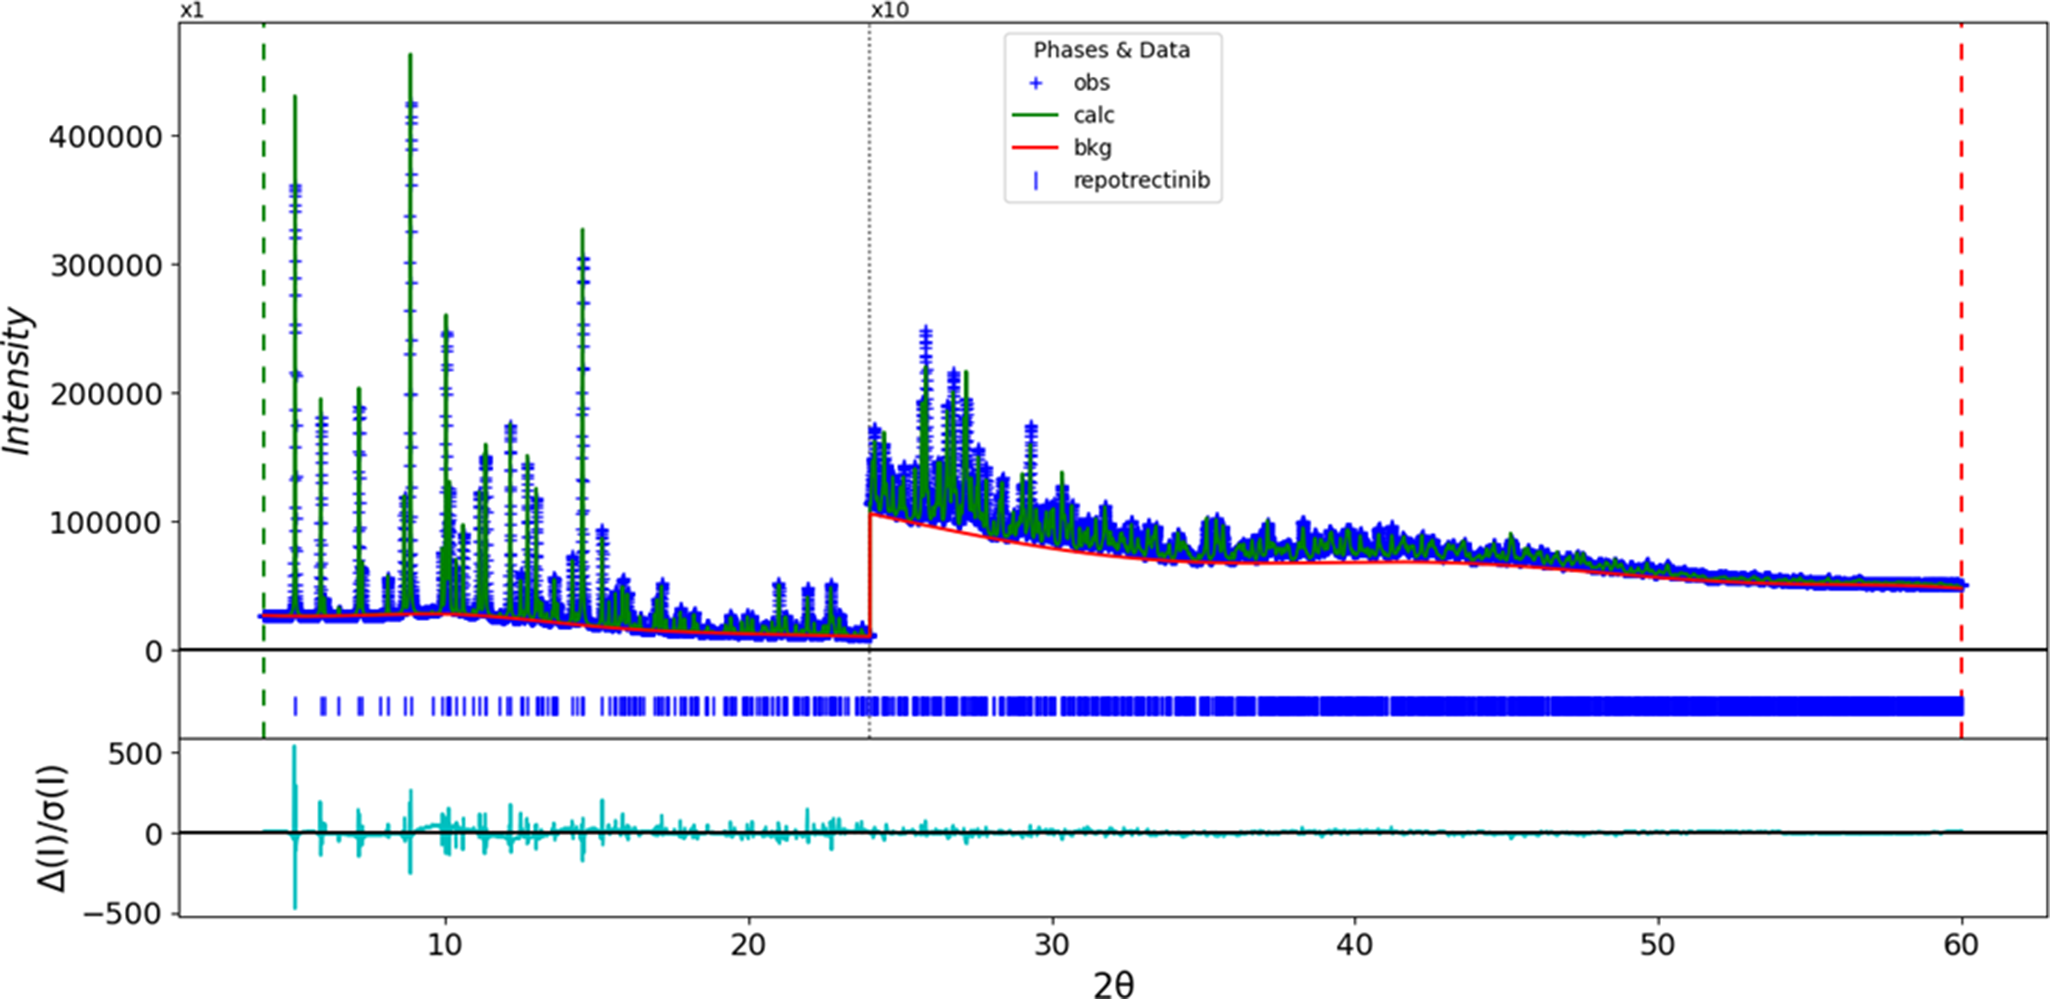
Figure 2. The Rietveld plot for repotrectinib. The blue crosses represent the observed data points, and the green line represents the calculated pattern. The cyan curve represents the normalized error plot, and the red line represents the background curve. The blue tick marks indicate the repotrectinib peak positions. The vertical scale has been multiplied by a factor of 10× for 2θ > 24.0̊.
The crystal structure of repotrectinib was optimized (fixed experimental unit cell) with density functional theory techniques using VASP (Kresse and Furthmüller, Reference Kresse and Furthmüller1996) through the MedeA graphical interface (Materials Design, 2024). The calculation was carried out on 32 cores of a 144-core (768-GB memory) HPE Superdome Flex 280 Linux server at North Central College. The calculation used the GGA-PBE functional, a plane wave cutoff energy of 400.0 eV, and a k-point spacing of 0.5 Å−1, leading to a 2 × 2 × 1 mesh, and took ~7.3 hours. Single-point density functional calculations (fixed experimental cell) and population analysis were carried out using CRYSTAL23 (Erba et al., Reference Erba, Desmarais, Casassa, Civalleri, Donà, Bush and Searle2023). The basis sets for the H, C, and O atoms in the calculation were those of Gatti et al. (Reference Gatti, Saunders and Roetti1994), and that for F was that of Peintinger et al. (Reference Peintinger, Oliveira and Bredow2013). The calculations were run on a 3.5-GHz PC using eight k-points and the B3LYP functional and took ∼2.6 hours.
III. RESULTS AND DISCUSSION
This synchrotron powder pattern of repotrectinib matches the laboratory powder diffraction pattern reported by Cui and Rogers (Reference Cui and Rogers2019) well enough to conclude that they represent the same material (Figure 3). The structures of the repotrectinib molecules in the two protein structures 7VKN and 7VKO are very similar; the root-mean-square (rms) Cartesian displacement is 0.118 Å. The molecular structures here and in 7VKN are essentially identical; the rms displacement is 0.162 Å.
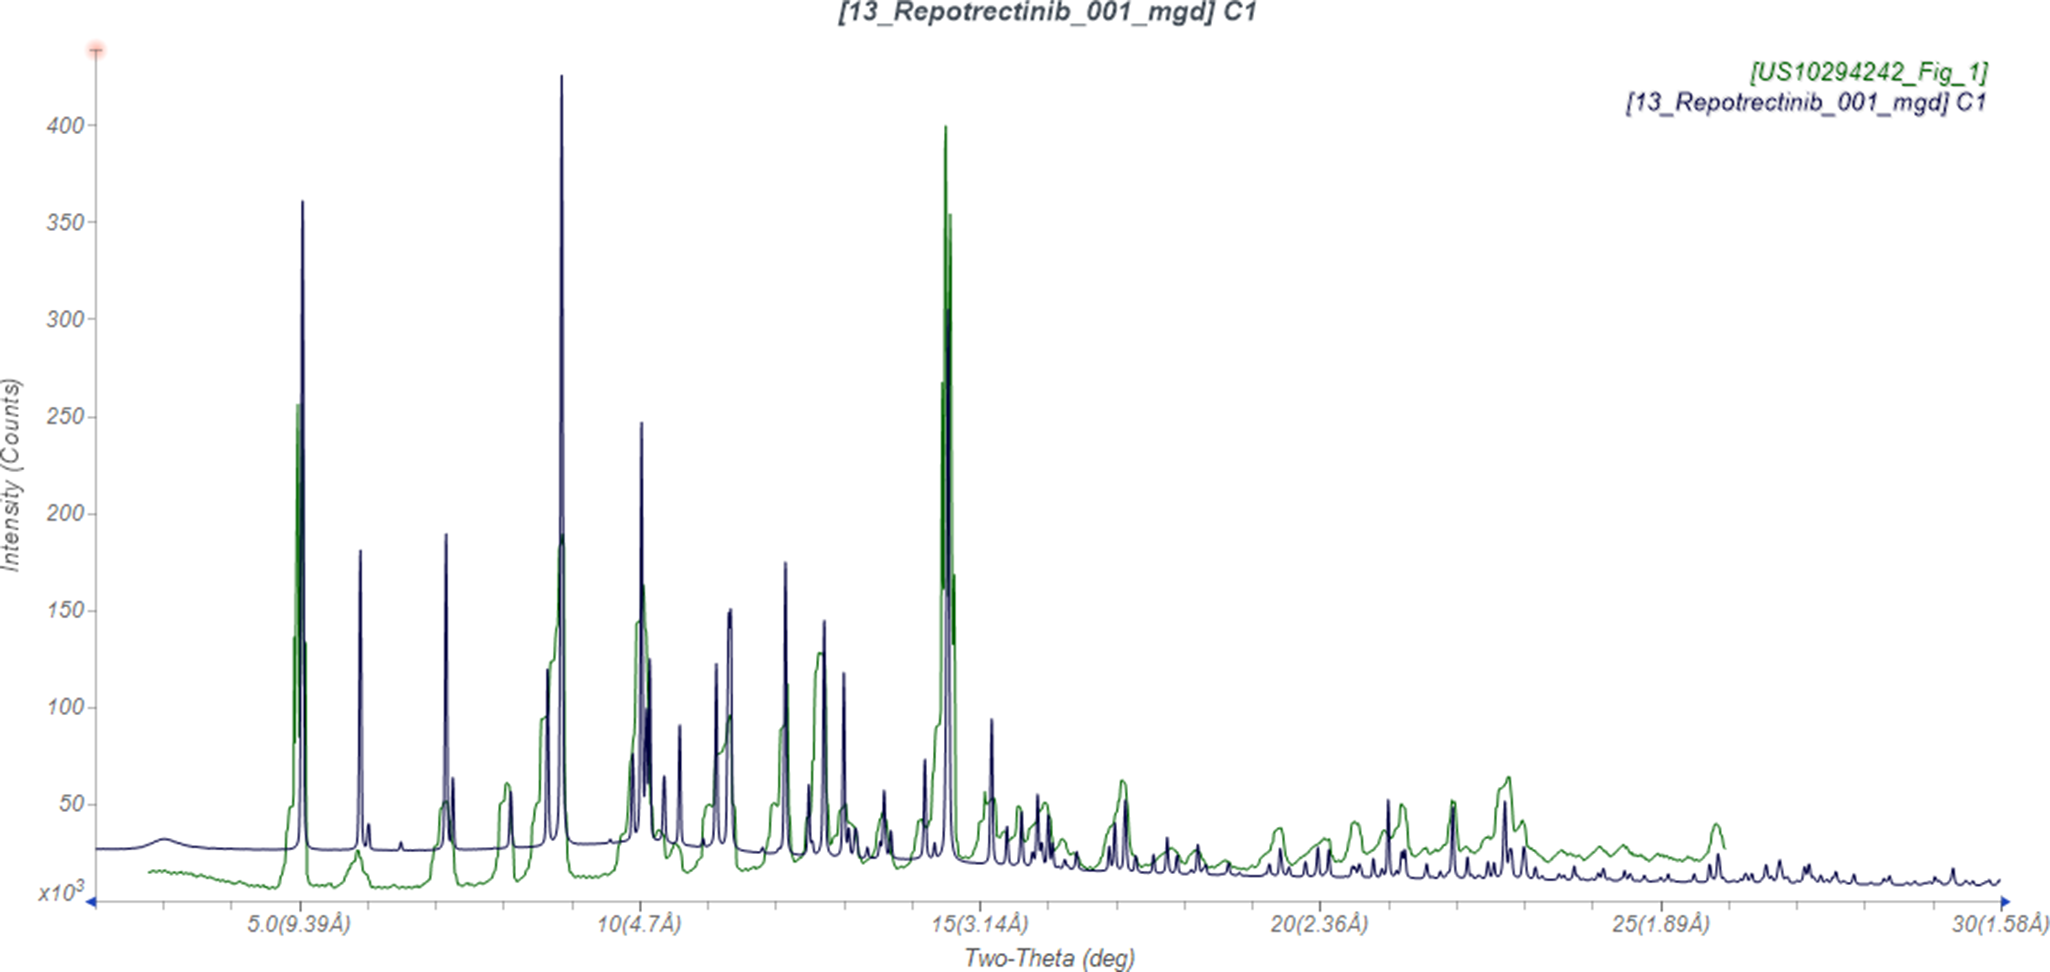
Figure 3. Comparison of the synchrotron pattern from this study of repotrectinib (black) to the laboratory pattern reported by Cui and Rogers (Reference Cui and Rogers2019) (green). The literature pattern (measured using Cu Kα radiation) was digitized using UN-SCAN-IT (Silk Scientific, 2013) and converted to the synchrotron wavelength of 0.819563(2) Å using JADE Pro (MDI, 2024). Image generated using JADE Pro (MDI, 2024).
The rms difference of the non-H atoms in the Rietveld-refined and VASP-optimized structures, calculated using the Mercury CSD-Materials/Search/Crystal Packing Similarity tool, is 0.078 Å. The rms Cartesian displacement of the non-H atoms in the Rietveld-refined and VASP-optimized structures of the molecule, calculated using the Mercury Calculate/Molecule Overlay tool, is 0.051 Å (Figure 4). The agreements are within the normal range for correct structures (van de Streek and Neumann, Reference van de Streek and Neumann2014). The asymmetric unit is illustrated in Figure 5. The remaining discussion will emphasize the VASP-optimized structure.
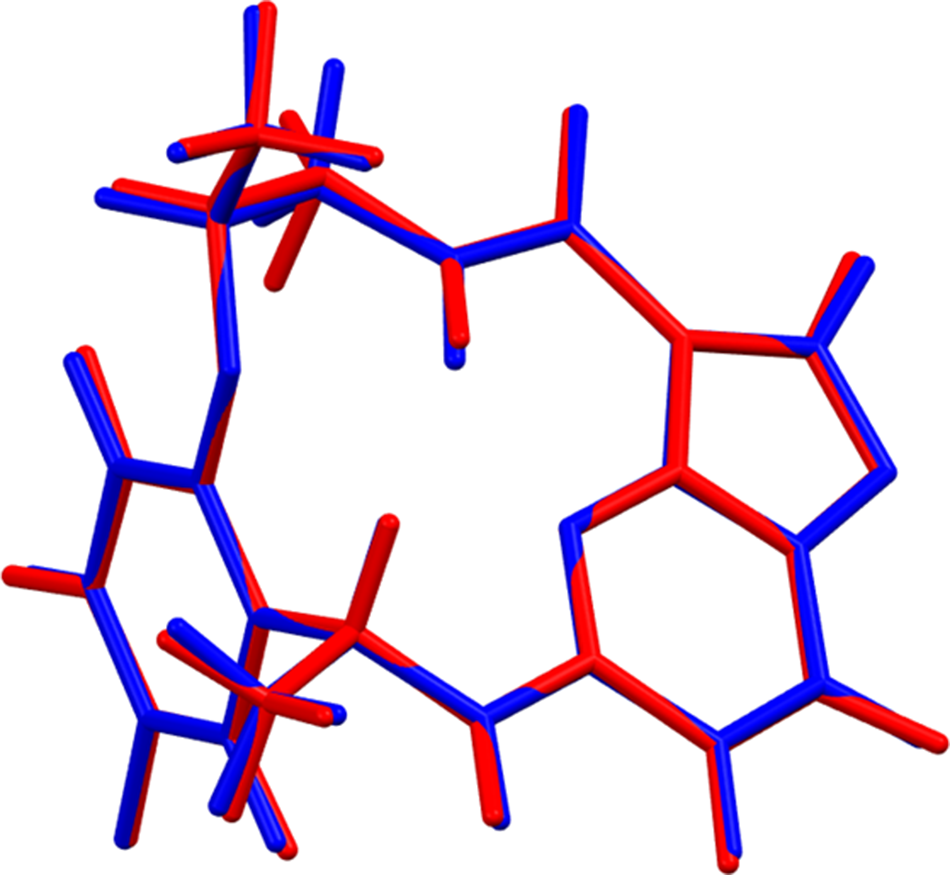
Figure 4. Comparison of the Rietveld-refined (red) and VASP-optimized (blue) structures of the repotrectinib molecule. The root-mean-square Cartesian displacement is 0.051 Å. Image generated using Mercury (Macrae et al., Reference Macrae, Sovago, Cottrell, Galek, McCabe, Pidcock and Platings2020).
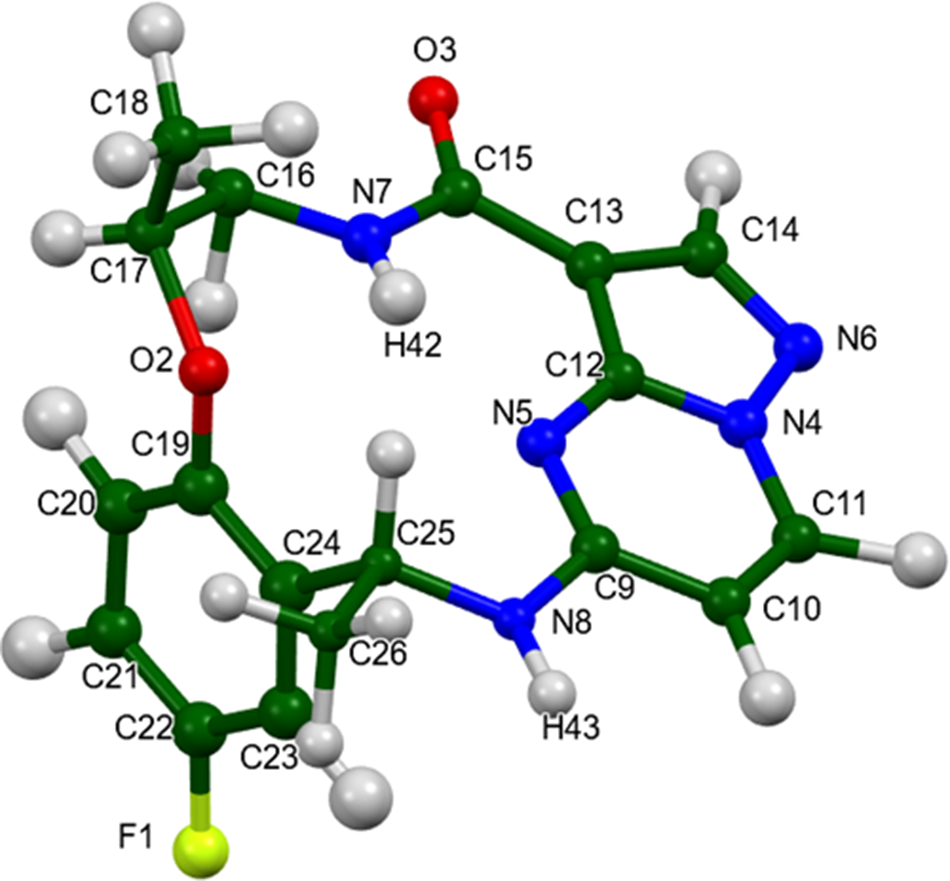
Figure 5. The asymmetric unit of repotrectinib, with the atom numbering. The atoms are represented by 50% probability spheroids. Image generated using Mercury (Macrae et al., Reference Macrae, Sovago, Cottrell, Galek, McCabe, Pidcock and Platings2020).
Almost all of the bond distances, bond angles, and torsion angles fall within the normal ranges indicated by a Mercury Mogul Geometry check (Macrae et al., Reference Macrae, Sovago, Cottrell, Galek, McCabe, Pidcock and Platings2020). The O2–C17–C16 angle of 112.2° (average = 106.1(11)°, Z-score = 5.4) is flagged as unusual. There is only a small population of similar angles, and the standard uncertainty on the average is smaller than usual (inflating the Z-score). Torsion angles involving rotation about the O2–C17 bond lie on the tails of broad distributions. Torsion angles about C16–C17 lie on the tail of a narrow distribution or in a minor gauche population of mainly trans torsion angles. The conformation of the ether portion of the macrocycle is slightly unusual.
Quantum chemical geometry optimization of an isolated repotrectinib molecule (DFT/B3LYP/6-31G*/water) using Spartan ‘24 (Wavefunction, 2023) indicated that the observed molecule is 3.2 kcal/mol higher in energy than a local minimum, which has a very similar geometry (rms displacement = 0.203 Å). The global minimum-energy conformation (MMFF force field) is only 0.7 kcal/mol lower in energy and has a different orientation of the methyl group C15, along with other smaller local changes. The repotrectinib molecule is apparently flexible, and intermolecular interactions have an effect on the solid-state conformation.
The crystal structure (Figure 6) consists of stacks of V-shaped molecules along the b-axis. The mean plane of the phenyl ring is approximately (−5, 12, 11), and the mean plane of the pyrazolo[1,5-a]pyrimidine ring system is approximately (0, −1, 2). The Mercury Aromatics Analyser indicates one moderate interaction between the phenyl rings, with a distance of 6.69 Å, as well as several weak interactions with distances of >7.0 Å. The shortest distance between the centroids of the pyrazolo[1,5-a]pyrimidine ring systems is 5.81 Å.
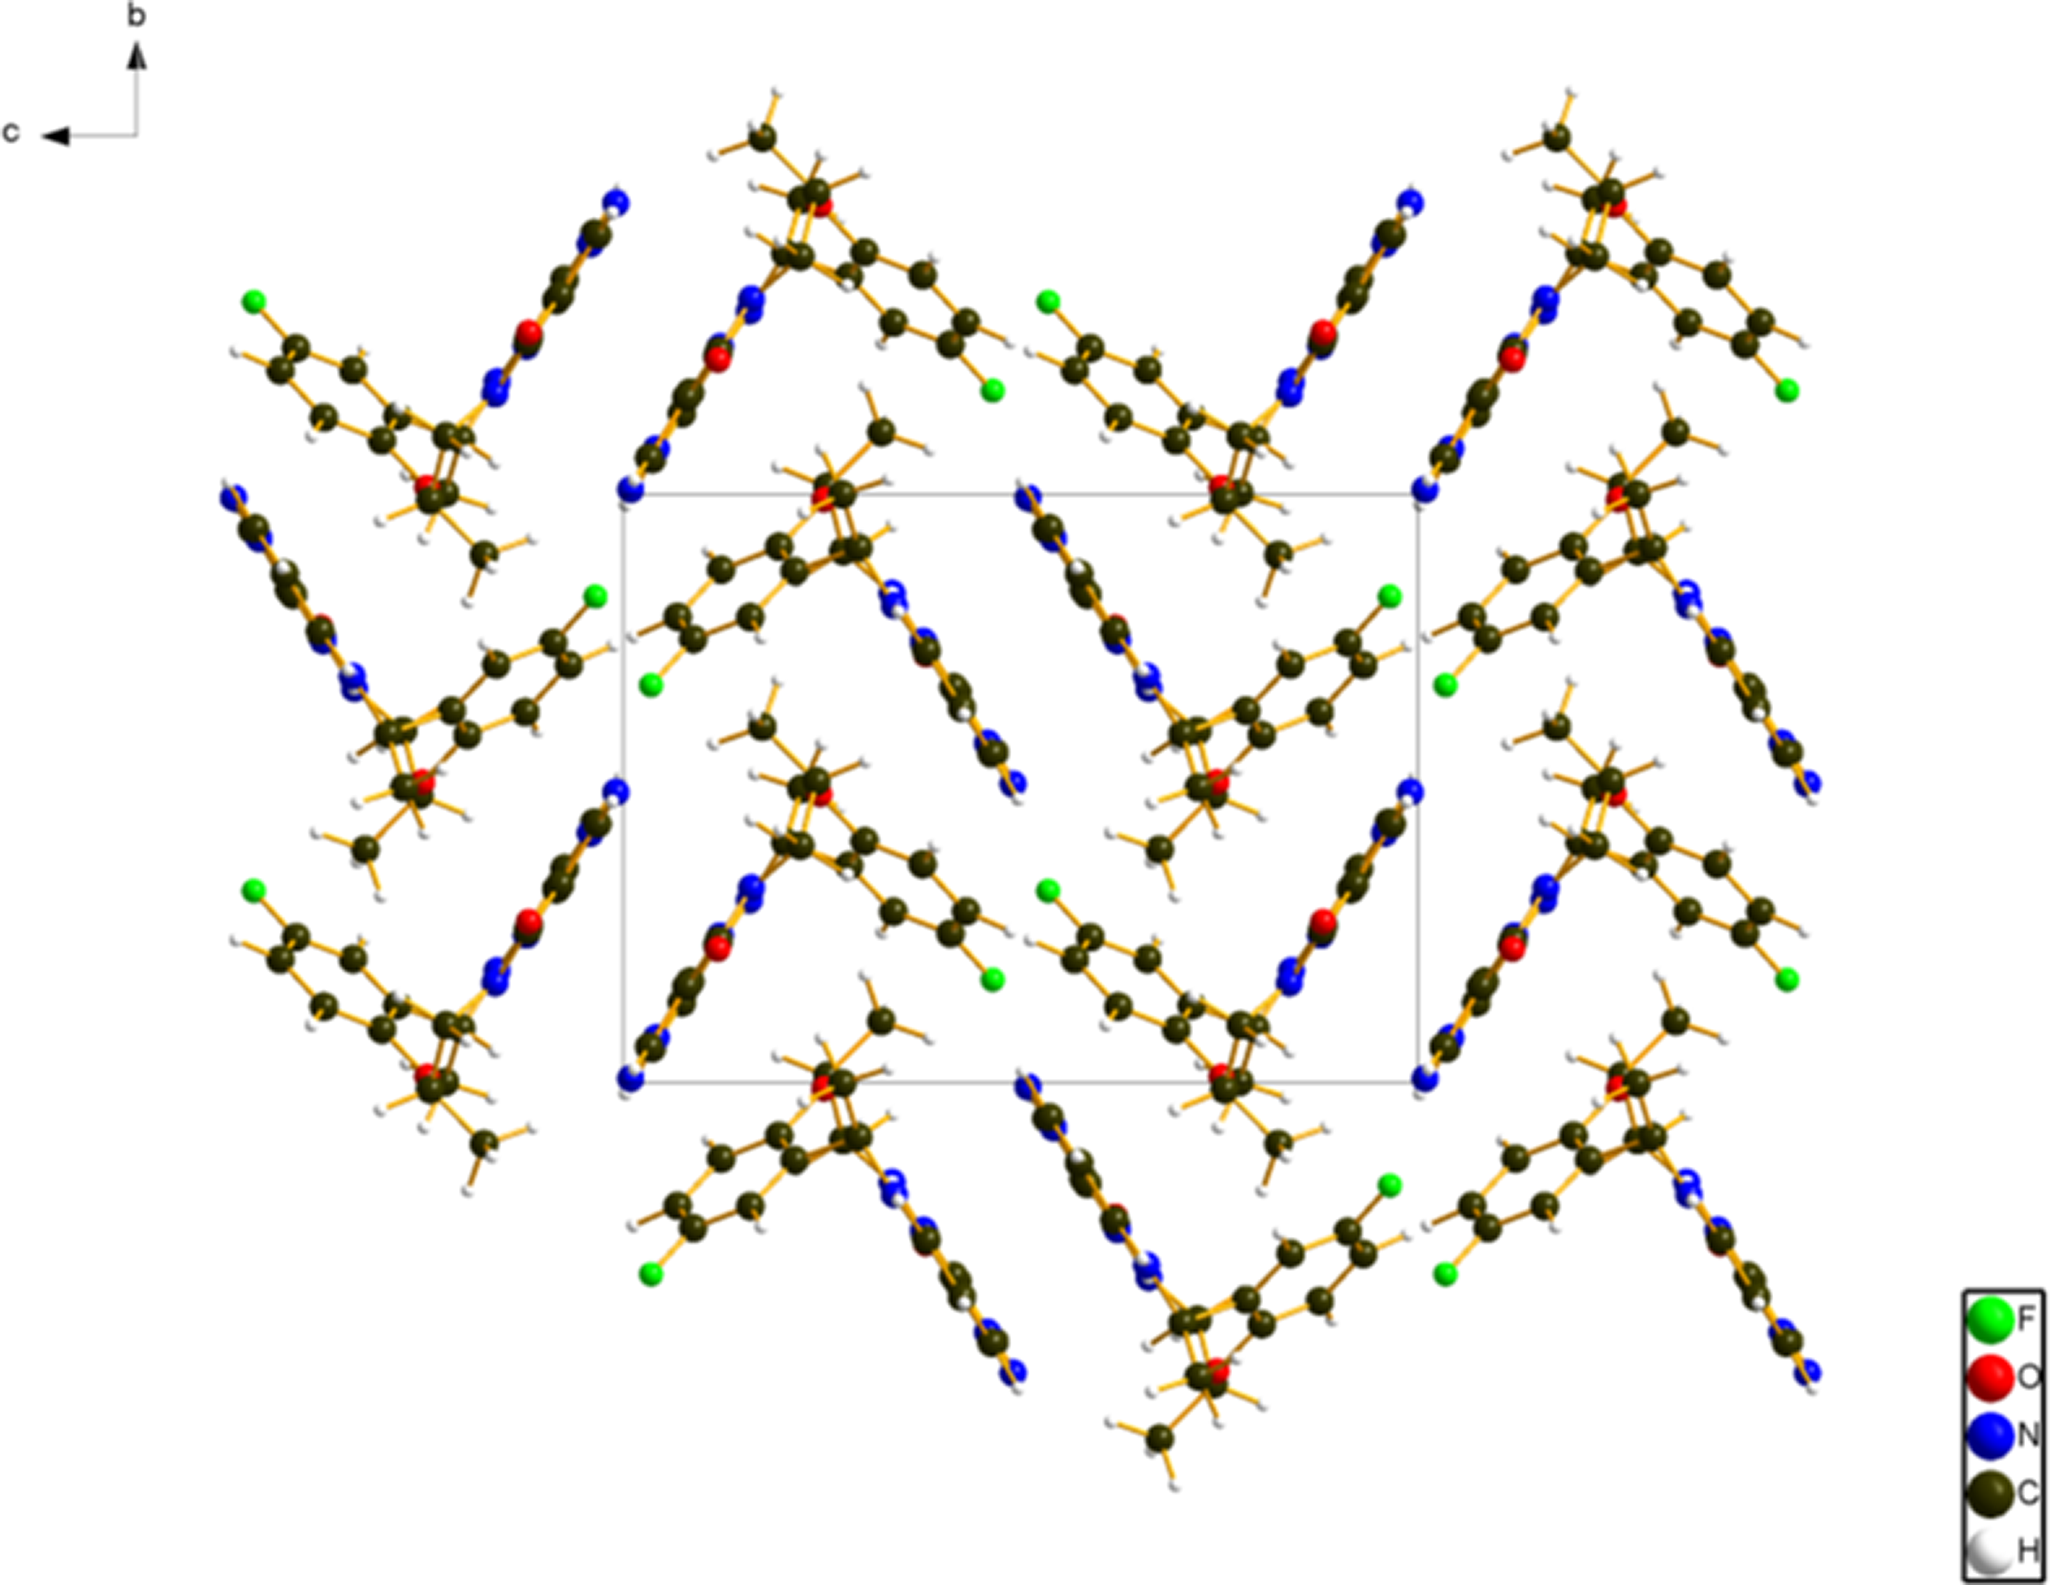
Figure 6. The crystal structure of repotrectinib, viewed down the a-axis. Image generated using Diamond (Crystal Impact, 2023).
Analysis of the contributions to the total crystal energy of the structure using the Forcite module of Materials Studio (Dassault Systèmes, Reference Dassault2023) indicates that the intramolecular energy is dominated by angle distortion terms. The intermolecular energy is dominated by electrostatic attractions, which in this force-field-based analysis also include hydrogen bonds. The hydrogen bonds are better discussed using the results of the density functional theory (DFT) calculation.
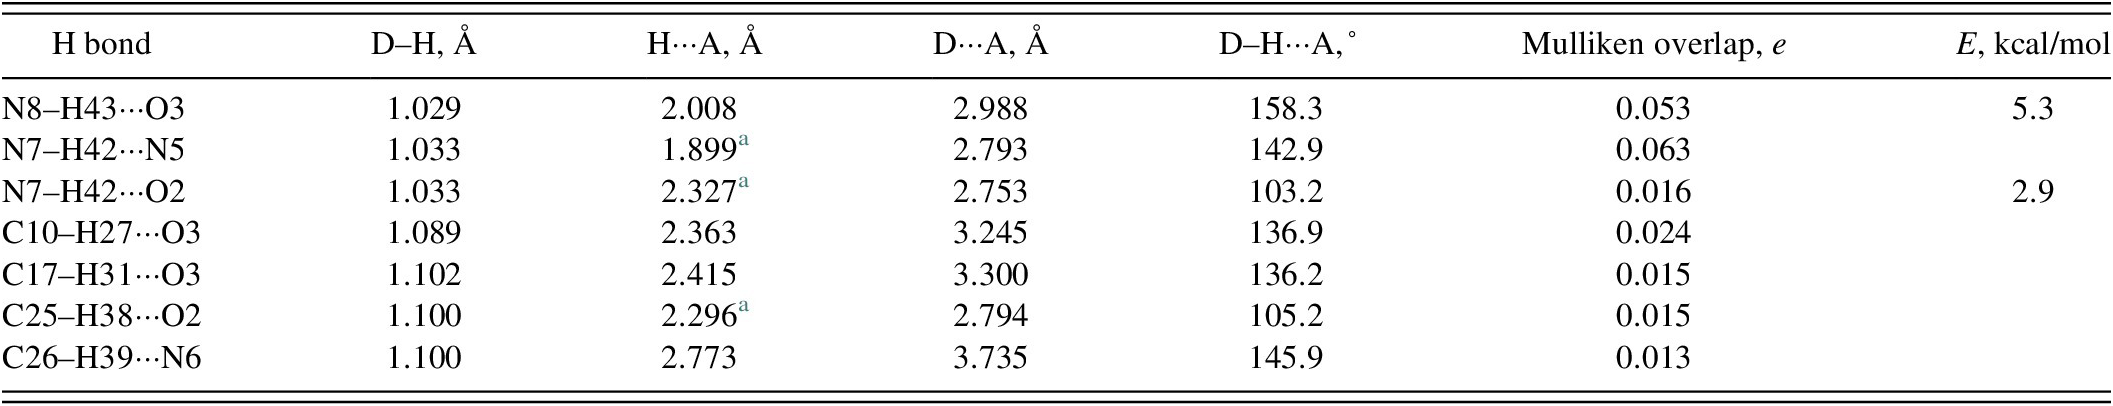
There are several hydrogen bonds in the structure (Table I). The amino group N8–H43 acts as a donor to the carbonyl group O3 to link the molecules into chains along the a-axis with a graph set C1,1(8) (Etter, Reference Etter1990; Bernstein et al., Reference Bernstein, Davis, Shimoni and Chang1995; Motherwell et al., Reference Motherwell, Shields and Allen2000). The amino group N7–H42 forms two intramolecular hydrogen bonds to N5 and O2. The energies of the N–H···O hydrogen bonds were calculated using the correlation of Wheatley and Kaduk (Reference Wheatley and Kaduk2019). Both intra- and intermolecular C–H···O hydrogen bonds, as well as a C–H···N hydrogen bond, also contribute to the lattice energy.
TABLE I. Hydrogen bonds (CRYSTAL23) in repotrectinib
a Intramolecular.
The volume enclosed by the Hirshfeld surface of repotrectinib (Figure 7; Hirshfeld, Reference Hirshfeld1977; Spackman et al., Reference Spackman, Turner, McKinnon, Wolff, Grimwood, Jayatilaka and Spackman2021) is 414.04 Å3, 98.39% of one-fourth of the unit cell volume. The packing density is thus typical. The only significant close contacts (red in Figure 7) involve the hydrogen bonds. The volume/non-hydrogen atom is smaller than usual at 16.8 Å3.
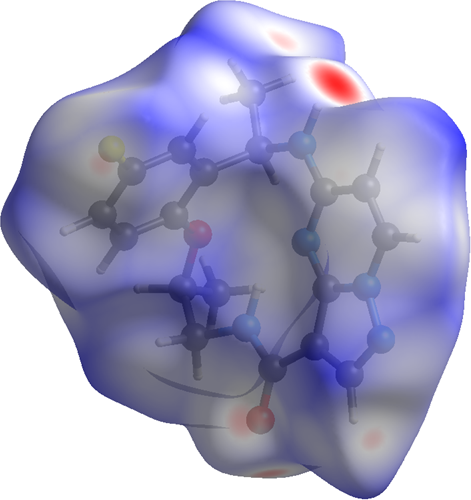
Figure 7. The Hirshfeld surface of repotrectinib. Intermolecular contacts longer than the sums of the van der Waals radii are colored blue/gray, and contacts shorter than the sums of the radii are colored red. Contacts equal to the sums of radii are white. Image generated using CrystalExplorer (Spackman et al., Reference Spackman, Turner, McKinnon, Wolff, Grimwood, Jayatilaka and Spackman2021).
The Bravais–Friedel–Donnay–Harker (Bravais, Reference Bravais1866; Friedel, Reference Friedel1907; Donnay and Harker, Reference Donnay and Harker1937) algorithm suggests that we might expect isotropic morphology for repotrectinib. A second-order spherical harmonic model was included in the refinement. The texture index was 1.015(0), indicating that the preferred orientation was insignificant in this rotated capillary specimen.
DEPOSITED DATA
The powder pattern of repotrectinib from this synchrotron dataset has been submitted to the International Centre for Diffraction Data (ICDD) for inclusion in the Powder Diffraction File. The Crystallographic Information Framework (CIF) files containing the results of the Rietveld refinement (including the raw data) and the DFT geometry optimization were deposited with the ICDD. The data can be requested at pdj@icdd.com.
ACKNOWLEDGEMENTS
We thank Adam Leontowich for his assistance in the data collection. We also thank the ICDD team – Megan Rost, Steve Trimble, and Dave Bohnenberger – for their contribution to research, sample preparation, and in-house XRD data collection and verification.
FUNDING STATEMENT
Part or all of the research described in this paper was performed at the Canadian Light Source, a national research facility of the University of Saskatchewan, which is supported by the Canada Foundation for Innovation (CFI), the Natural Sciences and Engineering Research Council (NSERC), the Canadian Institute of Health Research (CIHR), the Government of Saskatchewan, and the University of Saskatchewan. This work was partially supported by the International Centre for Diffraction Data.
CONFLICTS OF INTEREST
The authors have no conflicts of interest to declare.


 Open access