

I. INTRODUCTION
In 1995, physical test method <941> of the United States Pharmacopeia (USP) entitled, “Characterization of Crystalline and Partially Crystalline Solids by X-ray Powder Diffraction” was published (USP, 1995). The method was subsequently modified (2000), adopted, and harmonized by the European Pharmacopeia and Japanese Pharmacopeia with minor modifications. The method described is an excellent overview of the powder diffraction method and various applications in pharmaceutical analysis. Brittain authored a series of publications (Brittain, Reference Brittain2000a, Reference Brittain2000b, Reference Brittain2001) that referred to this general chapter and provided additional supplemental information on various types of analyses, such as crystallinity and polymorphic determinations. In the original method and subsequent harmonized updates, there are nine cases (A through I) described whereby it is “difficult if not impossible” to determine the phases in a material.
A. Non-crystalline and amorphous substances
B. Components to be identified are present in low mass fraction (below 10 wt.%)
C. Pronounced preferred orientation effects
D. The phase does not have a reference filing in the database used
E. The formation of solid solutions
F. The presence of disordered structures that alter the unit cell
G. The specimen has too many phases
H. The presence of lattice deformations
I. The structural similarity of different phases
In the greater than two decades since USP method <941> was developed, these barriers to analysis and identification have been extensively studied, problems identified, and significantly addressed. In many cases, these prior barriers have been removed and solutions standardized. A significant source of presented and published information addressing these issues has been the Pharmaceutical Powder X-ray Diffraction (PPXRD) symposium series that was started in 1999 and recently had its 15th meeting in 2017 in Hyderabad, India. During the last 20 years, methods for the identification and analysis of amorphous and nanomaterials by powder diffraction have been extensively developed and incorporated into commercial automated software analysis programs. Explosive growth in the Powder Diffraction File™ (PDF®) as well as targeted research programs systematically addressing pharmaceutical references have also addressed many of these issues. Basic improvements in sources, from synchrotrons to microfocus sources, and the developments in advanced detectors, have significantly contributed to the improved performance of benchtop, laboratory and synchrotron diffractometers. The energy selectivity, low photon count efficiency, and very wide linear dynamic range of new detector systems has fundamentally changed many of the root causes of issues A through I. A search through abstracts (http://www.dxcicdd.com/search_dxc/search_dxc.asp) of the Denver X-ray Conference from 2003 to 2017 will produce 72 presentations on new detector technologies and 92 on new sources. A general overview describing many of the instrumental developments has been recently published (Thakral et al., Reference Thakral, Zanon, Kelly and Thakral2018).
Overall, the analysis of pharmaceutical materials has developed significantly whereby historic problems have now become opportunities for greater analysis and insight. In this review, we will discuss each of the issues cited in USP General Chapter <941> and how they have been addressed.
II. EXPERIMENTAL
To systematically study improved methods of analysis and advances in instrumentation, we analyzed approximately 65 prescription drug formulations using a combination of benchtop, laboratory, and synchrotron instrumentation. These data and analyses were also compared to results obtained from numerous literature studies and technical presentations. Presentations from the PPXRD symposium series, pertaining to pharmaceutical analyses, are publicly accessible on http://www.icdd.com/index.php/ppxrd-abstract-search/.These full presentations with links are located at the bottom of the abstract search page, are extensively cited in this review. Wherever possible direct URLs to the full presentations are given.
Approximately 65 prescription drugs were obtained from Main Line Health, Concordville, PA, USA, while the other formulations were obtained from various associates of the ICDD. Crystalline, amorphous, and nanocrystalline excipients and APIs were identified. The commercial products were in a variety of forms, including tablets, caplets, and gel caps. Eleven of these formulations have been studied and published previously (Fawcett et al., Reference Fawcett, Faber, Needham, Kabekkodu, Hubbard and Kaduk2006). The data sets from these prior experiments, and a second set of experiments conducted in 2012–13, were all re-analyzed using PDF-4/Organics 2018 (ICDD, 2017) embedded software and database.
The preparation of a sample for powder diffraction analysis is a common source of errors and is frequently overlooked. Tablets, capsules, and powder blends need to be sufficiently prepared to produce a 1–10 µ, randomly oriented powder, for the X-ray beam. The production of a fine grained powder, independent of the type of specimen holder, helps the analyst to densely pack the specimen without using excessive force that might orient the crystals within the powder. Increased packing density, within a specific specimen volume, and reduction of void space results in more powder in the beam, improving the signal as well as reducing noise. The use of shallow cavity mounts with a zero background holder can control depth penetration and improve resolution. Similarly, the use of a rotating capillary presents a specimen that has a controlled thickness (~1 mm). The challenge is to have sufficient crystallites in position to diffract while obtaining a desirable signal-to-noise ratio. A more detailed description of the required particle statistics for random orientation is provided in textbooks by Klug and Alexander (Reference Klug and Alexander1974) and Jenkins and Snyder (Reference Jenkins and Snyder1996), as well as the publications of Smith (Reference Smith2001) and Elton and Salt (Reference Elton and Salt1996). Reference Whitfield, Huq, Kaduk, Gilmore, Kaduk and SchenkWhitfield et al. have written a detailed description of crystallite statistics and provide many examples that demonstrate how the statistics influence diffraction data in Volume H of the International Tables for Crystallography (Whitfield et al., Reference Whitfield, Huq, Kaduk, Gilmore, Kaduk and Schenk2019). They also discuss the relationships between crystallites and particles and how each can influence a diffraction pattern. The specific method of specimen preparation described below was designed to have sufficient powder in the beam to produce a randomly oriented specimen.
Both tablets and capsules were analyzed. The tablets were photographed and weighed. Typically, 1–3 tablets or capsules were sufficient for an analysis. The tablet weights varied considerably, from 90 to 1400 mg, so enough tablets or capsules were used to provide ~300 mg of fine-grained powder for the analysis. For the capsules, the powder was removed from the capsule, separating the interior contents, and weighed separately, so that the concentration of the API (active pharmaceutical ingredient) could be estimated based on the powder weight. The API content (usually in mg) was always specified on the pharmaceutical packaging. This API concentration and the pharmaceutical manufacturer were also recorded.
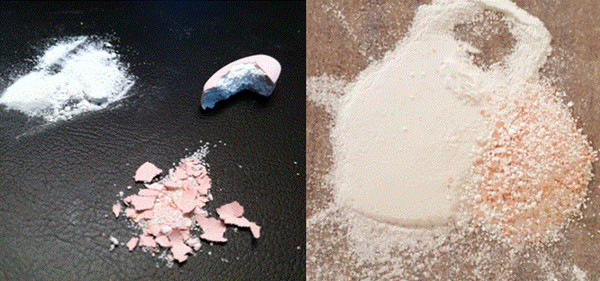
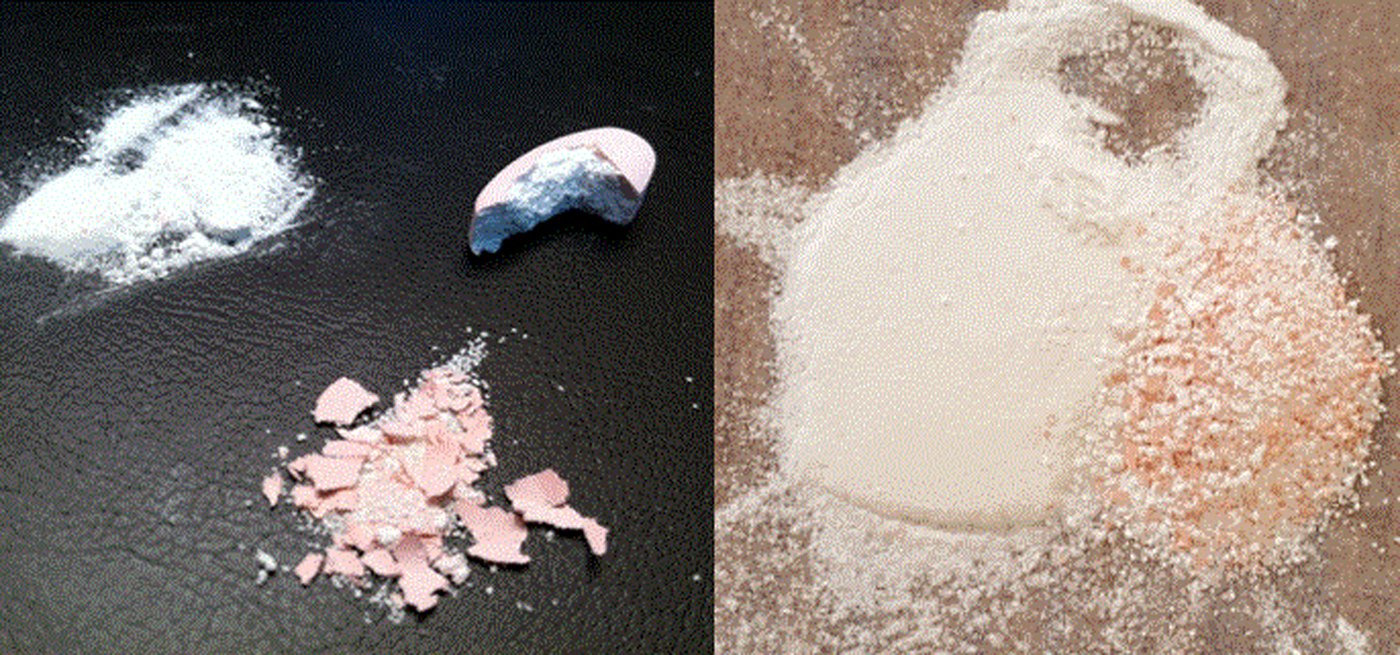
Tablets were ground in an agate mortar and pestle to the consistency of fine dust and then sieved through a 200-mesh filter (74 µ). If there was a large residue >200 mesh, this residue was placed back in the mortar and pestle and reground. For some tablets, this procedure was repeated 3–4 times. For most tablets, this process separated the tablet shell from the powder in the interior of the tablet, as shown in Figure 1. As the analyses demonstrated, many of the tablets contained a polymer or a polymer composite coating. In a few cases, these coatings were analyzed separately.
(color online) Separation of the powder and shell in Allegra® (left) and Eliquis® (right).
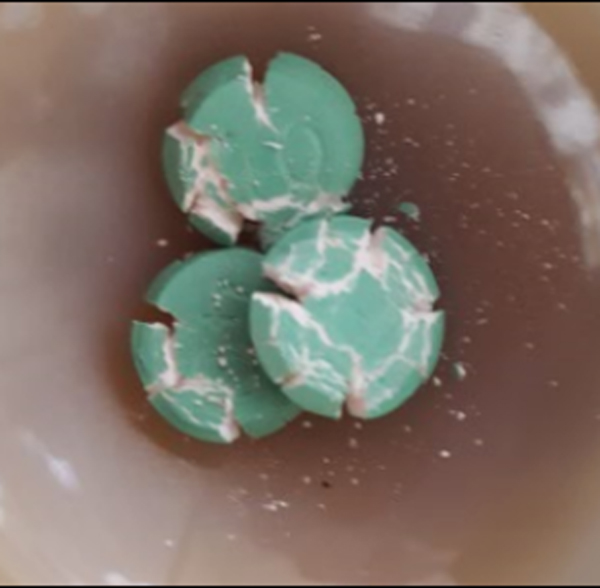
Capsules were broken and the contents visually inspected. In some cases, the contents contained spheres or microspheres (Figure 2). In these cases, the specimens were analyzed as is, because of the expectation that the spheres would randomly orient the crystalline powder. In nearly every case, these data sets did not exhibit any preferred orientation. Using spray dried powder is a well-known technique used to reduce preferred orientation in powder diffraction analyses (Jenkins and Snyder, Reference Jenkins and Snyder1996).
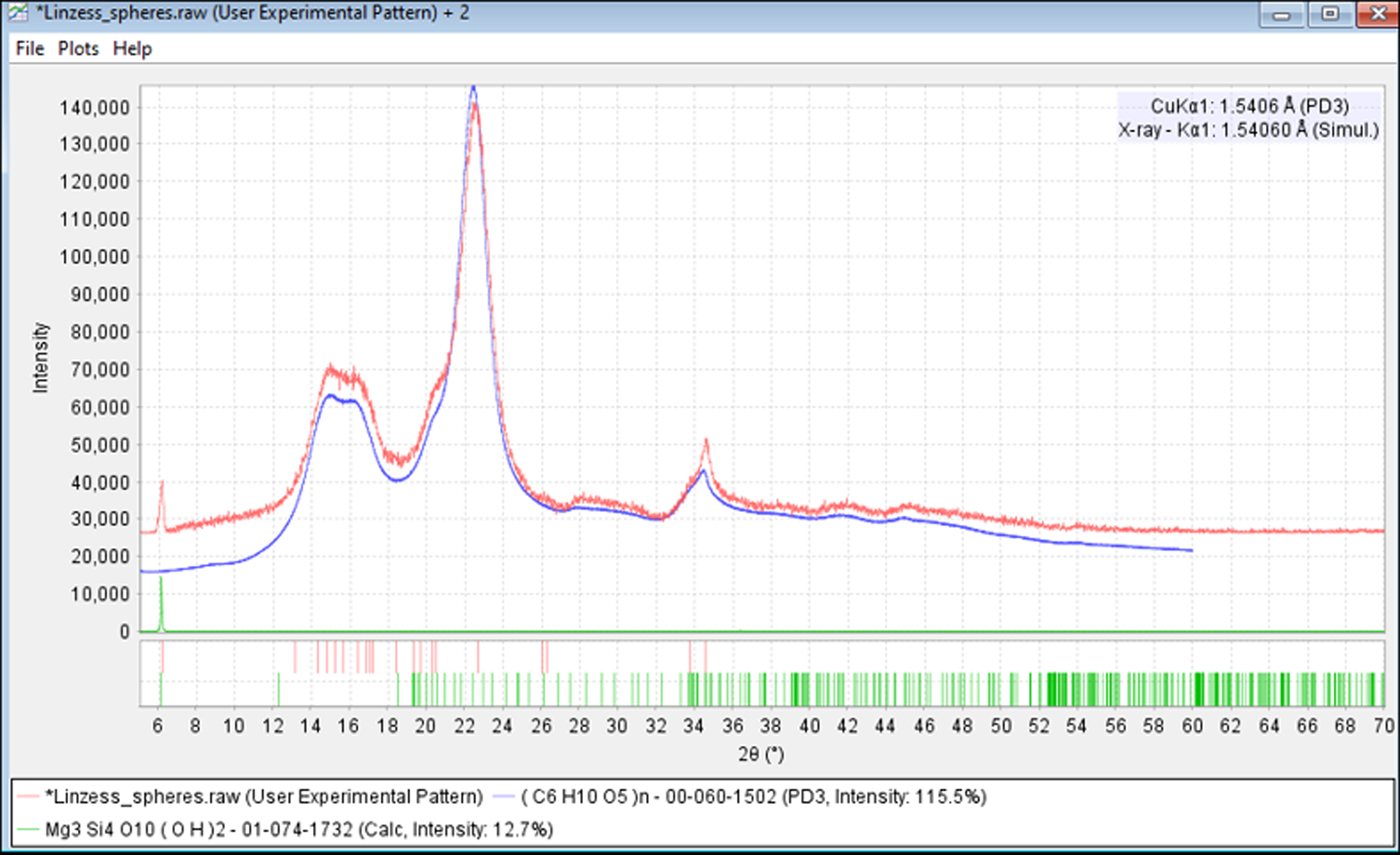
(color online) Microspheres in Linzess®. Shell pieces were removed before analysis. These microspheres were predominately composed of microcrystalline cellulose Iβ.
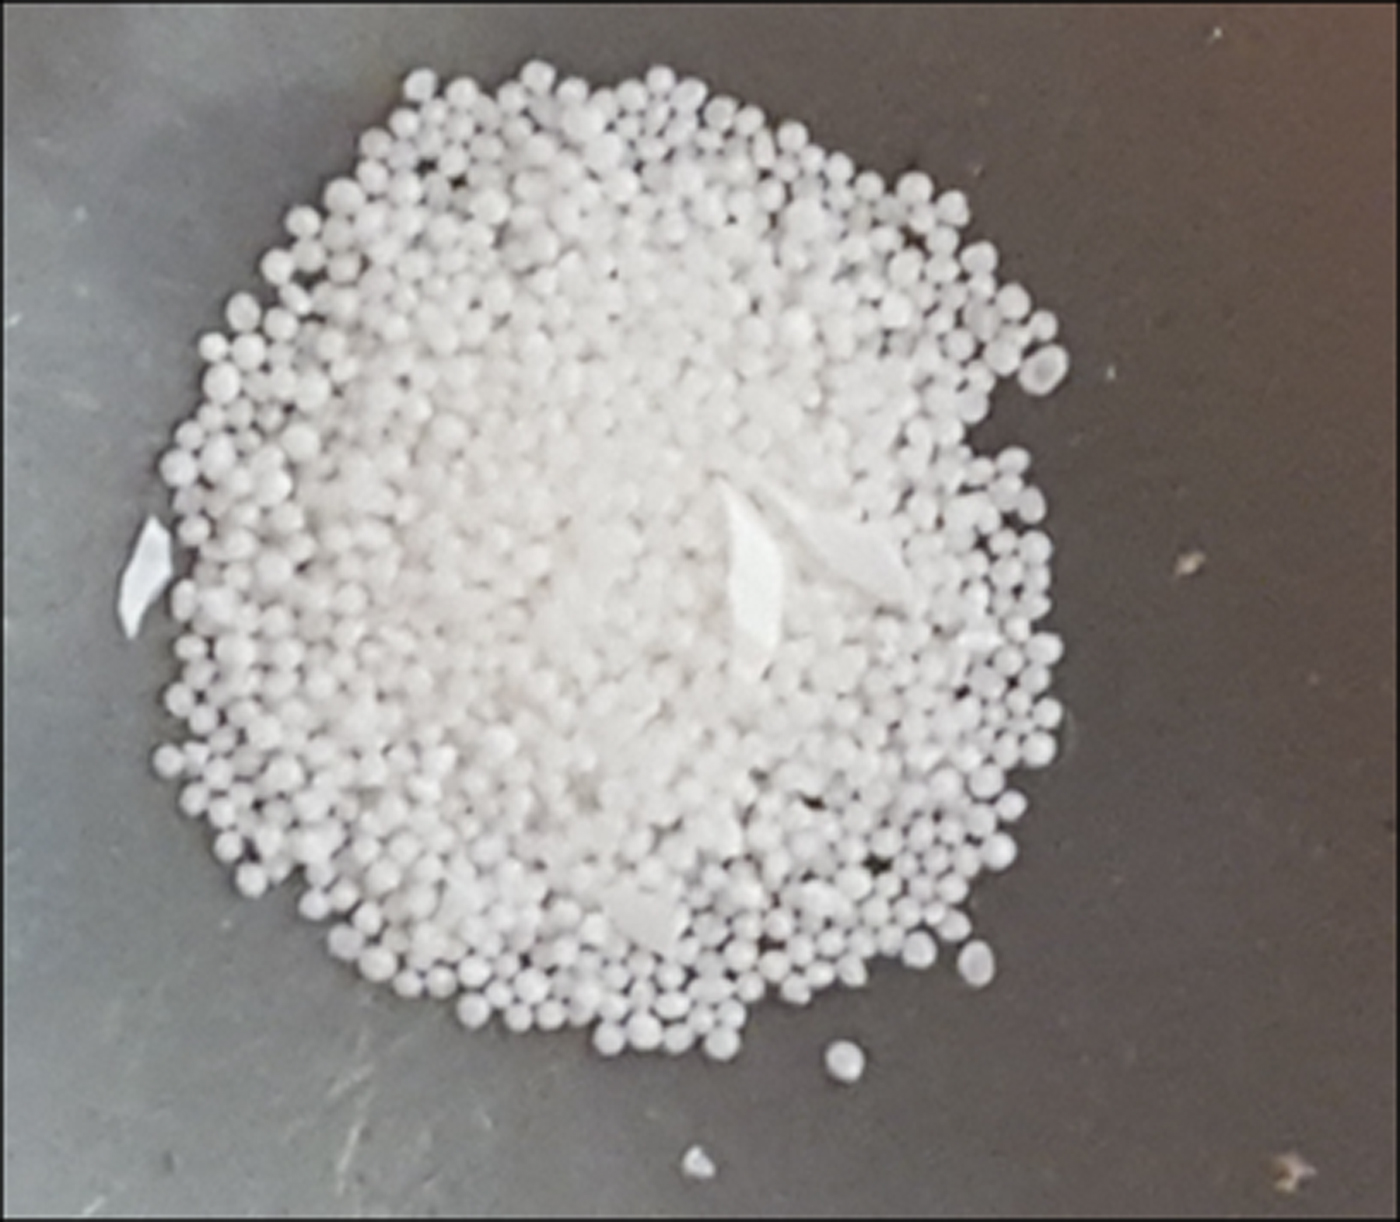
During review of this procedure, concern was expressed that using the intact spheres could result in preferential absorption especially if the sphere microstructure was of a core–shell morphology. In general, the analyses demonstrated that the spherical particles were known excipients, such as cellulose, α lactose monohydrate and sucrose, composed of lightly absorbing elements (C, H, O, N). Preferential absorption would be a concern if the blended API contained a heavily absorbing element and the procedure would need to be changed (i.e. spheres ground) if exact quantitative measurements were desired. Reference Madsen, Scarlett and KernMadsen et al. describe the effects of absorption and microabsorption in detail in their chapter on quantitative phase analysis (QPA) in Volume H of the International Tables for Crystallography (Madsen et al., Reference Madsen, Scarlett, Kleeberg, Knorr, Gilmore, Kaduk and Schenk2019). The website of the APS Beamline 11-BM at Argonne National Laboratory has both tutorials and calculational tools useful for calculating absorption using a variety of wavelengths and sample geometries.
If the capsule contained a powder, then the powder was prepared in an identical manner to the tablets where a fine powder was produced that passed through a 200-mesh sieve. The capsule itself was not analyzed in most cases.
Powders were front loaded into a cavity mount sample holder. Minimal pressure was used to pack the samples, so that a cavity was filled with a flat surface without orienting the particles. In all cases a zero background off-cut Si crystal was used to control specimen thickness without background interference. The authors consider this an essential piece of equipment in analyzing pharmaceuticals, since pharmaceuticals are typically low absorbing and there is appreciable depth penetration. The ~1 mm depth is a compromise to have sufficient particles in the beam with good resolution. If one does not want to compromise, often two specimens are required. A thin specimen can reduce depth penetration and optimize resolution, whereas a thicker specimen helps with particle statistics and intensity measurements that might be needed for quantitative phase identification.
For 47 data sets analyzed in 2018, the X-ray powder diffraction patterns were measured on a Bruker D2 Phaser diffractometer using CuKα radiation (5–70° 2θ, 0.0202144° steps, 1.0 s step–1, 0.6° divergence slit, 2.5° Soller slits, 1 mm scatter screen height). The diffractometer was equipped with a LINXEYE silicon strip detector. Therefore, powder patterns were collected in approximately 1 h. The scan range was specifically selected to enhance phase identification using total pattern analysis methods (Fawcett et al., Reference Fawcett, Crowder, Kabekkodu and Kaduk2011). The low-end limit of 5° 2θ enabled the detection of many common silicates and stearates used in pharmaceutical formations. A lower limit may be needed for certain materials with large unit cells (i.e. peptides, proteins). The upper limit, 70° 2θ, ensured that all high-intensity diffraction peaks are captured, while also establishing a background that is critical for analyzing non-crystalline components. The ICDD has shown in recent years that most amorphous materials used in pharmaceutical analyses scatter over a wide 2θ range. A wide angular range, with areas of little or no intensity, also benefits the automated search/match analysis algorithms that are common in commercial software. The benefit of this analysis range is increased efficiency and accuracy since these methods analyze the total pattern and use areas of little or no intensity to eliminate candidate materials that have peaks in these areas. The 65° 2θ range with a 0.02° step size results in 3250 data points used in the total pattern analysis. It should be noted that there are several total pattern methods based on structural refinements (i.e. Rietveld analysis) and these methods usually prefer data collection to at least 100° 2θ (Kaduk and Reid, Reference Kaduk and Reid2011).
The use of a 200-mesh sieve is not the theoretical optimum, a 325 mesh or finer sieve is preferred (Klug and Alexander, Reference Klug and Alexander1974). However, most particle reduction techniques increase the probability that the specimen can be negatively affected by reducing or destroying crystallinity or providing energy that might trigger a phase transition. Cryogenic mills and attrition mills are beneficial reducing input heat and energy while obtaining an optimum particle size, though they can cause micro strain. Pharmaceuticals in particular, being soft materials, are subject to degradation upon grinding. Another very practical concern was increased caking observed at finer particle sizes. As shown in the Results, the majority of specimens contained excipients with strong hydrogen-bonding capability (i.e. various sugars and celluloses) that are very susceptible to humidity and water absorption at smaller particle sizes and higher surface areas. The 200-mesh sieving was a practical compromise that produced desired results without deleterious side effects.
In all cases, diffraction and optical microscopy data were carefully analyzed to detect evidence of orientation, granularity, and phase degradation. The specimen preparation procedure was modified, and additional analyses performed as needed. Data were analyzed before and after any specimen procedure modifications to monitor phase purity and degradation.
During the initial analysis of this study, we noted that the procedure described above produced a pattern with a maximum peak intensity of ~10 000 counts for most formulations, with only a few cases of orientation and no observable degradation. The described procedure worked for the objective of our study which was to determine the formulations of a large number of materials. If we were trying to quantify low concentrations of ingredients, or performing a Rietveld refinement with high accuracy, further particle size reduction would have been required (Madsen et al., Reference Madsen, Scarlett, Kleeberg, Knorr, Gilmore, Kaduk and Schenk2019).
All tablets and capsules were prepared as described above. A few select pharmaceuticals were targeted for additional analyses. The authors had several formulations that were described as “extended release” and we found that some of these tablets instructed the user to “swallow the tablet whole” and not to crush the tablet before swallowing. In some, we found that it was very difficult to crush the tablet by hand so we used a “rock crusher” to impact the tablet and break the coating (Figure 3). The coating was then physically separated and analyzed separately.
(color online) Tablets of Uloric®, after impact by a rock crusher that fractured the hard outer shell.

Tablets of Singulair®, Allegra® were also analyzed at the Argonne National Light Source synchrotron at beam line 11-BM. The purpose of these experiments were to determine if high-resolution data helped the identification process, and in the case of Singulair®, to investigate the detection of the amorphous API, sodium montelukast. In these cases, specimens were prepared as finely ground powders and placed in a capillary. The full preparation and data collection methods are described elsewhere (Kaduk et al., Reference Kaduk, Crowder, Zhong, Fawcett and Suchomel2014). Approximately 11 tablets were previously analyzed on full-power laboratory diffractometers and method published (Fawcett et al., Reference Fawcett, Faber, Needham, Kabekkodu, Hubbard and Kaduk2006). The prior work was exclusively on tablet formulations.
Tablets of Centrum® Performance multi-vitamin pill were used as an instrument and phase identification reference material. Specimens derived from ground tablets have been taken from the same lot for over a decade and analyzed on a wide variety of instruments. This formulation is a good reference material because it contains five phases in concentrations between 5 and 15 wt.%, four phases from 1 to 5 wt.%, and another four phases in concentrations between 0.1 and 0.9 wt.%. The formulation contains amorphous materials, nanocrystalline, and crystalline phases. The ten phases above 1 wt.% composition contribute over 400 diffraction peaks in the 5–70° 2θ scan range, so the analyst can explore the influence of various sources, instrument settings, and preparation techniques on the ability to detect and quantify phases. The use of this material in formulation analysis was first described by Fawcett et al. (Reference Fawcett, Faber, Needham, Kabekkodu, Hubbard and Kaduk2006), then described in some detail by Kaduk in Volume H of the Crystallography Tables (Kaduk, Reference Whitfield, Huq, Kaduk, Gilmore, Kaduk and Schenk2019). The authors have tabulated and summarized performance data from ten analyses taken by five analysts on six different diffractometers including synchrotron, laboratory and benchtop units. This information was used to determine appropriate settings on the Bruker D2 Phaser that would provide good results. This included using 0.6 mm divergence slits, 1 mm anti-scatter slits, and shallow cavity zero background holders to somewhat compensate for the poorer angular resolution inherent in small radius diffractometers used in benchtop systems. In particularly crowded patterns, for example, for Trintellix™ in Figure 4, the divergence slits were reduced to 0.2 mm, step size reduced to 0.01°, and a second data set was collected over a 2 h period.
(color online) Powder diffraction pattern of Trintellix™ taken with a 0.6 mm divergence slit (green, top), and pattern taken with a 0.2 mm divergence slit (blue, middle). The bottom (red) pattern is the PDF reference pattern of β-D-Mannitol (PDF# 02-069-8458).
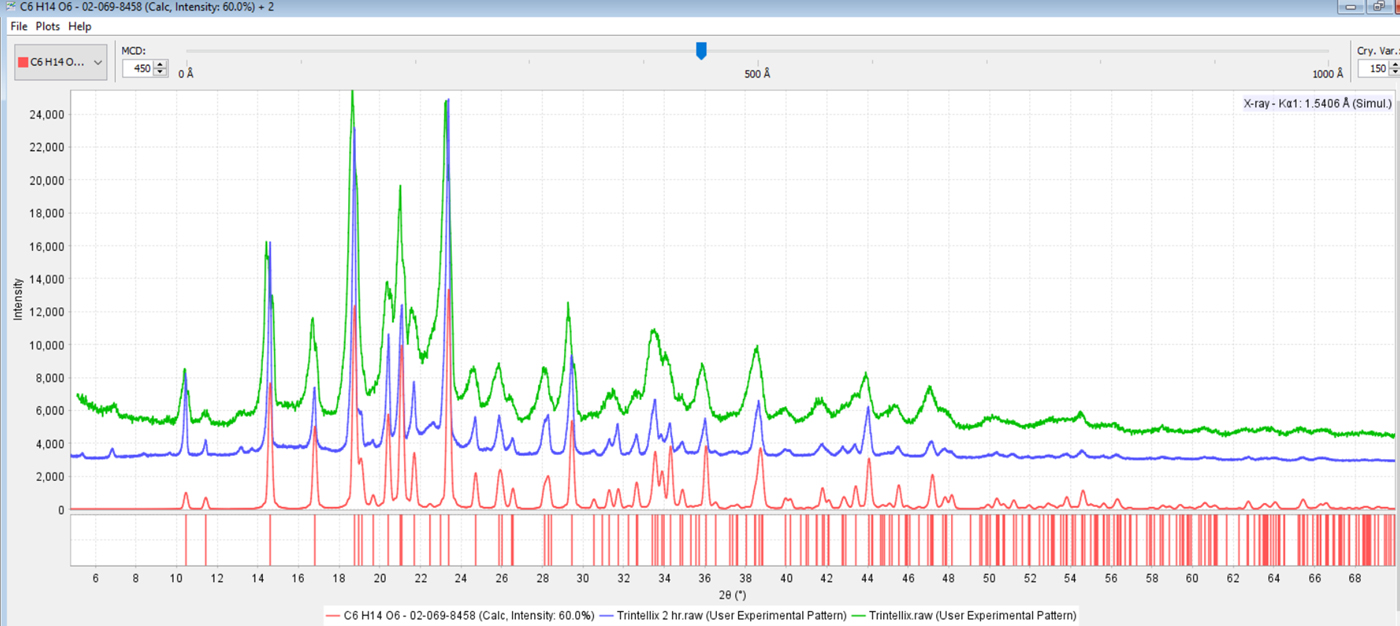
The resolution difference as seen in the pattern of Trintellex™, shown in Figure 4, compared with the reference pattern of the excipient β-D-Mannitol. One can see the dramatic differences in peak shape and peak overlap in the 18–24° 2θ region. The overall complexity of the diffraction pattern of β-D-Mannitol often masks minor phases in formulations that contain this excipient in high concentrations. In Trintellix™, careful analysis of the low-angle region enables the identification of the API, vortioxetine hydrogen bromide.
All data sets were analyzed using PDF-4/Organics 2018 as the database (ICDD, 2014a). Phases were identified using the program SIeve+ that is embedded with the database (ICDD, 2014b). Select samples were also analyzed for phase identification using the programs HighScore Plus 4.7.a, EVA 12, Match 3.0, and Jade 2010. The purpose of using five search/match programs was to evaluate analysis results and common features that are described in this review such as the common use of filters, background correction algorithms, instrumental error corrections, and search/match windows.
III. DISCUSSION
1. Material identification issues
A. Non-crystalline and amorphous substances
Since the founding years of powder diffraction and the famous experiments of Peter Debye (Debye, Reference Debye1915), scientists realized that non-crystalline and amorphous materials can systematically and reproducibly scatter X-rays. However, the scatter was not coherent and could not be described by conventional means of an indexed unit cell, d-spacing, and intensity (d, I) listings. The analysis and identification of non-crystalline and amorphous materials required full pattern characterization that included means for both detecting and analyzing incoherent and coherent scatter. Great progress has been made in the last 20 years in both improved methods and better references. Advances in detector technology have improved energy selection, greatly reducing noise from fluorescence and Bremsstrahlung radiation, and advances in sources are putting higher fluxes into the focal area. The combination has provided dramatic increases in signal to noise for worldwide laboratory diffractometers when compared with earlier generations. The ICDD systematically started adding full experimental digital pattern references for non-crystalline materials in 2008 with specific targets of excipients and pharmaceuticals. Systematic data collection programs established full pattern reference collections of polymers (Gates et al., Reference Gates, Blanton and Fawcett2014). There have been systematic and published studies of common excipient families such as cellulosics (Fawcett et al., Reference Fawcett, Crowder, Kabekkodu, Needham, Kaduk, Blanton, Petkov, Bucher and Shpanchenko2013), povidones (Teng et al., Reference Teng, Bates, Engers, Leach, Schields and Yang2010), gelatins, and glycols (Blanton, Reference Blanton2013, Reference Blanton2016). The development and application of similarity indexes (Faber and Blanton, Reference Faber and Blanton2008) have provided a means for identifying amorphous and non-crystalline materials by their scatter profiles. The development of full pattern analysis algorithms (Scardi et al., Reference Scardi, Leoni, Lamas and Cabanillas2005, Reference Scardi, Leoni and Faber2006) enabled researchers to analyze nanomaterials and the influences of stress and strain on small particles.
In practice, we can now analyze common excipients such as microcrystalline cellulose, polyethylene glycol, povidones, hydroxypropyl cellulose, and nanocrystalline lactose monohydrate with an ease that used to be reserved for crystalline materials. This is an important set of materials as they are listed by the International Pharmaceutical Excipients Council as some of the most frequently used excipients in pharmaceutical formulations (IPEC, 2018).
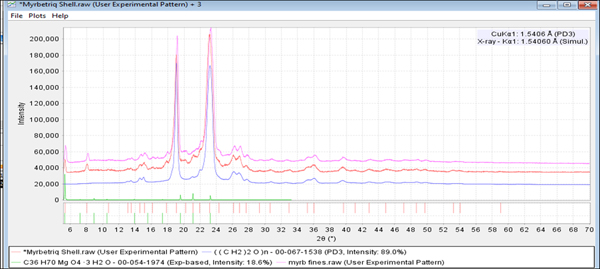
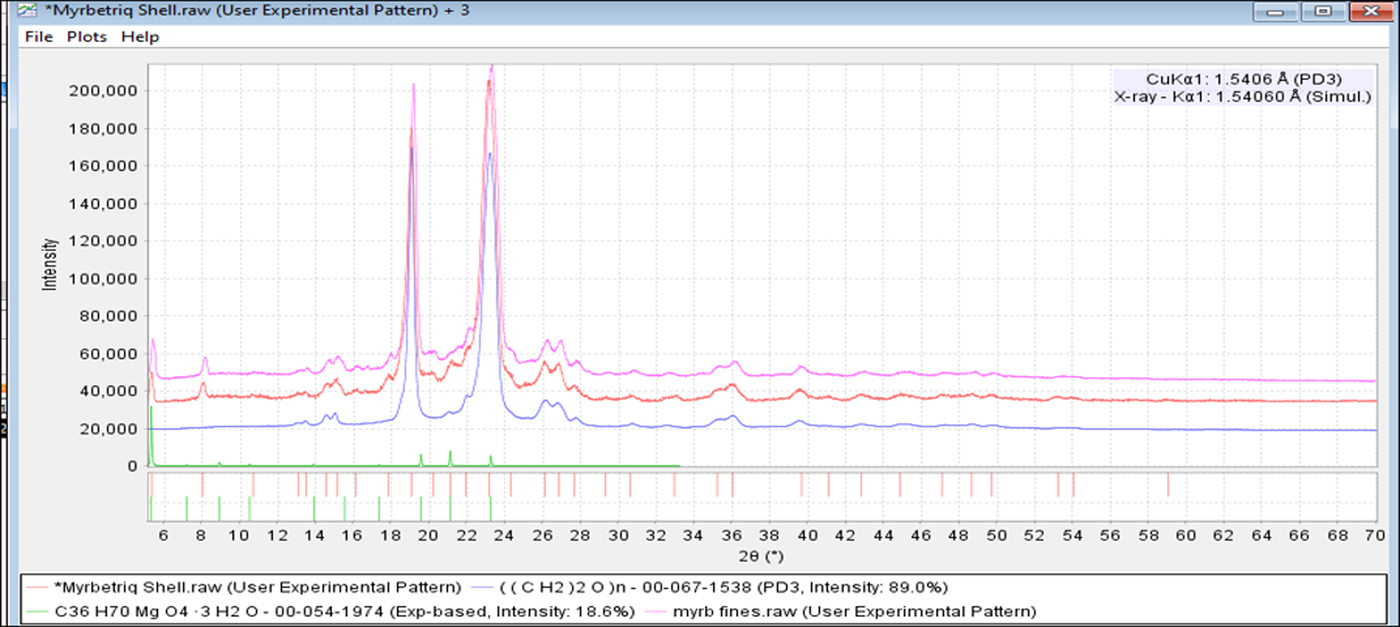
Powder diffraction data were collected on two distinct Myrbetriq® specimens and compared. The two scans were analyzed and peaks of significant intensity were identified using the full digital reference pattern PDF# 00-067-1538 for PEG 7500 (polyethylene glycol). The remaining weaker peaks are the API and magnesium stearate dihydrate.
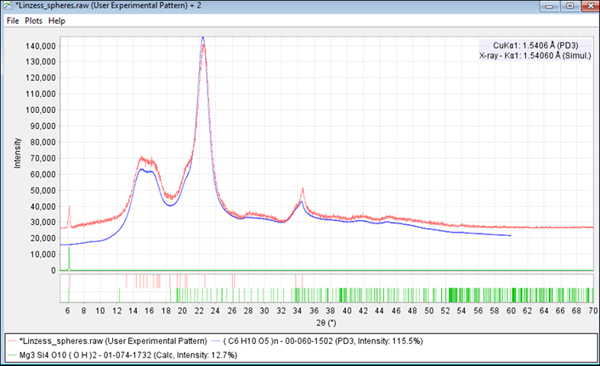
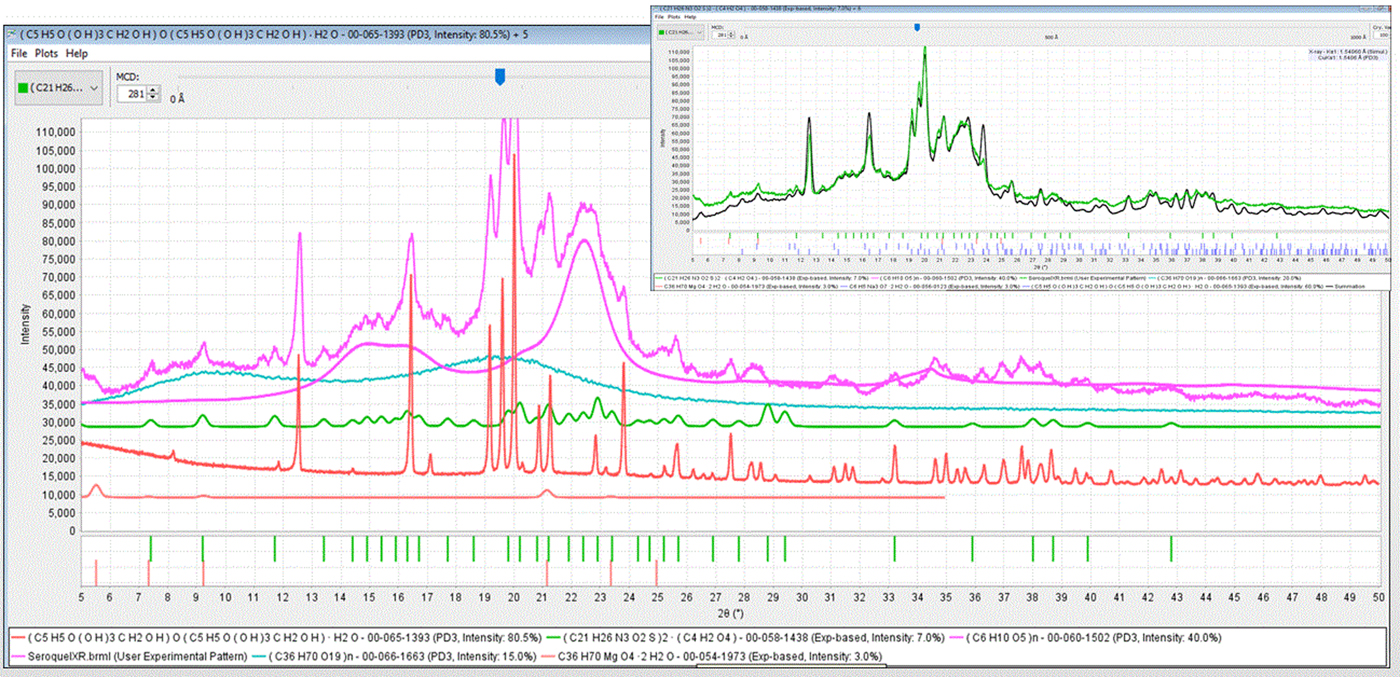
As shown in Figures 5–7, the ability to detect and identify non-crystalline and nanocrystalline materials depends on the development of appropriate reference patterns. A significant library of excipients has been compiled for the PDF-4/Organics database by the ICDD.
(color online) The identification of microcrystalline cellulose in Linzess®. The experimental data are in red and reference in blue. Microcrystalline cellulose contains nanometer-sized microfibrils of cellulose Iβ with amorphous cellulose (Fawcett et al., Reference Fawcett, Crowder, Kabekkodu, Needham, Kaduk, Blanton, Petkov, Bucher and Shpanchenko2013).
(color online) Total pattern analysis of Seroquel XR®. The experimental diffraction pattern is shown (top, purple) with PDF reference patterns for five identified components: microcrystalline cellulose (pink, PDF# 00-060-1502), amorphous hydroxypropylcellulose (aqua, PDF# 00-066-1663), crystalline lactose monohydrate (red, PDF# 00-065-1393), magnesium stearate trihydrate (fushia, PDF# 00-054-1973), and the active pharmaceutical ingredient quetiapine fumarate (green, PDF# 00-058-1438). The inset (upper right corner) shows a comparison of a scaled summation plot of all components (black) and the raw data (green).
(color online) Two diffraction patterns (two specimens) of Myrbetriq® compared with the reference pattern of PEG 7500 (blue, PDF# 00-067-1538).
B. Components to be identified are present in low mass fraction (below 10 wt.%)
For X-ray powder diffraction, like most spectroscopy methods, detection limits are a function of counting statistics (i.e. signal to noise) and resolution. The general detection guideline for crystalline materials of 10 wt.% in USP method <941> was appropriately based on the equipment and methods used when the USP method was initially developed. This general guideline is no longer appropriate. Since 1995, there have been improvements in several areas, including sources, optics, and detectors, that have greatly improved resolution and signal to noise. While the advantages of powerful sources (i.e. synchrotrons) have been well publicized, the reduction and elimination of noise by using zero background holders, energy discriminating detectors, and improved focusing optics has lead to significant improvement using all types of diffractometers (benchtops, laboratory, and synchrotron). The reduction and elimination of noise is particularly important in pharmaceutical analyses where the analytes are often weakly scattering materials composed of light elements and there is a strong prevalence of diffusely scattering amorphous and nanocrystalline materials. Between 1995 and current times, position-sensitive detectors have replaced single point detectors in the majority of laboratories on a worldwide basis, fundamentally increasing signal strength in all applications. For example, a LINXEYE™ detector having a 2.5° receiving aperture and 0.02° step size can collect 125 data points simultaneously, compared with a single point detector.
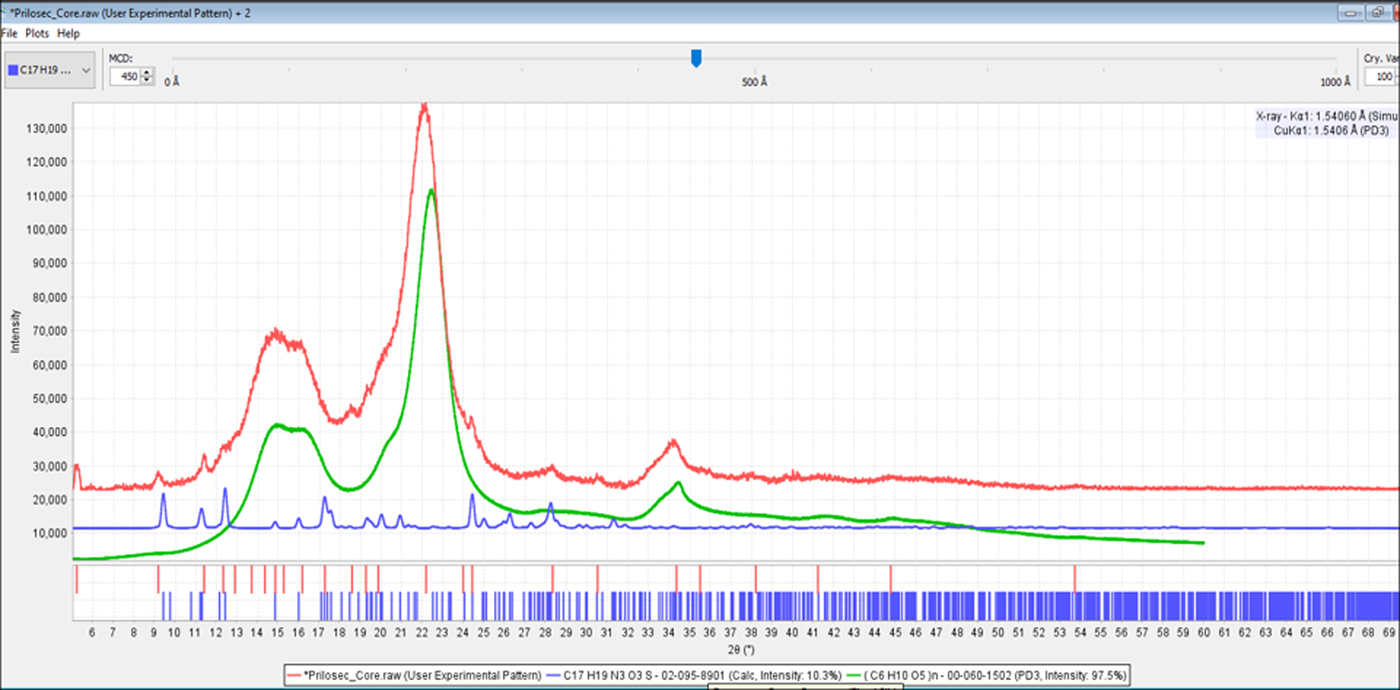
In this study, every crystalline API with >3 wt.% concentration (typically 5 and 10 mg dosage) was successfully identified using a low-power 300 Watt benchtop generator in a 1 h experiment. The experimental system did have a long fine focus source and LINXEYE™ detector that generated a signal of 10 000 counts per second in most experiments. The active pharmaceuticals in the low dosage formulations (1–10 wt.%) of Lipitor®, bystolic, Benicar®, Namzaric®, Prilosec OTC®, Trintellix™, and Eliquis® were easily identified from 1 h powder diffraction scans using routine data collection procedures. Figure 8 shows the identification of omeprazole (Mg) in Prilosec OTC®. The stated concentration of omeprazole was 6 wt.%.
(color online) Identification of the ingredients of Prilosec OTC®. The raw data pattern (red, top) with reference patterns of cellulose Iβ (green, PDF# 00-060-1502) and omeprazole (Mg) (blue, PDF# 02-095-8901).
Numerous investigators have reported detection limits below 1 wt.%, and even as low as ~0.05 wt.% crystalline API (Gozzo, Reference Gozzo2013). Gozzo systematically demonstrates the multiple advantages of using synchrotrons, focusing optics, and efficient energy-selective detectors. Gozzo and coworkers compared data on detection capabilities for identical samples taken on laboratory and synchrotron sources.
An overview of advances in source and detector technology developed at Bruker-AXS was presented by He (Reference He2013). Similar advances have been made by other diffractometer and detector manufacturers (Fawcett, 2018). Beckers and Bethke (Reference Beckers and Bethke2011) have demonstrated low-level detection (0.5 wt.%) of both crystalline and amorphous materials during in situ laboratory pharmaceutical analyses. Published workshop presentations on QPA provide an overview of developed methods and their capabilities (Kern et al., Reference Kern, Beckers, Gozzo and Dinnebier2015, Reference Kern, Gozzo and Reinle-Schmitt2016). Numerous cases are cited where detection limits using laboratory equipment are 0.1 wt.% for crystalline materials and 1 wt.% for amorphous materials (Beckers, Reference Beckers2015). Recently published data on the API linezolid (Sun et al., Reference Sun, Hu, Zhou and Gu2017) demonstrate <1% detection limits for polymorph II using a laboratory diffractometer. The three largest global diffractometer manufacturers have all demonstrated <1% detection of crystalline pharmaceutical materials with their laboratory units. The referenced experiments and methods used to determine low-level detection limits cited above were not “heroic” in the sense of pushing the method to its limits. For example, extremely long counting times and the combination of multiple data sets were not used. In one thorough investigation (Bates, Reference Bates2013), scrupulous elimination of all sources of noise and optimized sample preparation and equipment lead to the detection limit of 0.13 wt.% absorbed water, by careful examination of the diffuse scatter in sucrose lyophilizates.
The above detection limits were driven by advances in instrumentation. Automated methods for quantitative analysis have also become commonplace and greatly facilitate timely and accurate analyses. Overviews of various QPA methods have been described (Madsen et al., Reference Madsen, Scarlett and Kern2011, Reference Madsen, Scarlett, Riley, Raven, Mittemeijer and Welzel2012; Kern et al., Reference Kern, Madsen, Scarlett, Kolb, Shankland, Meshi, Avilov and David2012). Methods include Rietveld (Madsen et al., Reference Madsen, Scarlett, Riley, Raven, Mittemeijer and Welzel2012), LeBail, PONKCS (Partial or No Known Crystal Structures), full pattern fitting (using several programs, including Smith et al., Reference Smith1987), classical standard addition, and method variants with internal or external standards. An important conclusion from these reviews is that numerous methods work, and each method has its strengths under certain circumstances, but that method protocols must be strictly adhered to. Many methods were originally developed for inorganic or mineral analyses; however, workshops at PPXRD have clearly demonstrated applications to pharmaceutical analyses (Kern et al., Reference Kern, Beckers, Gozzo and Dinnebier2015, Reference Kern, Gozzo and Reinle-Schmitt2016) as well. Similarly, amorphous materials can now be analyzed by their scattering profiles when using full pattern methods, as shown for amorphous Montelukast™ (Fawcett et al., Reference Fawcett, Kabekkodu, Zhong, Gindhart, Blanton and Blanton2015), povidones (Teng et al., Reference Teng, Bates, Engers, Leach, Schields and Yang2010), and absorbed water (Bates, Reference Bates2013). With full pattern methods, numerous authors cite the critical importance of careful background measurements to separate various scattering contributions of the instrument and specimen holder from the analyte of interest.
Various international round robins have been conducted relative to QPA. Round robins conducted by the International Union of Crystallography (Madsen et al., Reference Madsen, Scarlett, Cranswick and Lwin2001) and the International Centre for Diffraction Data (Fawcett et al., Reference Fawcett, Needham, Faber and Crowder2010) both found that operator error is the largest contributor to inaccurate results. Common operator errors include inadequate specimen preparation, as well as failure to apply known, and available, methods that deal with instrumental errors (i.e. orientation, displacement, and instrument calibrants). With structure-based methods, operator errors include the use of inappropriate reference structures in the initial refinement. In this case, known errors include using a high- or low-temperature reference determination for a room temperature experiment, selection of the wrong polymorph, or use of a low-quality reference that by definition includes identified errors. Software can often compensate for many types of errors but only if the error is identified, and the proper models are applied. Granularity, usually caused by large asymmetric crystals, is a frequent problem in pharmaceutical analyses, and often causes catastrophic failure in both identification and quantitative analysis.
Users performing quantitative phase analyses also need to be careful about processing, temperature, and humidity conditions. The processing could occur during formulation (i.e. mixing, tableting, packaging), or during specimen preparation, whereby the API or excipient could hydrate/dehydrate or change polymorphic form (completely or partially).
The authors do not report an absolute detection limit because the limits have been constantly lowered in the recent past, and the limit is heavily dependent on the equipment used and experimental design. While detection, like most analytical techniques, is a function of signal to noise, there are many ways to enhance signal and lower noise. Detectors are now available that are both sensitive to extremely low count rates and have linear ranges over millions of counts. The former are being used in scattering experiments such as SAXS and PDF analyses, and the latter have heavy use in the world's synchrotrons. However, while often developed for synchrotron applications, new detectors have greatly enhanced both laboratory and benchtop diffraction systems. In our studies of pharmaceutical formulations, we used three benchtop systems from three different manufacturers; each was equipped with a modern position sensitive detector and highly focused X-ray source delivering signal strengths to the detectors that used to be reserved for full size laboratory equipment.
Improved instrumentation and analysis tools have also enabled the analysis of very small crystals and quantities of materials. As a general rule of thumb, if you can see the material with an unaided eye, it can be analyzed. Many excellent examples of microanalysis capabilities include the cumulative work on organics, organometallics, and pharmaceuticals by Bhuvanash and Riebenspeis in the X-ray Diffraction Laboratory of Texas A&M University using both powder diffraction and single-crystal techniques (Clearfield et al., Reference Clearfield, Reibenspies and Bhuvanesh2008). A program for the rapid identification of designer drugs has been developed at the Spring-8 synchrotron (Hashimoto et al., Reference Hashimoto, Hanajiri, Yasuda, Nakamura, Mizuno, Honda, Hayakawa, Nishiwaki and Kimua2017) where single crystals obtained by Japanese law enforcement agencies can be quickly analyzed and then the single-crystal structures converted to powder reference powder patterns (Smith, Reference Smith1963) for the Powder Diffraction File for use by global law enforcement agencies. Barely visible, sub-milligram quantities of powders have been analyzed and identified using the methods described in this report, using well-aligned zero background holders and powders carefully centered at the focal area of the beam optics. Often creative specimen mounts are required to precess, rotate, vibrate, or otherwise move the specimen to get sufficient planes in position to diffract for an identification.
C. Pronounced preferred orientation effects
Many pharmaceutical ingredients, including most APIs, are organic compounds of high molecular connectivity and volume and low crystallographic symmetry. Such materials often crystallize as needles, platelets, or other highly asymmetric crystal shapes. The asymmetric shapes tend to align “flat” along the xy direction of a powder diffraction cavity specimen holder, or they align along the capillary length in capillary mounts. If sufficient force is used to pack down the powder, the crystals will align with their long dimensions perpendicular to the force direction (transverse in a capillary, xy in a cavity). Mechanical rotation can help reduce this orientation, but most mechanical devices rotate in one or two dimensions so they do not eliminate orientation. The preferred method to eliminate or reduce orientation is to reduce the particle size, reducing the asymmetry. The general guideline, established by Klug and Alexander et al., is to reduce particle sizes below 1 µ. As noted in several texts, mechanical particle reduction is not without its own problems as the materials may degrade by introduction of mechanically induced defects, transform into another polymorph, or lose crystallinity altogether. The heat generated by mechanical treatments is also a concern, and methods such as attrition milling or cryogrinding are frequently suggested for use with soft pharmaceutical materials.
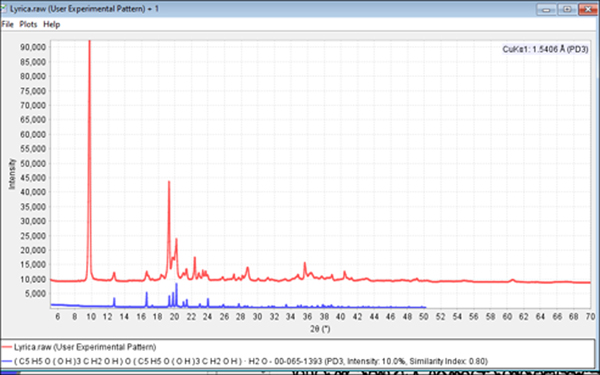
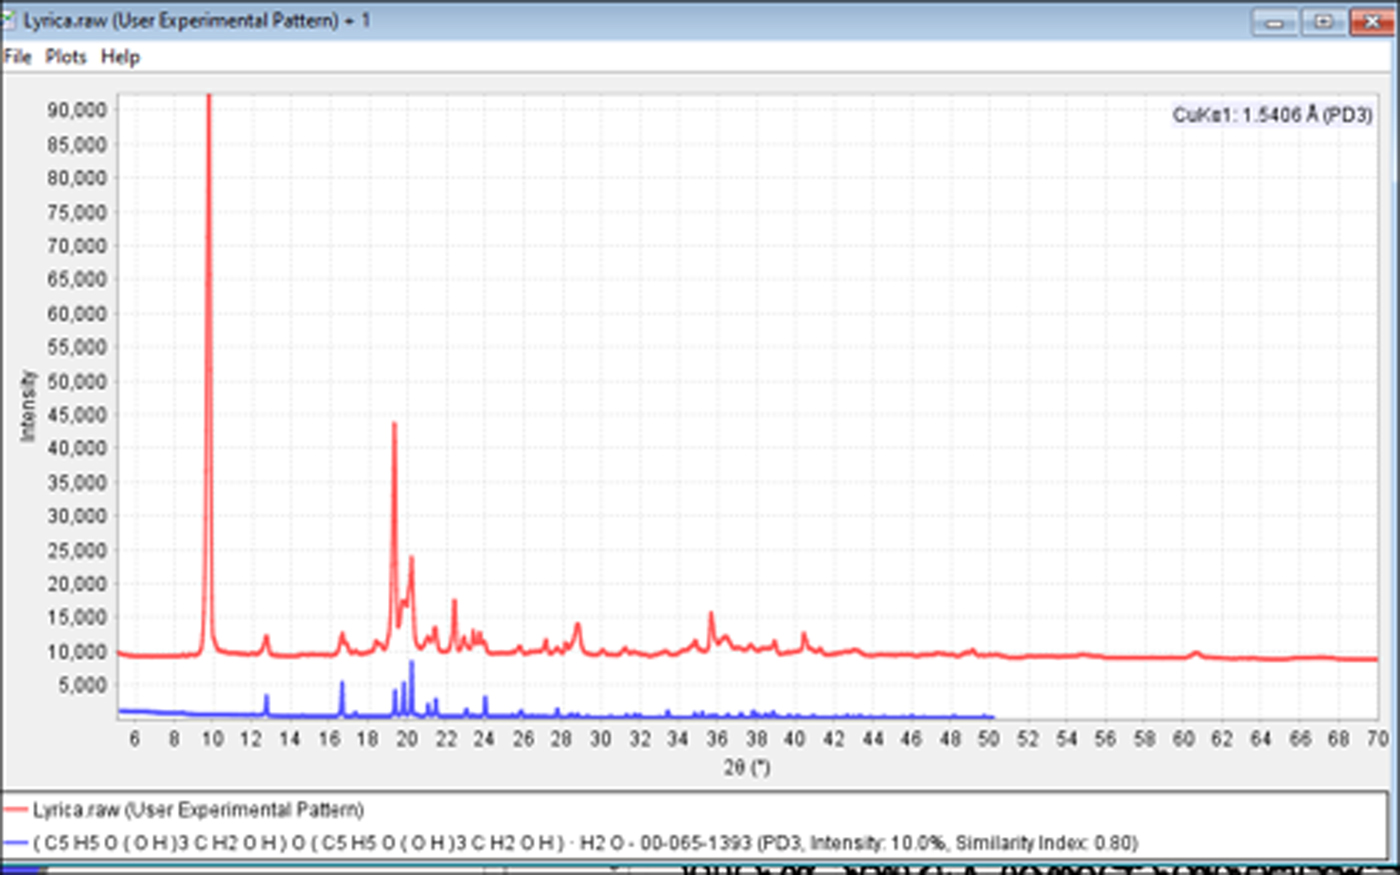
An excellent example of the problems caused by orientation can be demonstrated in the formulation analysis of Lyrica®. Capsules containing 50 mg of the API pregablin were broken for analysis. The capsule ingredients were a fine powdered dust. The fineness of the “dust” is an indication that the particle size is near the optimum range for a powder diffraction experiment so the specimen was prepared with minimal sample pretreatment, resulting in the data shown in Figure 9. For an experienced powder diffractionist, there are visual indicators of an orientation problem. These included several extremely sharp peaks and a maximum pattern intensity that was significantly higher than most pharmaceuticals analyzed under similar conditions. The phase identification results were completely wrong and all the strong candidate phases were false positives. This is because the highly oriented phase of pregablin is being compared to reference patterns of randomly oriented materials. Since the intensity distributions between the API and reference were in complete disagreement, the correct phases were mathematically eliminated as candidates. Unfortunately, the authors have learned this lesson in the past and often spent fruitless hours and days trying to identify oriented samples. In this case, the pattern indicators and search match results with incorrect chemistry and poor matching statistics led the investigators to re-examine the original powder by light microscopy.
(color online) Powder diffraction pattern from Lyrica® encapsulated powder (red) and PDF reference pattern for excipient, α-lactose monohydrate (blue, PDF#00-065-1393).
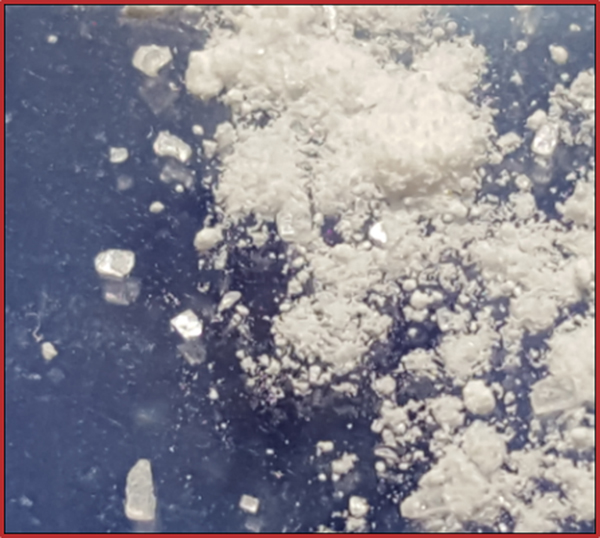
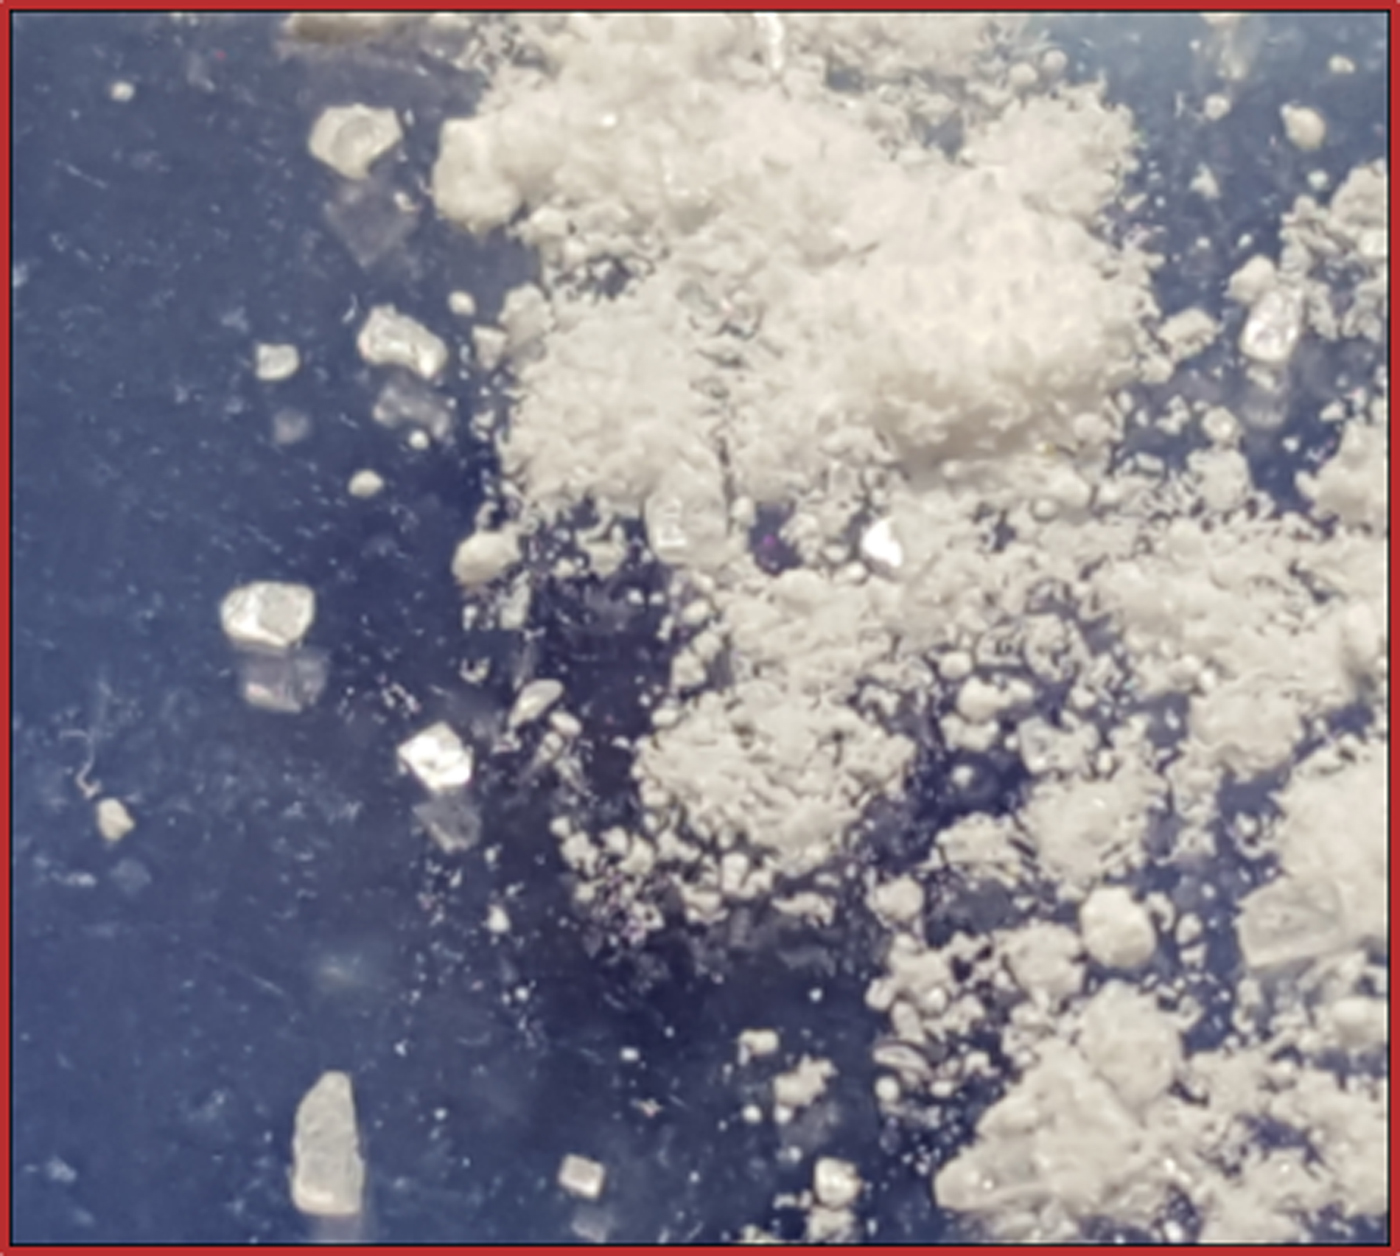
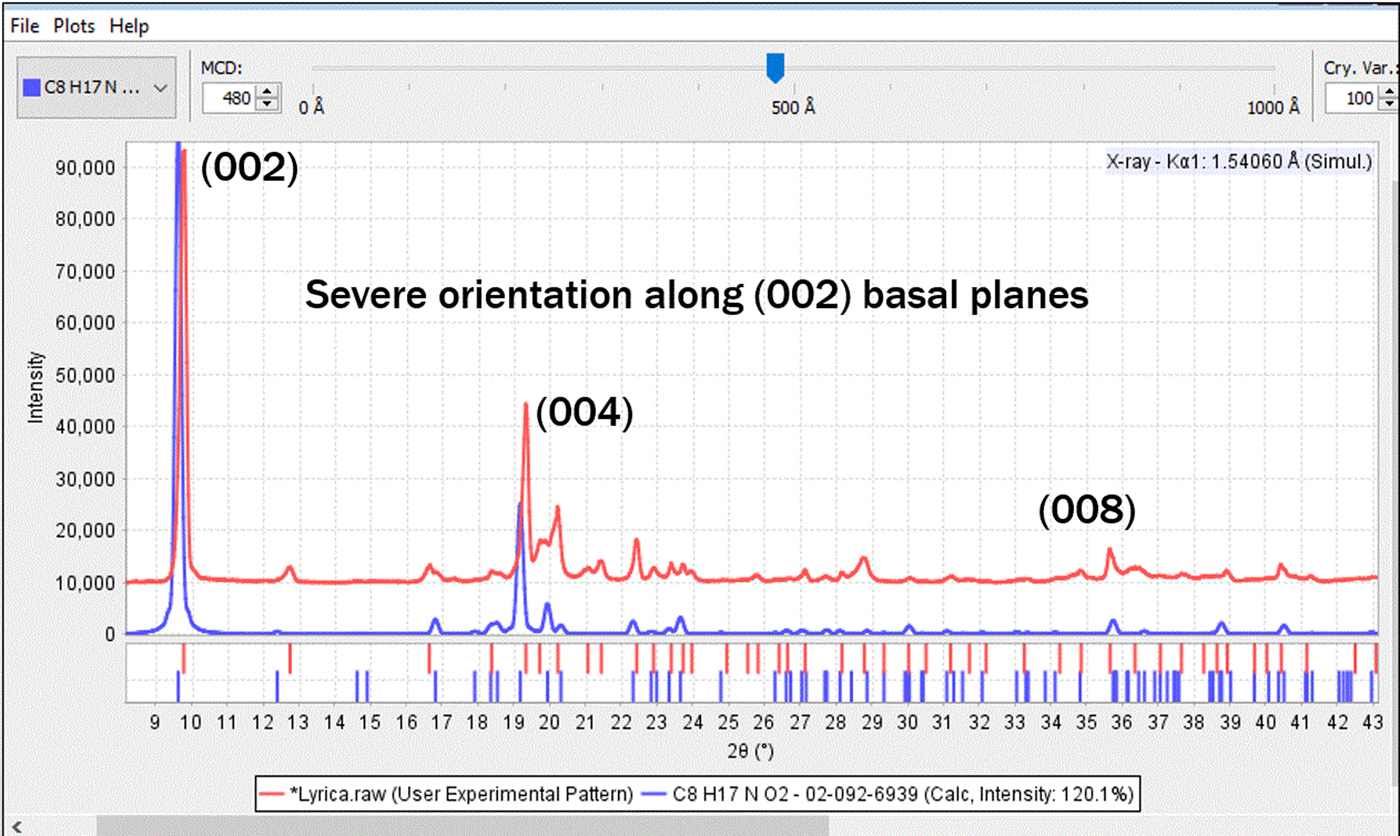
Microscopic examination (Figure 10) revealed that the fine white powder masked the presence of larger, clear, blocky prisms. Mineralogists might refer to this as “rocks in the dust”. We now know that the fine powder is lactose monohydrate (not oriented) and the large block crystals are pregablin, which aligned along the basal plane direction. There were two ways that this problem was solved. The first (and easiest) is that the sample was reground and reanalyzed, producing a randomly oriented powder. The second method is to make an educated guess as to the correct API, and then to mathematically model the orientation until you get a match. Method 2 is relatively easy in a formulated commercial product, but more difficult with a true unknown. Fortunately, in the last 20 years, most commercial search/match and data analysis programs, as well as most Rietveld analysis programs (Rietveld, Reference Rietveld1969), now include a March–Dollase or equivalent function such as spherical harmonics to model orientation. These functions were not commonly available in commercial software at the time that USP method <941> was written. Using the March–Dollase function and the indexed reference pattern PDF# 02-092-6939, the experimental pattern is accurately modeled having an (002) crystallographic orientation. Both methods were used and both successfully identified the phases. In the case of regrinding, more time is spent in preparing the specimen, but time is saved in the analysis step since the data can be rapidly analyzed without the need for orientation modeling.
(color online) Fine powder from Lyrica® capsules showing two distinct morphologies.
In looking at Figure 11, the match is not perfect because there is a second major phase that can now be identified as lactose monohydrate, once the oriented pattern of pregalin is accounted for.
(color online) The experimental pattern of Lyrica® (red) compared to PDF reference pattern of API pregablin with March–Dollase orientation function applied along the (002) lattice plane (blue).
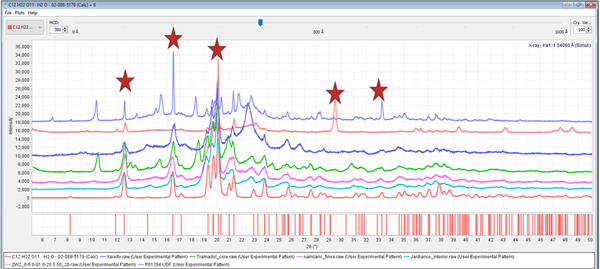
Excipients may also orient, and the authors have found that lactose monohydrate and brushite, commonly used excipients, have asymmetric crystal shapes and frequently orient. During the analysis of Effexor® and the vitamin Centrum Performance®, we found severely oriented lactose monohydrate and brushite, respectively. Lactose monohydrate is the most commonly used excipient ingredient that we have found in our formulation analyses. This excipient is also prepared in several different morphologies that included fine dust powder, larger particle size powder, spheres, microspheres, and microchips. Some of the manufacturers formulation processes act to randomize the excipient and to others orient it. A range of orientations and their resultant diffraction patterns are shown in Figure 12.
(color online) The diffraction patterns, from the top, of Effexor®, Lipitor®, Xarelto®, tramadol, Namzaric®, and Jardiance®, are compared to reference PDF 02-088-5179 of α lactose monohydrate. The sharp peaks characteristic of oriented crystals are highlighted by stars in the patterns of Lipitor® and Effexor®, oriented along the (011) and (020) lattice plane, respectively.
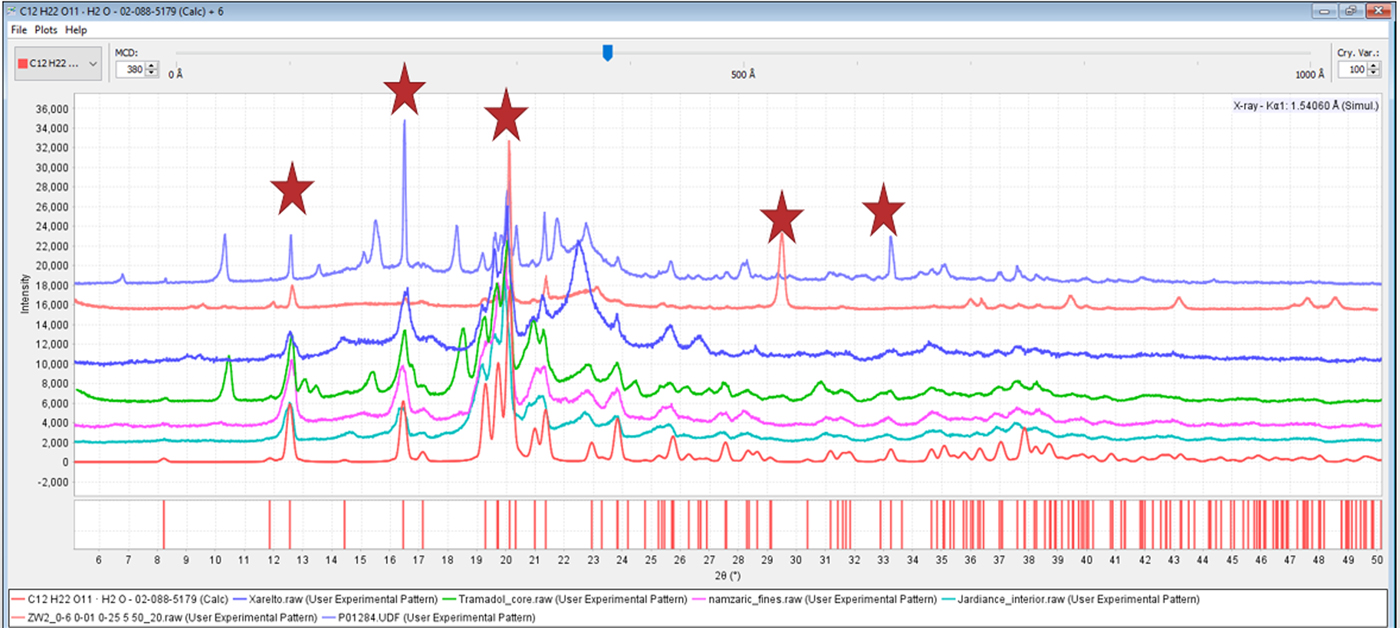
As one would expect when using random oriented references, the patterns of highly crystalline, randomly oriented α lactose monohydrate could be easily identified using automated methods. The automated results for Effexor® and Lipitor® were completely unreliable unless the orientation was either accounted for by modeling, or eliminated by preparation methods prior to the automated analysis. In these cases, the severity of the orientation causes the intensities to vary significantly, interfering with the identification process. It should be noted that most modern search/match software has the ability to vary intensity weighting in the search/match process. Alternatively, algorithms such as the Fink and Long 8 methods, available with ICDD databases, place more emphasis on low-angle peaks and less on the intensities and can also help in certain situations. These methods help in cases of minor orientation, but most automated processes do not handle severe orientation.
Severe orientation problems usually cause a dilemma in the analysis. An orientation model cannot be accurately applied until the phase is identified with an indexed reference pattern. However, the identification itself can be severely impaired by the non-random intensities of the oriented phases. This is why we recommend that specimens be reground and reanalyzed if one has difficulty analyzing all the phases in a formulation. If this is done, and the specimen was previously oriented, the solution becomes obvious, as the intensities will visibly change and trend toward the reference pattern, facilitating automated identification. One may also observe that additional phases are identified as the software can now correctly eliminate phase intensities, calculate an accurate residual, and then identify successive phases.
D. The phase does not have a reference filing in the database used
Historically, the lack of reference standards has been a major problem in phase identification of pharmaceuticals. In the case of APIs, manufacturers and research groups tend to keep their diffraction data and crystal structures as proprietary information, particularly in the early stage development processes where patents may not be filed or efficacy fully explored. On the other hand, in early stage development, there is not much need for formulation analysis or questions on drug validity and counterfeiting. Once a drug enters the marketplace, there is incentive for the manufacturer, government, and academic laboratories to provide reference data relative to material verification and quality control required for regulatory and enforcement policies. These common practices mean that there is usually a delay with newly commercialized drugs between product introduction and the appearance of an adequate reference pattern. Therefore, database organizations must be diligent in keeping up with new drug releases in order to provide good service to the pharmaceutical and law enforcement communities. There have been several programs, such as grant-in-aid, targeted data acquisition, and editorial programs, developed specifically by the ICDD to get new drugs and excipients into the Powder Diffraction File™ databases as quickly as possible (Figure 13).
(color online) Annual additions to the pharmaceutical subfile references in PDF-4/Organics. The spike in published references between 2005 and 2008 was because of a historical review and reclassification program. One can see an underlying steady growth in new pharmaceuticals from 1950 to recent times.
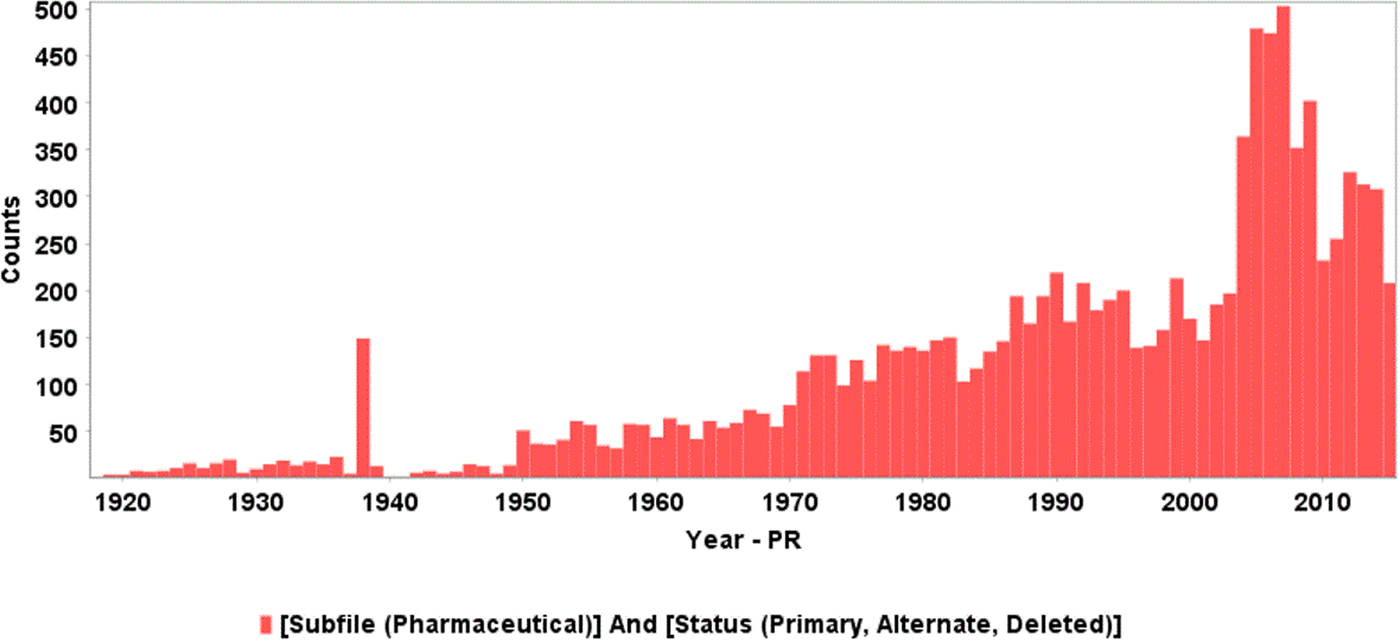
ICDD has always included pharmaceutical materials in its databases. However, in 2002, the ICDD launched the PDF-4/Organics and in the following years initiated several programs to improve pharmaceutical content. Since USP method <941> was issued in 1995, the pharmaceutical subfile has increased from 6714 material references to 11 816 material references with >2000 material references coming from ICDD grant and research programs (ICDD, 2018).
The ICDD has always had a strong collection of inorganic and polymeric excipients. However, as mentioned in Section 1.A, many excipients were non-crystalline or amorphous and digital pattern references, and total pattern analysis methods, were required to adequately describe these materials. Only recently have large collections of non-crystalline, polymeric, and nanomaterial references been included in the database as full experimental patterns, which are useful for pattern-fitting methods.
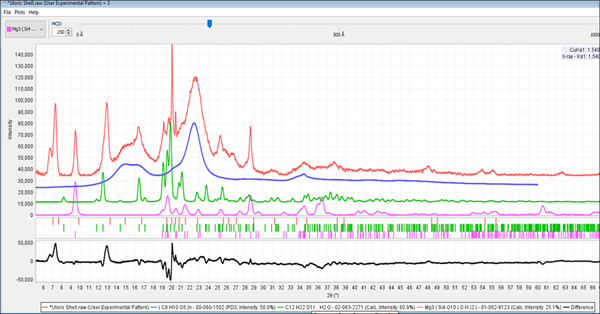
Another major development in the past 20 years has been the growth of publicly available patents on the Internet. While structure of matter patents usually contain poor quality reference data, the quality is often sufficient to enable identification. Claim language and descriptive information in the patent body can often be a source of reference information that can help identify the pharmaceutical (i.e. structure, composition, physical properties). This source of reference information is especially helpful in identifying newly patented drugs. In the case of the formulation of Uloric®, the active ingredient febuxostat is not published in the Powder Diffraction File™ (PDF®). The PDF® does contain Form V, and two solvated polymorphs, and Form G has been submitted for publication. However, a review of patent histories and published literature (Qiu et al., Reference Qiu, Li, Sheng and Zhu2015) indicates that febuxostat has at least 20 known polymorphs. In the powder diffraction analysis of Uloric®, we can identify talc, magnesium stearate, and α lactose monohydrate. There remains several unidentified peaks at low angles (Figure 14), and the stated concentration of febuxostat is 15 wt%. By doing a patent search using the keywords “febuxostat diffraction”, one finds European patent EP 1020454A1 (Hiramatsu et al., Reference Hiramatsu, Kitamura, Matsumoto and Watanabe1998), assigned to Teijin Pharmaceuticals, the manufacturer of Uloric®, and the unknown peaks correspond to the peaks described in claim 1 for Form I.
(color online) The diffraction pattern for Uloric® (red) with the references of the excipients, cellulose Iβ, α lactose monohydrate and talc shown in blue, green, and fushia, respectively. The difference plot at the bottom (black) clearly shows three diffraction peaks at low angles that are characteristic of febuxostat Form I (EP 1020454A1, Hiramatsu et al., Reference Hiramatsu, Kitamura, Matsumoto and Watanabe1998).
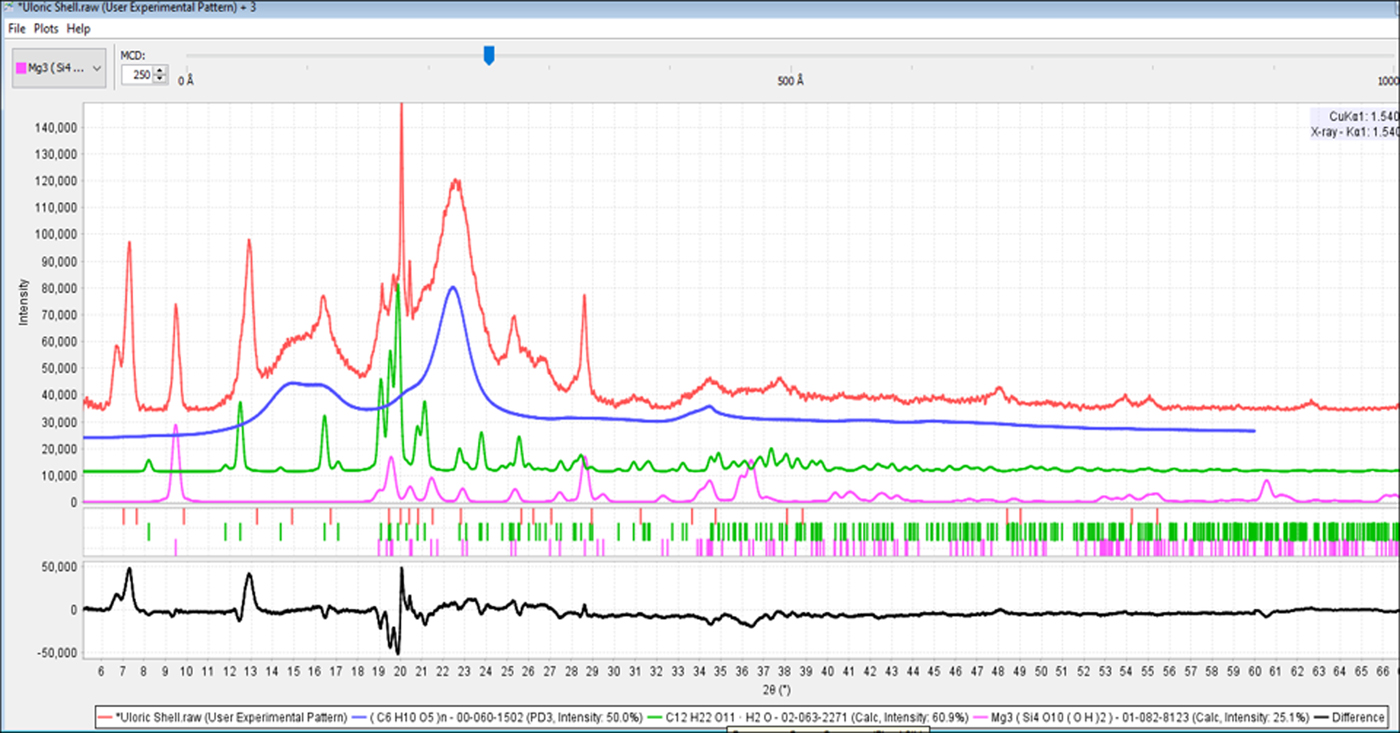
This is not the first time that the authors had tried this approach. Our previous formulation studies in 2005–06 and 2012–13 had limited success in identifying APIs from the patent literature. However, we now have the means to identify all types of excipients, which in turn, isolates the diffraction peaks that reasonably belong to the API. This combined with the increased amount of publicly available patent literature and targeted acquisition programs have resulted in very high success rates for commercial products. In the 2017–18 formulation study, we identified the API in 57 out of 60 formulations (Fawcett et al., Reference Fawcett, Gates-Rector, Gindhart, Rost, Kabekkodu, Blanton and Blanton2019). The APIs that were identified by specific patents were provided to the ICDD editorial staff, so that these patents can be extracted for their reference data.
E. The formation of solid solutions
On a practical basis, this problem has been greatly reduced by the global growth of reference materials and their diffraction data. The Powder Diffraction File™ is approaching 1 million reference data sets, a tenfold increase from 20 years ago. Many natural products biologically form various types of solid solutions, this includes many sugars, starches, and excipient minerals such as calcite, talc, kaolin, etc. Modern databases have multiple representatives in a solid solution series and data mining with structural classification software (Fawcett et al., Reference Fawcett, Kabekkodu, Blanton and Blanton2017). For example, searching the mineral class calcite in PDF-4+ 2018 will produce 124 known minerals with the calcite structure, exhibiting a wide variety of cationic dopants (Mg, Mn, Fe, Ba, Sr, Na, K). These tools make it easy to identify and find both individual members and series data. With modern analysis software, it is likely that the analyst can automatically identify a solid solution and even identify the specific dopants. If desired, a Rietveld refinement, using high-quality laboratory or synchrotron data, can be used to refine the specific atomic site occupancy after initial identification.
F. The presence of disordered structures that alter the unit cell
This problem was evident in the formulation analyses of Claritin®, Alavert®, and Prilosec OTC®, with the APIs of loratadine and omeprazole. The published structures of loratadine and omeprazole are disordered and diffraction patterns calculated from these disordered structures are similar but not exact matches to the powder patterns in the commercial formulated products. The difference is significant enough that automated phase identification software fails to identify the API. The API is usually in the list of candidate possibilities but not in the top 10 candidates, thus rarely identified. This is where a similarity index approach can be very useful, where one studies the entire diffraction profile and can determine how similar the matches are. In the case of omeprazole, the pattern in Prilosec OTC® appears to be very close to several disordered structures, so one can identify the appropriate family but not the specific disorder site occupancy. In the case of loratadine, a recently published high-quality powder pattern (Wu et al., Reference Wu, Li, Xu, Zhang, Wu and Li2014) precisely matches the observed diffraction pattern in both Claritin® and Alavert®, providing strong evidence that the calculated pattern is clearly in error. The high-quality reference means that the phases of these two non-sedative antihistamines are rapidly identified with routine analysis procedures. The PDF references are under review by ICDD editors to see if they can reconcile the published structural disorder with the new powder data.
The authors also have experience with disordered structures of cellulose in the analysis of Lignum Vitae a species of wood (Fawcett et al., Reference Fawcett, Crowder, Kabekkodu, Needham, Kaduk, Blanton, Petkov, Bucher and Shpanchenko2013). This wood is famous in ship building since it is extraordinarily hard and dense and a preferred wood for spars and wooden gears. The analysis shows that the cellulose polytype is a nanomaterial and that it is disordered; however, structural models of both disordered cellulose 1α and cellulose 1β can adequately describe the pattern. In this case, the peak broadening because of nanomorphology decreases the slight differences between the two models, which can happen in highly disordered materials.
In all three of these cases, higher quality data might resolve the discrepancies by enabling various structural models to be more exact. Use of a NIST-SRM positional standard, such as LaB6 or Si, could help distinguish between similar structures (i.e. omeprazole) by calibrating the d-spacings.
It should be mentioned that the ability of a database organization or an individual to calculate a pattern from a disordered structure depends on several factors, including the overall quality of the original experimental data and a complete description of all disordered positions and their fractional site occupancies within the structure. If these conditions are not met, as in the case of many published historical references (tens of thousands), the calculated pattern may not be suitable for phase identification. This highlights the importance of editorial quality review to determine whether a calculated pattern should be published, and a determination of pattern quality (i.e. quality marks, editorial comments) if the pattern is published. The ICDD quality mark reflects the quality of the original experimental data and completeness of the structure (Fawcett et al., Reference Fawcett, Kabekkodu, Blanton and Blanton2017).
G. The specimen has too many phases
The root cause of this problem is that too many phases usually result in severe peak overlap that causes peaks to merge and be located at positions that do not correspond to the references. Similar problems can occur with nanomaterial ingredients, where multiple peaks can converge because of crystallite size line broadening. For example, Centrum Performance® vitamins and Allegra® have multiple phases, non-crystalline components, as well as low symmetry phases. Theoretically, both formulations have hundreds of diffraction peaks in a typical 5–70° diffraction pattern. Some excipients also exhibit complex patterns, for example, β-D-Mannitol (PDF 02-069-8458), shown in Figure 4, has >130 diffraction peaks in the 5–70° 2θ analysis range.
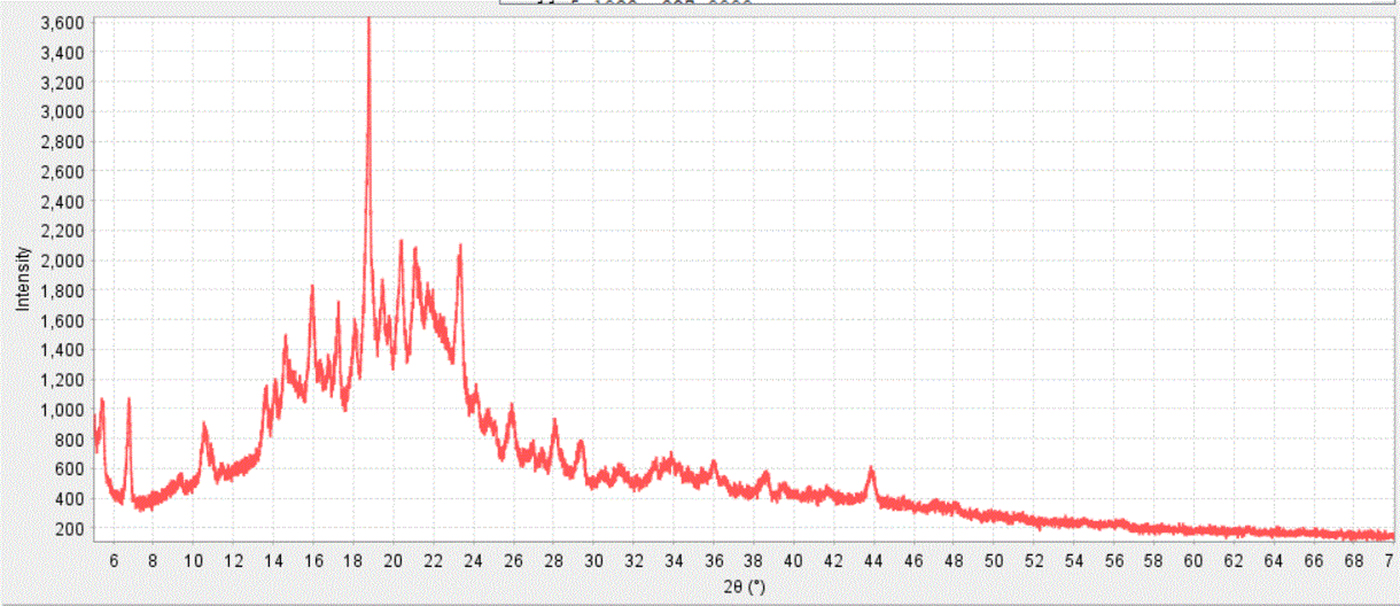
The practical considerations with complex patterns are that the merging peaks will cause lower scores in the search process and these need to be expected by the analyst. This is where digital patterns and/or similarity indexes help since you can visually compare candidates and potential fits to supplement the statistical data provided by the software. These problems are commonplace in pharmaceutical analyses where a range of materials with a range of structural order (crystallinity, crystallite size) are often present in a single formulation. Such is the case for Allegra®, a formulation that contains a nanomaterial microcrystalline cellulose, two amorphous materials, povidone and amorphous cellulose, and at least five crystalline phases in its formulation and resulting diffraction pattern. Because of the amorphous and nanomaterial content, the baseline is very difficult to determine, and because of the multiple crystalline phases, a very crowded area between 14 and 24° has over a dozen observed peaks that are actually a summation of peak profiles from hundreds of peak contributions.
The solution to these types of problems is to collect higher resolution data. This can be done by optimal control of slits (as shown in Figure 4) and monochromators, and if possible, increasing the focusing radius. This is where a desktop diffractometer is at a severe disadvantage (small radius) and a synchrotron can have a big advantage (large radius). Of course, using monochromators and small slits reduces the overall beam intensity. A complementary strategy is to collect data for extended times to optimize signal to noise. Even with a low-resolution system, extended data collection may provide statistically enhanced data that will allow the user to examine peak broadening, determine subtle peak shoulders, and enhance low-level signals above the noise. In some cases, a thin film preparation may also be appropriate since limiting depth penetration will also improve resolution but usually at the expense of intensity. It is important to remember that optimized optics usually reduce noise as well as signal so it is important to monitor signal to noise for optimum results.
One of the great ways to both increase resolution and get a stronger signal is to use a synchrotron (Figure 15, right figure). An alternative is to use a laboratory diffractometer equipped with an incident beam monochromator (such as Ge). There are both user facility agreements and commercial consulting services that can provide access to many of the world's synchrotron facilities. In the examples above, we have data on formulated products that contain α lactose monohydrate taken on a laboratory diffractometer (left) and at 11-BM on the Argonne Advanced Photon source (right). The data on the right are a perfect match to reference standards while the peaks on the left require significant software assistance (i.e. peak deconvolution) to resolve the components. Search/match figure of merit and goodness-of-match scores are appreciably higher when references are compared to well-resolved crystalline materials, such as the lactose monohydrate in Figure 15, shown on the right.
(color online) Comparison of α lactose monohydrate in several pharmaceutical formulations. The data on the left were collected with a benchtop diffractometer and the data on the right were collected at the Advanced Photon Source, line 11-BM, at the Argonne National Laboratory.
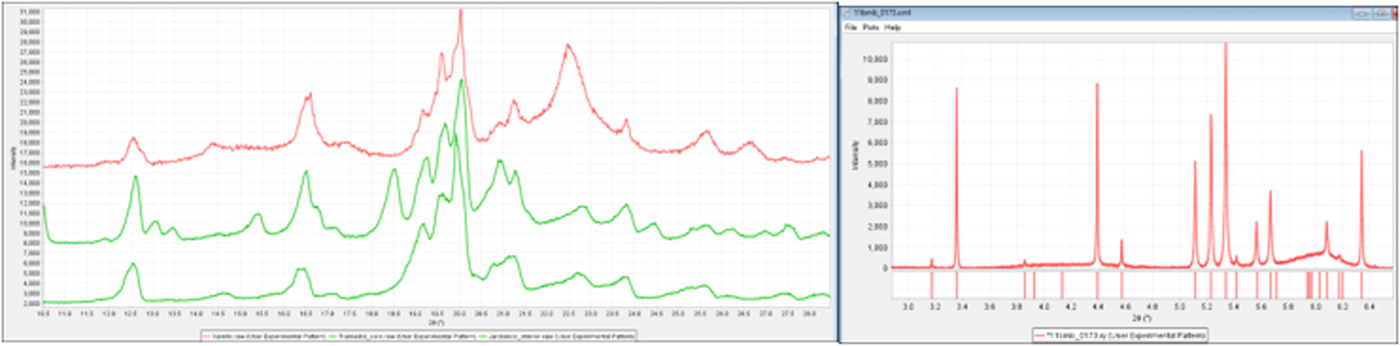
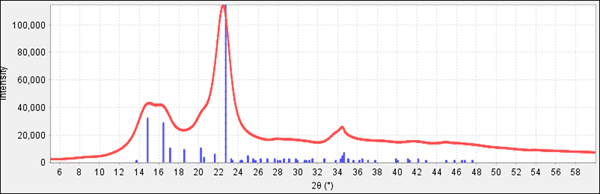
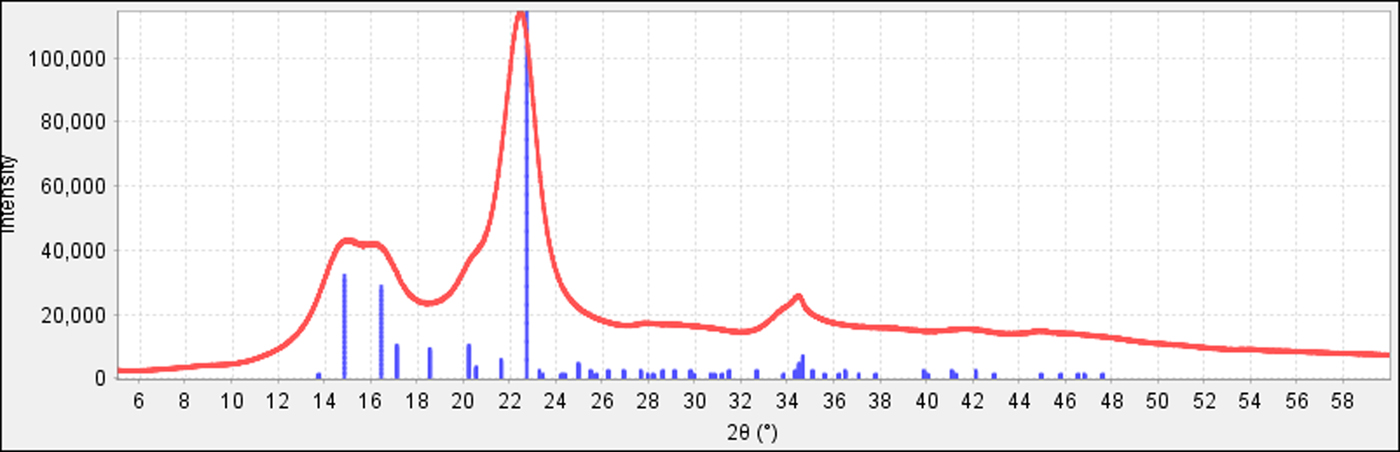
Microcrystalline cellulose, which has nanosize crystalline domains, is a perfect example of crystallite size broadening with a very common excipient. Since the broadening is because of the nanocrystalline domains within the material, these peaks will remain broad even in a high-resolution system. Microcrystalline cellulose is an excipient in both the top left and right data sets shown in Figure 15. Figures 8 and 14 also show the identification of microcrystalline cellulose in a formulated products, where an experimental reference pattern (PDF 00-062-1502) is used in the identification to match the crystallite size of the cellulose in the experiment. This can be compared to reference data calculated from the crystal structure (PDF 00-056-1718, Kaduk, Reference Kaduk2005) shown in Figure 16. Cellulose is biologically produced and always contains nanocrystallites with broadened peak profiles. Microcrystalline cellulose is one of the most common excipients used in pharmaceutical formulations where the “micro” refers to sizing of the fibers, not the experimentally determined nanocrystallite size. Microcrystalline cellulose is one of the ingredients of Allegra™ shown in Figure 17 and one has to account for this phase and its peak broadening to accurately determine the other ingredients.
(color online) In the above plot, the positions of the lattice planes from the indexed unit cell and structural determination are underneath the experiment data. One can see how dozens of peaks are not apparent in the experimental data and the largest peak is off-position because of merging with smaller peaks. These experimentally observed changes are also theoretically predictable with crystallite size models (Scardi et al., Reference Scardi, Leoni and Faber2006).
(color online) The raw diffraction pattern from an Allegra® formulated tablet. This particular formulation contains multiple crystalline phases, nanomaterial phases, and amorphous phases.
Another common strategy for complex materials is to physically separate the phases – by heat, humidity, dissolution, sieves, sonication, etc. In many cases, physical separation is easy to achieve with formulated tablets. The tablets are usually coated to control dissolution rate or facilitate manufacture. Light grinding in a mortar and pestle and then use of a sieve can usually separate out the powder core from the interior. In the case of Allegra® (Figure 1, left photo), the diffraction pattern for the pink outer coating contained the lubricant magnesium stearate dihydrate, anatase, and microcrystalline cellulose Iβ. The shell had less povidone, which helped distinguish the cellulose. The interior powder contained both povidone and cellulose with much higher concentrations of two polymorphs of D-mannitol and the API, fexofenadine hydrochloride. The separation and use of these patterns helped confirm the eight phases present in the formulation. Similar core/shell separations and multiphase analyses have been used in the analyses of Uloric®, Jardiance®, Namzaric®, and tramadol.
In situ heating experiments can be very useful because of the prevalence of low melting excipients and APIs. These experiments can cause separation by melting/cooling with melt and recrystallization processes. A variety of commercial high-temperature equipment is available and dual instruments such as TGA-XRD (Berzins et al., Reference Berzins, Actins and Skarbulis2010) and DSC-XRD (Fawcett et al., Reference Fawcett, Martin, Crowder, Kincaid, Strandjord and Blazy1986; Kishi and Toraya, Reference Kishi and Toraya2004) are also useful. A simple drying oven can phase change hydrates and often add enough energy to crystallize components, providing clues to formulation ingredients. The authors have used all these methods and found them to be effective in specific cases. It should be mentioned that controlled temperature and humidity studies are frequently used to determine shelf life in pharmaceutical formulations. The work of Berzins as well as Kishi and Toraya has demonstrated in situ powder diffraction studies of hydration and hydration/dehydration cycles for several pharmaceuticals.
H. The presence of lattice deformations
This problem is an opportunity and a strength of using powder diffraction methods. Lattice deformations, stresses, and strains can all be measured by using available standards and measurement techniques. Lattice deformations can be determined using calibrated data through the use of precision lattice constants calibrated with a NIST SRM reference positional standard. Stresses and strains can be determined using a variety of whole pattern and peak profile analysis methods (Scardi et al., Reference Scardi, Leoni and Faber2006; Ungar et al.,Reference Ungar, Leoni and Scardi1999)
Since USP method <941> was first published, the use of positional standards has become commonplace (Fawcett et al., Reference Fawcett, Kabekkodu, Faber and Needham2004; Kabekkodu and Fawcett, Reference Kabekkodu and Fawcett2013) and they are frequently used to determine high quality, precise, and accurate diffraction data. Such determination is used in thousands of temperature and pressure studies (ICDD, 2016). Similarly, in the last 20 years, stress and strain measurements have been calibrated and whole pattern methods automated. The widespread use of the Rietveld method (Rietveld, Reference Rietveld1969) and similar whole pattern fitting methods, and their incorporation into more than 20 automated analysis programs have made refinements of lattice constants, stress, strain, and crystallite size routine.
For material identification, the presence of lattice deformations, if severe, causes the crystalline peak positions to deviate from their references. These deviations can be measured and/or modeled to demonstrate that the “lattice deformation” is predictable from the reference. The majority of pharmaceutical formulations contain soft materials (organics and polymers), reactive and/or hydroscopic materials. This latter group of materials include most celluloses, sugars (lactose, mannitol), and other common excipients such as magnesium stearate dihydrate and brushite (calcium phosphate dihydrate). According to the International Pharmaceutical Excipients Council (IPEC, 2018), these excipients are among the most commonly used in the pharmaceutical industry. Pharmaceutical formulations are frequently encapsulated or coated and placed in blister packs, capsules, and other types of controlled atmosphere packaging, so that they have controlled shelf life. The analyst has to take care that the process of specimen preparation and analysis does not induce lattice deformations, for example, though partial dehydration or by mechanical grinding. Since deformations can also be caused by formulating, tableting, and encapsulation processes, analysts need to be careful that the deformations, stresses, and strains being measured are indicative of the manufacturing process and not their specimen preparation technique.
In order to minimize deformations while simultaneously helping particle statistics, low-impact grinding methods such as cryo-grinding and attrition milling have become common laboratory tools. There are several publications that have documented milling damage and phase changes to pharmaceutical materials (Takahashi et al., Reference Takahashi, Nakashima, Nakagawa and Sugimoto1984; Kitamura et al., Reference Kitamura, Miyamae, Koda and Morimoto1989).
I. The structural similarity of different phases
Rather than a detriment to phase identification, various regulatory bodies consider powder diffraction to be an authoritative analytical method in the analysis of structurally similar but different phases. In fact, powder diffraction data are heavily used in global patent and regulatory cases as proof of a structural basis of polymorphism for similar structures. The determination of small differences between structurally similar phases is closely related to the experimental accuracy and precision, which has been significantly advanced in the last 20 years.
There is a very large body of proof that demonstrates the capabilities of powder diffraction to identify structurally similar materials contained in the data content of the PDF-4 Organics 2019 database (ICDD, 2018). This database has >535 000 material references each having a characteristic powder diffraction pattern. There is a smaller subset of material references (>2000), that are pharmaceuticals, have powder patterns with star quality marks, and associated high-quality crystal structures. In these cases, one can examine structurally similar phases, with the exact same molecular connectivity and structural formula, and use the crystal structure determinations to exactly determine the nature of the difference. One such case example is lamotrigine that has 22 references, six have associated crystal structures, a base form and five solvates. The diffraction patterns are completely different because the incorporation of various solvates of different molecular volumes causes large changes to the unit cell and the resulting diffraction patterns. Even without the crystal structures, diffraction patterns, indexed unit cells, and molecular volumes are calculated for all 22 lamotrigine references providing a history of structural changes with hydration, salt formation, and solvation (ICDD, 2018).
There are many documented cases of various hydrogen-bonding motifs causing polymorphism in pharmaceutical hydrochloride salts. In the example of xylazine, the database has five references including three polymorphs (A, X, and Z) with structures of xylazine hydrochloride (Zvirgzdins et al., Reference Zvirgzdina, Mishnev and Actins2014). The hydrogen-bonding motifs are dramatically different in the solid state, producing easily identified distinctive powder patterns. A more difficult case is that of Amixin® with the active ingredient of tilorone hydrochloride. The crystal structures of Forms III, IV, and VI have various hydrogen-bonding motifs and the diffraction patterns of polymorphs III and IV are similar, but still easily identified by careful examination of the d-spacings, particularly at low angles. Terfenadine is an example where the polymorphs were initially found in mixtures, the powder patterns were used to isolate characteristic d-spacings for each polymorph, which were then used to optimize synthetic methods for producing the pure polymorphs. In this example, high-resolution Guinier methods were used to identify the small changes in structurally similar polymorphs (Fawcett et al., Reference Fawcett, Goralski and Ziettlow1988). The above cases are a small example of thousands of documented cases contained in the PDF-4+ and PDF-4/Organics databases (ICDD, 2018) for pharmaceuticals, organic, and inorganic compounds. The material references in these databases contain the powder patterns and citations to global publications.
As in the case of QPA, the authors do not report an absolute detection limit for determining structural changes, as limits change with better instrumentation. It is not uncommon for synchrotron diffraction data sets to have 6–8 orders of magnitude of intensity, enabling new discoveries where structural changes may be in the order of a small fractional atomic site occupancy and/or determination of vacancies and modulations. A recent example is the modulation of cimetidine polymorphs (Arakcheeva et al., Reference Arakcheeva, Pattison, Bauer-Brandl, Birkedal and Chapuis2013). In another example, xaliproden polymorphic forms I and III are extremely close in structural similarity (Chandrappa et al., Reference Chandrappa, Ochsenbein, Martineau, Bonin, Althoff, Engelke, Malandrini, Castro, El Hajii and Taulette2013) and the powder diffraction patterns are almost superimposable. A combination of synchrotron powder diffraction and solid-state NMR identified the polymorphism between xaliproden forms I and III to be a dynamic disorder that deals with the degree of freedom of a -CF3 group, higher in Form III than in Form I. This small difference does create variations in the high-resolution synchrotron patterns and unit-cell changes in all three axes in the order of a few hundredths of an Ångstrom. The high resolution of the synchrotron data sets and wide range in intensity of xaliproden data sets were a key to analyzing small structural differences. The experimental data sets are shown in the PD3 patterns PDF 00-066-1011 and PDF 00-066-1015 (ICDD, 2018).
2. Accuracy and precision
In USP method <941>, section on qualitative phase identification, it is stated that “The agreement in the 2θ-diffraction angles between specimen and reference is within 0.2° for the same crystal form”. This agreement limit is generally repeated throughout the method, and is generally accepted in international patent literature. Since no reference is provided for this statement, we can only speculate how this error range was derived. A round robin study (Schreiner and Fawcett, Reference Schreiner and Fawcett1984) on systematic errors in routine powder diffraction raw data found that errors in δ 2θ (specimen and reference) of 0.08° 2θ were not uncommon when standards were not used and this would certainly put 0.2° 2θ within a 3σ range of probability. As shown by Jenkins and Snyder, these errors arise from a variety of known instrumental and specimen problems and are NOT an inherent property of the material (Klug and Alexander, Reference Klug and Alexander1974; Jenkins and Snyder, Reference Jenkins and Snyder1996). These same references also state that displacement and transparency are the main sources of peak position errors and the 0.2° tolerance is easily achieved in uncalibrated experiments. The 1984 round robin analyzed β-spodumene and lead stearate because the reference patterns covered a wide angular range, similar to many pharmaceuticals. However, this same reference demonstrated that the use of calibration standards greatly reduced these errors to a much smaller range 0.01–0.04° 2θ. However, it should be noted that this work occurred before the common adoption of positional standards, NIST standard reference materials Si and LaB6. Improved results in later round robins using calibrated data were obtained by other researchers (Wong-Ng and Hubbard, Reference Wong-Ng and Hubbard1987; Masciocchi and Artioli, Reference Masciocchi and Artioli1996) using both internal and external standard calibration procedures. Systematic studies on the use of NIST calibration standards in powder diffraction data (Wong-Ng and Hubbard, Reference Wong-Ng and Hubbard1987; Fawcett et al., Reference Fawcett, Kabekkodu, Faber and Needham2004; Kabekkodu and Fawcett, Reference Kabekkodu and Fawcett2013) demonstrate not only the widespread use of calibration standards, but their use in obtaining both precise and accurate results. These data suggest that the 0.2° 2θ agreement between reference and standard may be appropriate in uncalibrated experiments but is unacceptable for calibrated data. For example, for several decades, ICDD editors have used an average absolute δ 2θ value of 0.03° for a pattern to be defined as star quality. For α lactose monohydrate, a common excipient, the longest seven d-spacings for the three independent star quality references agree to an average δ 2θ of 0.024°. In the first case, we are talking about errors in 2θ based on the unit cell and experimentally determined d-spacings in a single determination, in the second case this was the error among seven reflections of three independent determinations.
The accuracy and precision of d-spacing data is very important for several practical reasons. First, in phase identification, positive phase identification can occur with fewer peaks if those peaks are known more accurately, enhancing minor and trace phase identification. Second, for polymorphs identification, a tighter range of 2θ increases the ability to distinguish between similar structures. Third, accuracy and precision in d-spacings results in an enhanced ability to detect solid solutions, strain, and other structure-related effects such as disorder and modulation. Therefore, it is critically important to separate out instrumental and specimen preparation errors from those variations that are caused by the structure of the material. Since USP method <941> was introduced, there have been several developments including commonly available reference standards, automated software for analyzing common errors (specimen displacement, transparency), and improved optics and detectors that greatly reduce many types of instrumental errors. These developments make it easier for users to identify and correct for various known errors in routine analyses and to calibrate the data so that the user can more closely examine small changes because of the material structure. Fundamentally, these changes make the 0.2° δ 2θ acceptance window archaic.
The influence on phase identification can easily be observed using descriptive statistics obtainable with the PDF-4/Organics 2018 database and phase identification software SIeve+. The user is able to vary the acceptance window that compares the 2θ values between experimental and reference. This can be studied both with and without prior calibration. As expected, the wider the “match” window, the more candidate phases and with a narrow window more selectivity is obtained. In this software, one can explore the number of peaks needed to obtain a match by varying the goodness-of-match parameter and it can be shown that fewer peaks are required for a unique result with narrower search windows (δ 2θ). The goodness of match is a calculated figure of merit based on the number of peaks identified within a defined search window and how close in position each experimental peak is to the reference value. (ICDD, 2014a, 2014b)
Unfortunately, simply tightening the acceptance window can have some practical problems. While calibrated data are more common, statistics on annual literature reviews by the ICDD still show a number of modern pharmaceutical patterns with low-quality marks, often because of a lack of calibration methods cited in the original publication. This is especially severe with APIs where reference data often come from patents that lack stated calibration methods and experimental details. Decades of accepting poor quality data by regulatory agencies has resulted in an overall lower reference quality for pharmaceuticals than most other areas of material science. Since the reference data itself can be of poor quality, a phase identification may be missed if a tight acceptance window is applied. Such is the case of polymorph I of Ticagrelor in the pharmaceutical Brilinta™. Calibrating the experimental data with either brushite or α lactose monohydrate, the two major excipients strongly suggests that the Ticagrelor reference pattern has an excessive (~0.2° 2θ) specimen displacement error. We recommend that users start with a moderate acceptance window if they are using a calibrated instrument (i.e. 0.15° 2θ) and then expand the window if logical candidates are not provided by the search/match software. In this particular case, the low-quality reference of Ticagrelor is the only polymorph I reference available and the identification would be missed by many users if they did not expand the match window. Incidentally, application of a displacement error provides an excellent goodness of match to the API Ticagrelor, another strong indication that the error is a known instrumental error and not a material aberration. A similar process was used in analyzing febuxostat in Uloric™ tablets. However, in this case using the talc excipient as a calibrant demonstrated that the experimental data had a displacement error, and calibrating the data resulted in a great fit for the low-angle peaks shown in Figure 14, with claim 1 of febuxostat Form I (Hiramatsu et al., Reference Hiramatsu, Kitamura, Matsumoto and Watanabe1998).
Overall, the above discussion points out the value of a quality review system that evaluates reference quality. In the cases of minor and trace phase identification, when using a limited number of diffraction peaks, the user wants to narrow the search range and use the highest quality mark reference standards in the analysis. In the example of Ticagrelor™, the “B” quality mark on this reference tells the analyst that the reference itself may be in error, which justifies the use of a displacement correction to positively identify the phase.
3. Pair distribution analysis, neutron diffraction, and electron diffraction
As shown in the previous sections, a strength of conventional powder diffraction is the ability to analyze complex multi-phase formulations. The methods described here each have unique attributes applicable to pharmaceutical analyses.
When USP method <941> was first established, automated software for pair distribution function analyses was in an early stage of development (Egami and Billinge, Reference Egami and Billinge2012). Pair distribution analysis software programs developed by the research groups of Egami, Petkov, Proffen, and Billinge have been broadly distributed and incorporated into data analysis packages (Beckers et al., Reference Beckers, Gteshki and Adibhatla2017; Drathen et al., Reference Drathen, Kern and Evans2017). The applications of this method to pharmaceutical materials have been clearly demonstrated by Petkov (Petkov et al., Reference Petkov, Ren, Kabekkodu and Murphy2013) and Billinge (Billinge, Reference Billinge2011). In the cases of nanomaterials and amorphous materials, pair distribution function analyses can provide structural information (i.e. bond types and distances) on very small domain sizes, independent of crystallinity. While pair distribution analyses have been known for decades, the previously mentioned advances in X-ray sources, automation, and detectors have made high-throughput pair distribution analyses possible with laboratory and synchrotron equipment. This technique has been growing in importance since it allows users to explore interfaces and relationships between crystalline, nanocrystalline, and amorphous domains.
The large scattering length of hydrogen, deuterium, and other pharmaceutical-relevant atoms makes neutron diffraction the method of choice for several types of pharmaceutical analysis (Shankland et al., Reference Shankland, Broder, Ibberson and David2006), especially those where the user wants to explore hydrogen-bonding motifs and networks (Cherneyshev et al., Reference Chernyshev, Yatsenko, Fitch, Sonneveld, Makarov and Shenk2000). The development of public user facilities at many of the world's neutron sources has expanded the use and applications of neutron diffraction to pharmaceutical analyses and provides facilities that can perform combined XRD-neutron studies. The Powder Diffraction File™ has also been expanded to include both constant wavelength (Faber et al., Reference Faber, Crowder, Blanton, Kabekkodu, Blanton, Fawcett and Gourdon2014) and time-of-flight neutron diffraction (Faber et al., Reference Faber, Kabekkodu, Blanton, Blanton and Fawcett2017) experimental and calculated patterns. This enables the search, match, and identification of complex multiphase pharmaceuticals using measured data sets from constant wavelength and time-of-flight neutron diffractometers.
Precession electron diffraction techniques have been recently refined to study individual single crystals within a complex matrix. As shown by Veron et al. (Reference Veron, Rauch, Nicolopoulos, Ling and Otero2011), one can explore nanosized crystals in a complex matrix and determine texture, and in some cases, individual crystal structures (Van Gendersen et al., Reference Van Gendersen, Clabbers, Das, Stewart, Nederlof, Barentsen, Portillo, Pannu, Nicopoulos, Gruene and Abrahams2016). An overview of determining crystal structures of organic molecules is given by Shankland (Kolb et al., Reference Kolb, Shankland, Meshi, Avilov, David and Shankland2012) in the book, “Uniting Electron Crystallography and Powder Diffraction”. The development of precession techniques with an overview of pharmaceutical API analyses using this method has been described by Das [Das, Reference Das2015 (PPXRD-13) and Reference Das2017 (PPXRD-15)]. There is some fascinating work exploring the amorphous–crystalline nanomaterial boundary with very small (nm) focal spots using combined electron diffraction and pair distribution function analyses. The Powder Diffraction File™ has been adapted to perform ring pattern, SAED (spot pattern), and ESBD (Kikuchi pattern) electron diffraction analyses (Reid et al., Reference Reid, Crane, Blanton, Crowder, Kabekkodu and Fawcett2011).
4. Additional considerations
During the preparation and review of this manuscript, another pharmaceutical review on powder diffraction was published (Thakral et al., Reference Thakral, Zanon, Kelly and Thakral2018). The authors of this review describe several of the advances in instrumentation mentioned in this report, in significant detail, with excellent cross references. They also discuss some emerging techniques, not described here, such as computed tomography and energy-dispersive diffraction. Overall in this review we have attempted to provide a practical user guide to pharmaceutical analyses, which is complementary to many of the methods described by Thakral et al.
Volume H of the International Tables for Crystallography has recently been published and the chapters on specimen preparation (Whitfield et al., Reference Whitfield, Huq, Kaduk, Gilmore, Kaduk and Schenk2019), crystallographic databases (Kaduk, Reference Kaduk2019), and QPA (Madsen et al., Reference Madsen, Scarlett, Kleeberg, Knorr, Gilmore, Kaduk and Schenk2019) are all relevant to pharmaceutical analyses. The references cited, and examples given, in this guide often connect the theory described in Volume H to specific application in pharmaceutical analysis. Of particular note is the description and use of whole pattern fitting methods to analyze amorphous and nanocrystalline materials, which are commonplace in pharmaceutical formulations.
PowerPoint presentations have been published on the ICDD website that demonstrate the steps used in pharmaceutical formulation analyses. This includes a tutorial, “How to Analyze Drugs” (http://www.icdd.com//wp-content/uploads/2018/04/How-to-Analyze-Drugs.pdf), as well as the presentations, “Analyzing amorphous and nanocrystalline materials by full pattern analysis” and “The analysis of noncrystalline materials in pharmaceutical formulations” (Fawcett et al., Reference Fawcett, Kabekkodu, Zhong, Gindhart, Blanton and Blanton2015, Reference Fawcett, Kabekkodu, Gates-Rector, Gindhart, Blanton and Blanton2016). These presentations detail the analyses of Allegra®, Allavert®, benedryl, Centrum® Performance, Promethazine®, Donnatal®, Flonase®, ramipril, and Singular®.
IV. CONCLUSIONS
Advances in instrumentation, software applications, and database content have all contributed to improved pharmaceutical analyses by the powder diffraction methods in the 21st century. These developments have converted many documented and well-established problems in past pharmaceutical analysis, to strengths of the modern powder diffraction analysis technique.
The common use of efficient position-sensitive detectors has increased the analysis speed by 100–1000×, results in faster response in in situ measurements and overall lower detection limits because of signal-to-noise improvements, independent of the source (benchtops to synchrotrons). The development of numerous automated total pattern fitting methods, and their rapid adoption in global software systems, has significantly improved the ability to identify, quantify materials, and measure crystallite size, stress, and strain. The inclusion of characteristic, non-crystalline, nanocrystalline, and amorphous references in global databases means that all solid-state pharmaceutical materials can be analyzed by their diffraction pattern, independent of whether the pattern is characterized by coherent or incoherent scattering.
ACKNOWLEDGEMENTS
The authors would like to thank Nicholas A. Giuliani and Main Line Healthcare Primary Care, Concordville, PA, USA, for providing many of the tablets and capsules used in this study. The authors would like to acknowledge the support of Rikagu, Bruker-AXS, Proto and PANalytical in providing access to laboratory and benchtop diffractometers, and to Argonne National Laboratories for laboratory access to the synchrotron light source. Jim Kaduk, Cam Hubbard, Silvina Pagola, Mathew Suchomel, Cyrus Crowder, and Fangling Needham each contributed their expertise in preparing specimens and collecting data on one or more formulations. The authors would also like to thank Simon Bates, Ann Newman, Robert Dinnebier, Arnt Kern, Raj Suryanarayanan, Shawn Yin, Detlief Beckers, and Fabia Gozzo, expert instructors for pharmaceutical workshops at PPXRD, for their helpful instruction, advice, and discussions on pharmaceutical analysis. Use of the Advanced Photon Source at Argonne National Laboratory was supported by the US Department of Energy, Office of Science, Office of Basic Energy Sciences, under Contract No. DE-AC02-06CH1135.