

I. INTRODUCTION
The ubiquitous freely available DICVOL indexing software is now about 50 years old. Developed in an academic context over several years (Louër and Louër, Reference Louër and Louër1972; Boultif and Louër, Reference Boultif and Louër1991, Reference Boultif and Louër2004; Louër and Boultif, Reference Louër and Boultif2014), some of its previous versions (up to DICVOL06) can be found incorporated in several software packages involving a graphical user interface (GUI). Among them: FOX (Favre-Nicolin and Černý, Reference Favre-Nicolin and Černý2002), EXPO (Altomare et al., Reference Altomare, Cuocci, Giacovazzo, Moliterni, Rizzi, Corriero and Falcicchio2013), WinPLOTR (Roisnel and Rodriguez-Carvajal, Reference Roisnel and Rodriguez-Carvajal2001), DASH (David et al., Reference David, Shankland, van de Streek, Pidcock, Motherwell and Cole2006), and MATCH! (Putz and Brandenburg, Reference Putz and Brandenburg2018). With the field of indexing diffraction powder data still exploring new approaches today (Coelho, Reference Coelho2017), we decided to develop our own GUI as a free service to the X-ray and Neutron Powder Diffraction community. Strictly dedicated to running DICVOL14 and entirely compliant with the file system of the latter, it is compact, intuitive, easy-to-use, and user-friendly.
Attempts at successful indexing of powder diffraction patterns without conscience are doomed to failure. The reader is referred to a classic review (Langford and Louër, Reference Langford and Louër1996) for general considerations about the essentials of powder diffraction, to NBS/NIST Conference papers (Shirley, Reference Shirley1980; Louër, Reference Louër1992) for a discussion about the required quality of the X-ray diffraction data, and lastly to the paper discussing DICVOL14 (Louër and Boultif, Reference Louër and Boultif2014) new features, as well as to the latest version (v2.17) of the DICVOL14 user manual and software.
We conclude this paper by briefly discussing three examples, with a single goal in sight, namely to emphasize PreDICT various functionalities, rather than to advocate the quality of the X-ray diffraction data to be successfully used with PreDICT/DICVOL14. We refer the reader to previously published work regarding various aspects of DICVOL14 handling of triclinic cases, including difficult ones involving a longer axis or a dominant zone (Louër and Boultif, Reference Louër and Boultif2014, Section B and Table I, p. S10).
II. PreDICT FEATURES
The software is written in Java (required version: Java Runtime Environment [JRE] 8 or higher). It runs on Windows PC's (XP or later).
Amongst PreDICT most salient characteristics:
1. Input file formats (ASCII only): Powder “.CIF”, “.XY”, “.XYE”, “.UXD”, and “.GSA”. For all the other ASCII or binary input formats, please first use the freely available PowDLL software (Kourkoumelis, Reference Kourkoumelis2013) for preliminary conversion to one of the above.
2. Wavelength(s) [in Å]: Monochromatic or (Kα 1, Kα 2) pair.
3. Background automatic retrieval, using an algorithm published by Sonnefeld and Visser (Reference Sonnefeld and Visser1975).
4. Smoothing, using a Savitzky–Golay filter (Savitzky and Golay, Reference Savitzky and Golay1964).
5. Kα 2 stripping, using the widespread Rachinger method (Rachinger, Reference Rachinger1948).
6. Automatic peak selection. Once this step has been carried out, the user retains the flexibility to manually dispose of dubious or select additional peaks. PreDICT automatically keeps track of the latest peak selection for a given histogram and restores the peak file when the same diffractogram is used again. The latter information is saved in “.XML” format in the following directory and file: C:\Users\xxxx\AppData\Roaming\ICDD\PreDICT\preferences.xml, where xxxx features the User's name, pseudo or alias. The 3-4-5-6 data processing selections can be saved as well in this preferences.xml file and restored at any time.
7. Output file formats (ASCII only): Equistepped interpolated “.XY” and “.GSA” for both the raw and processed 1D datafiles. The “.GSA” format, which requires equistepped data, is included to facilitate subsequent Le Bail (Le Bail, Reference Le Bail2005) and Rietveld (Rietveld, Reference Rietveld1969) refinements using the freely available GSAS software (Larson and Von Dreele, Reference Larson and Von Dreele2004).
8. Graphics Hardcopy output at any stage during the data processing, in both the “.PNG” and “.JPG” formats.
III. OPTIMAL USE OF THE SOFTWARE
The indexing of powder diffraction patterns is a demanding application of the powder diffraction method. The first and mandatory requirement is to not compromise with the quality of the input raw 1D powder diffraction data. Synchrotron and/or laboratory monochromatic X-ray sources should be used whenever available. The 2θ-stepsize should ideally not be larger than 0.01°/0.02° according to the FWHM of the diffraction lines and the wavelength used. High-quality counting statistics is also required (e.g., for laboratory data collection with scintillation detectors, suitable measurements can be performed overnight over an angular range appropriate for indexing purposes). The remaining recommendations, briefly reported below, are described in detail in the previously mentioned papers discussing the various iterations of the DICVOL software:
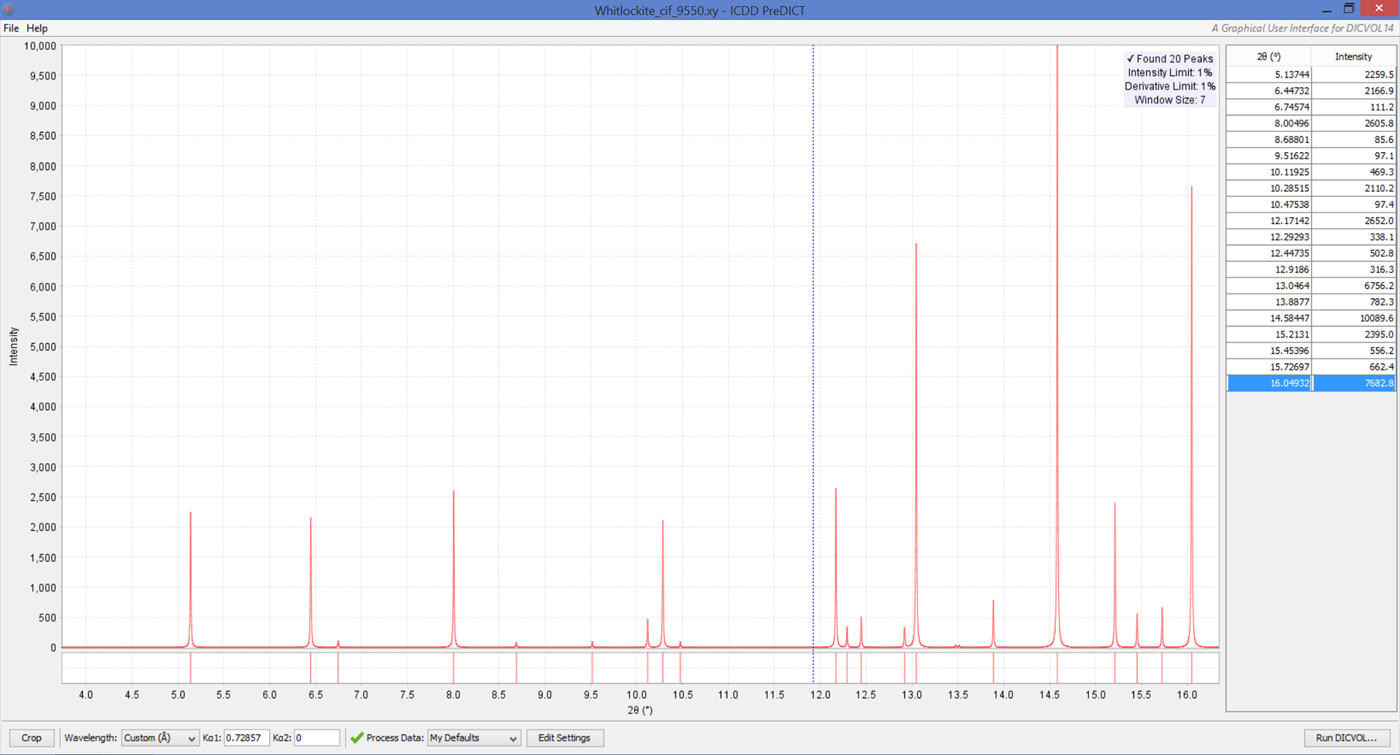
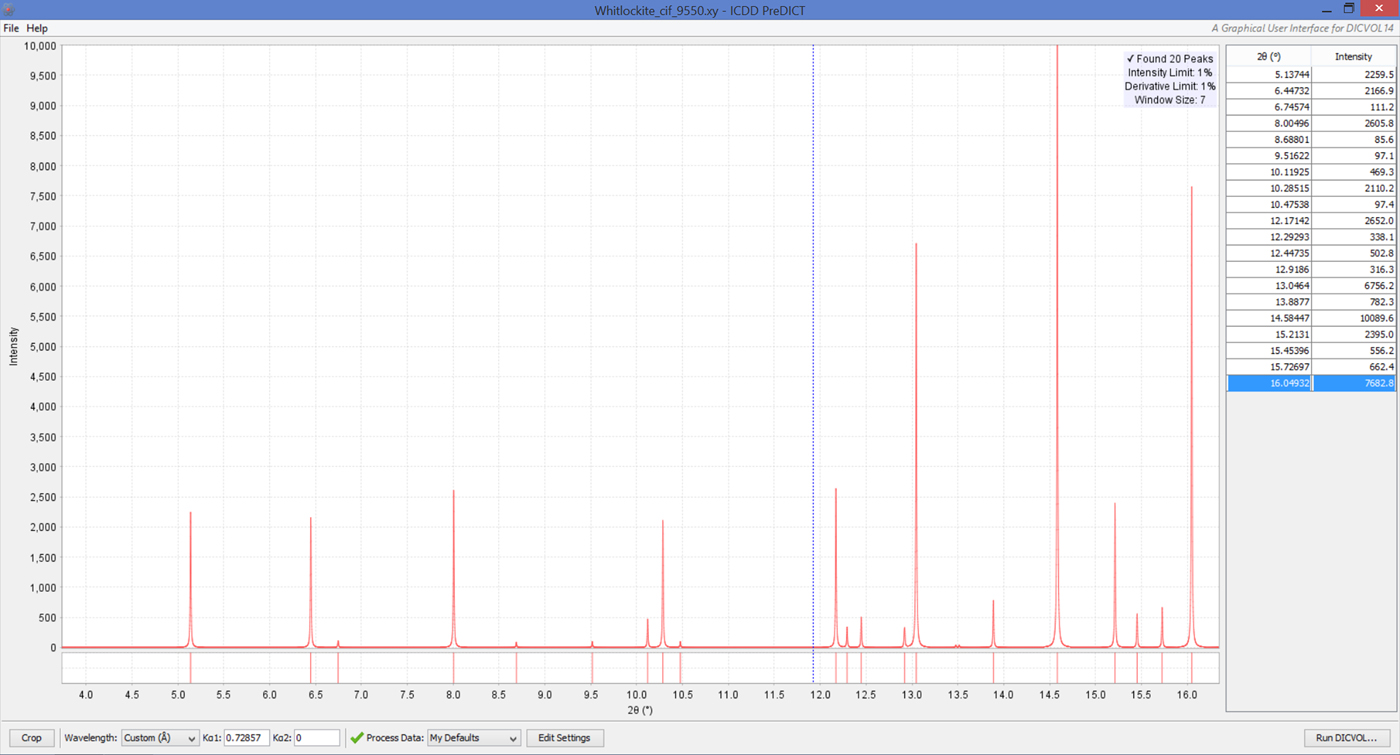
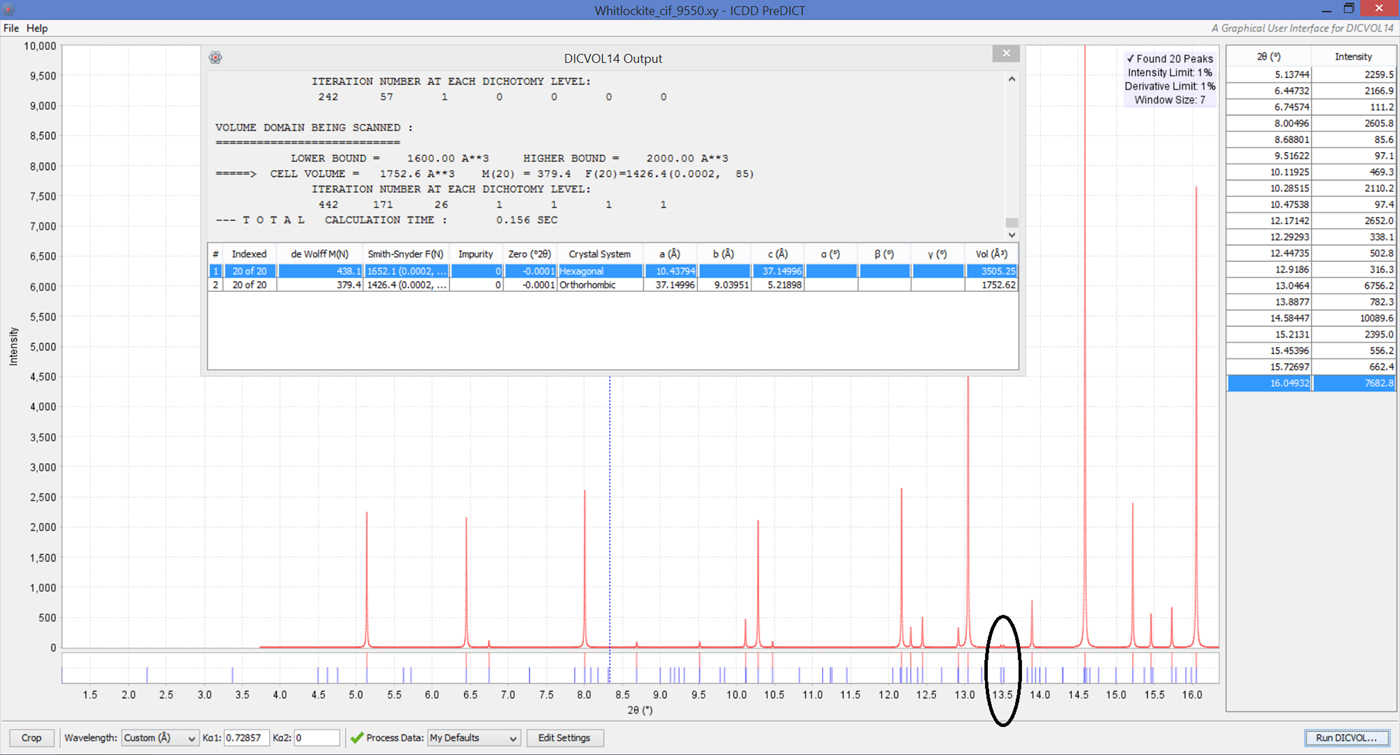
(1) The precise positions of the (N Total) Bragg reflections extracted in the low angle region with PreDICT can be input in the program (e.g., 40). Among them, only the first N lines at low 2θ angles (corresponding to the region where the overlap of reflections is minimal) are used for searching unit cells. For most cases involving materials featuring a moderate unit cell volume, N = 20 to 25 is generally selected (as shown for instance on Figure 1). Note that in the case of a large or short cell parameter (dominant zone), N often needs to be appreciably >20.
Figure 1.(Colour online) PreDICT window display after the selection of 20 Bragg peaks to be used for indexing. The simulated monochromatic (λ = 0.72857 Å) X-ray diffraction powder dataset for Manganese-Whitlockite was calculated from a single-crystal CIF (#9550) obtained from the American Mineralogist Crystal Structure Database accessed through the MINDAT.org website and computed by making use of the free CCDC/MERCURY software.

(2) The absolute error Δ(2θ) must be selected according to (i) the resolution (FWHM of the diffraction line profile) and (ii) the wavelength used for collecting the powder data. For instance, in the case of laboratory data collected with CuKα 1, |Δ(2θ)| is usually taken as 0.03° (2θ), which is the default value in DICVOL14, except for the triclinic search when it is carried out on its own [0.025° (2θ)]. [See § III.A and III.B.ii in Louër and Boultif (Reference Louër and Boultif2014).] This error interval is of prime importance in the dichotomy algorithm. Sometimes it must be reduced, for instance in the case of high resolution and precise patterns, large cell volumes, and even for laboratory triclinic diffraction data in some cases (e.g., involving partial geometric ambiguities).
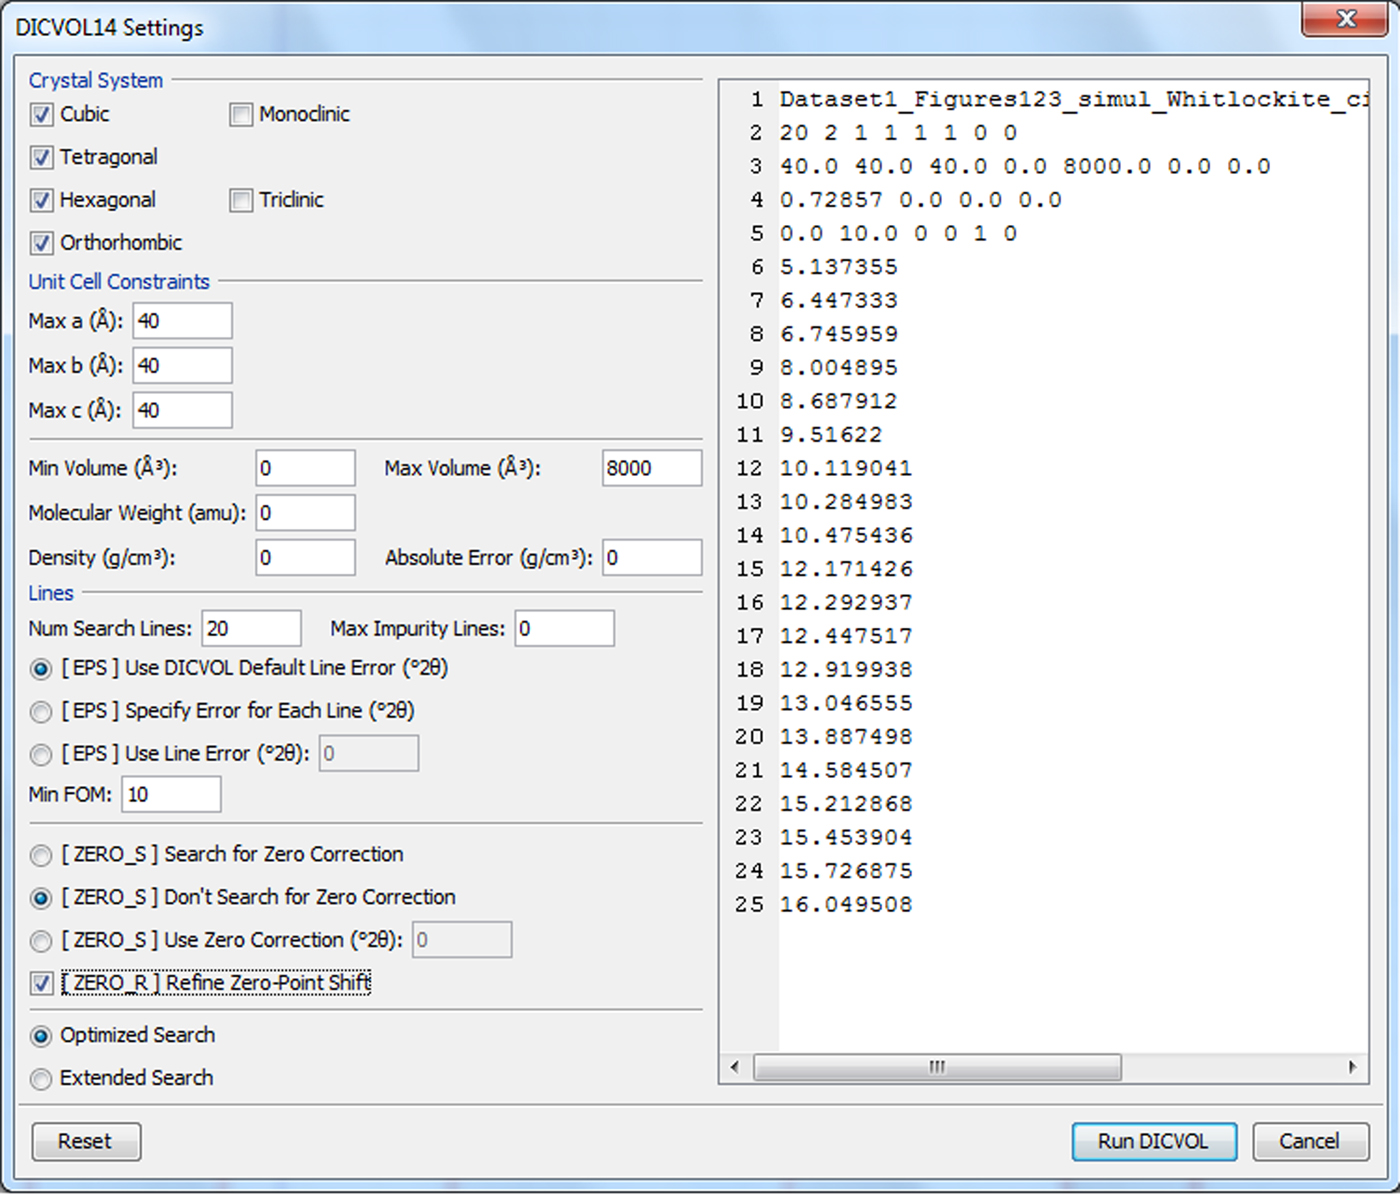
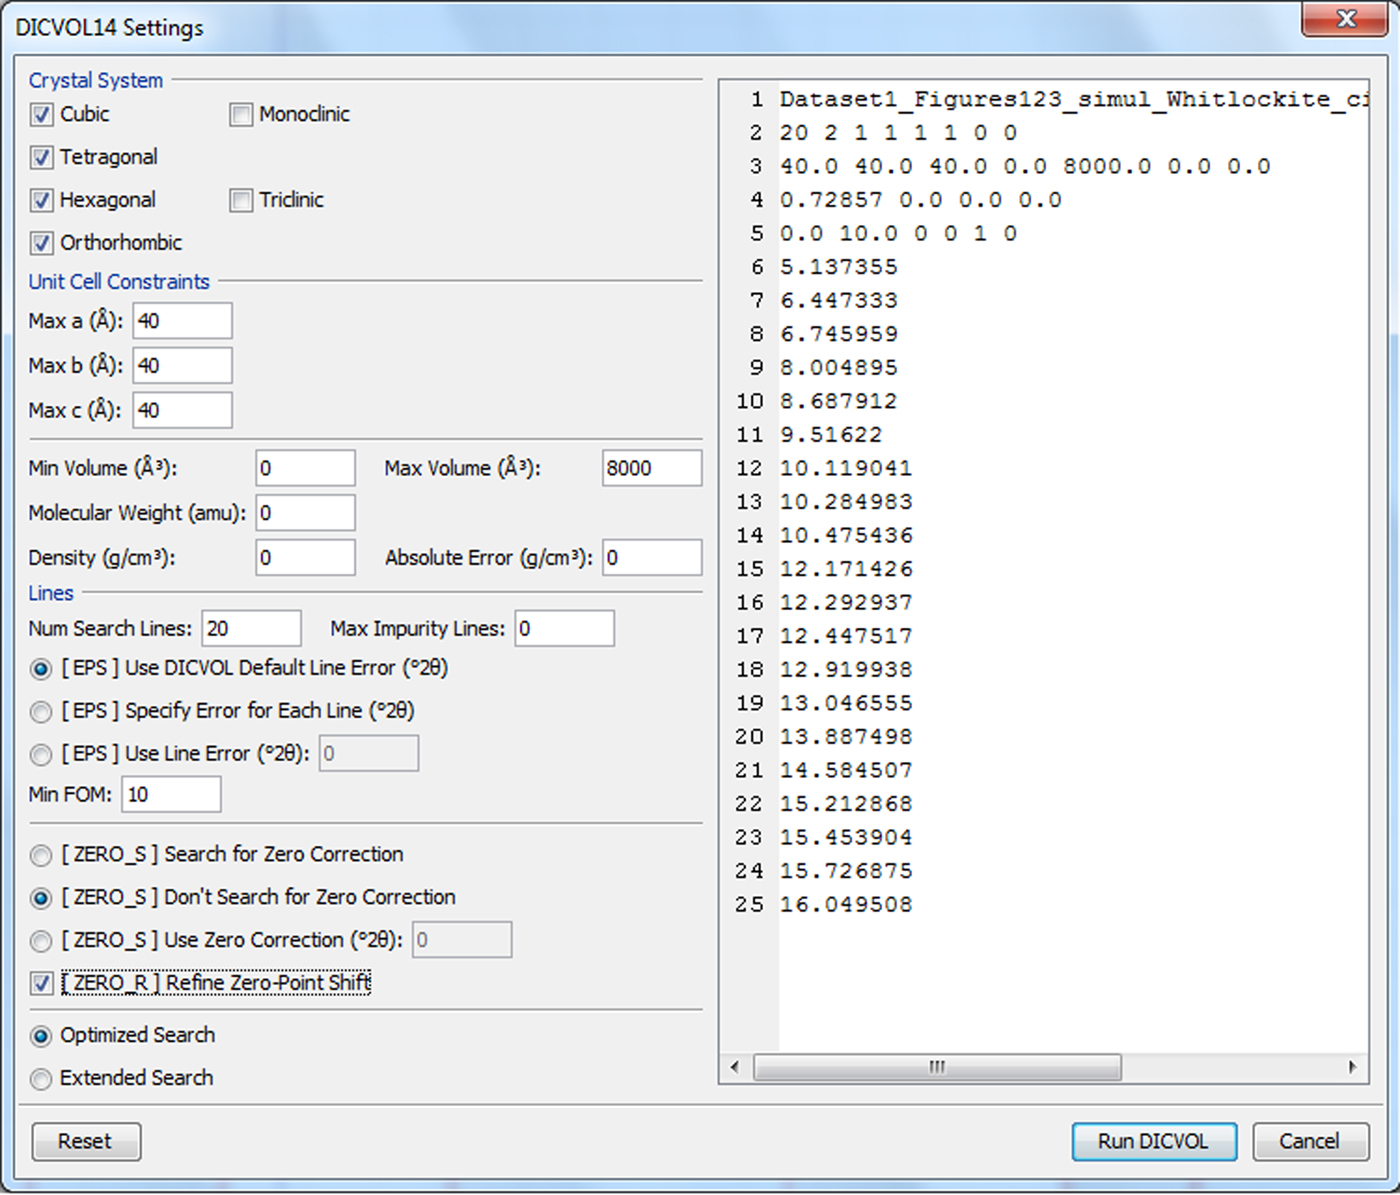
(3) High lattice symmetry solutions should be searched first. As suggested by the DICVOL14 input panel displayed in Figure 2, the following trial sequence is advocated: (i) cubic–tetragonal–hexagonal–orthorhombic, (ii) monoclinic, (iii) triclinic. [Sequences (i) and (ii) can also be joined together.]
Figure 2.(Colour online) The dual window panel used to create the pristine DICVOL14 input file. The user feeds in information on the left. The DICVOL14 input file appears on the right and is updated on the fly. In the latter, a default value appear as 0 (if integer) or 0.0 (if real). Note, in particular, the non-default selections: (i) the unit cell constraints (maximum allowed a = b = c = 40 Å > 25 Å), (ii) the maximum allowed volume (8000 Å3), and (iii) the marked (ZERO_R) option. Finally, note the request for an Optimized Search.
(4) Because the search for a triclinic solution is carried out in reciprocal Q-space, as opposed to the other lattice symmetry searches (which are thus carried out in direct R-space), and uses triclinic lattice-dependent estimated cell volume to define a volume range, the search should preferably be carried out independently on its own.
(5) Although ideally powder data for a single phase should preferably be used, a tolerance for spurious lines is accepted in DICVOL14. It is a user's decision to introduce a maximum number “Imp” of accepted spurious lines in the subset of N lines used for searching solutions. This must be pondered carefully, since additional variables are then introduced in the mathematical problem. Two options are proposed, respectively, involving a positive number “Imp” and a negative number “−Imp”, both associated with the allowed maximum number of impurities. In the second case (“−Imp”), the number of impurities is sequentially incremented from 0 to Imp and DICVOL14 stops the scanning for that value of the increment for which a solution is found (see example reported in Section V). This latter option is more efficient than the former (“Imp”), albeit more time-consuming.
(6) As noticed in previous papers, a correct cubic unit cell may not feature the highest figures of merit (FOMs): M(N) (de Wolff, Reference De Wolff1968) and F(N) (Smith and Snyder,Reference Smith and Snyder1979).
(7) At the end of a DICVOL14 run, a pop-up window will open in the PreDICT screen, listing the found unit cells with minimal information (lattice parameters including the corresponding volume of the unit cell and zero 2θ offset) and the classical FOMs, as displayed in Figure 3. This is only one part of the DICVOL14 output. The user is urged to read through the complete original ASCII files generated by DICVOL14 for more information, which are automatically created in the PC working directory that also contains the input 1D powder diffraction data. Firstly, the file PreDICT_OUTPUT.txt sequentially lists each found solution followed by the displayed analysis of the N Total input lines from the cell parameters suggested by the N line subset. It is the user's choice to decide whether to reject a solution involving unindexed lines or to explain the latter. Secondly, the PreDICT_OUTPUT.ORD file gives a detailed evaluation for the five solutions ranked from best to worst achieving the highest de Wolff FOMs. It emphasizes (i) the quality/deficiency of each fitted reflection (in poor indexing cases, a single selected line may be ascribed to more than one Miller index triplet or to none), and (ii) the proposed centering of the found lattices. Both these files should be consulted to check if the suggested unit cells, found from the first N lines, satisfactorily index the N Total input lines.
Figure 3.(Colour online) After a successful DICVOL14 run : (i) a list of suggested unit cells is displayed with minimal information. (ii) Once a specific solution is selected (highlighted), all the related calculated Bragg peak positions are graphically displayed (blue marks) below the peaks used for the indexing. In good cases such as the one shown in the figure, Bragg peaks not selected for indexing will now become accounted for (black oval).
IV. A TYPICAL EXAMPLE INVOLVING A 1D SIMULATED DATASET
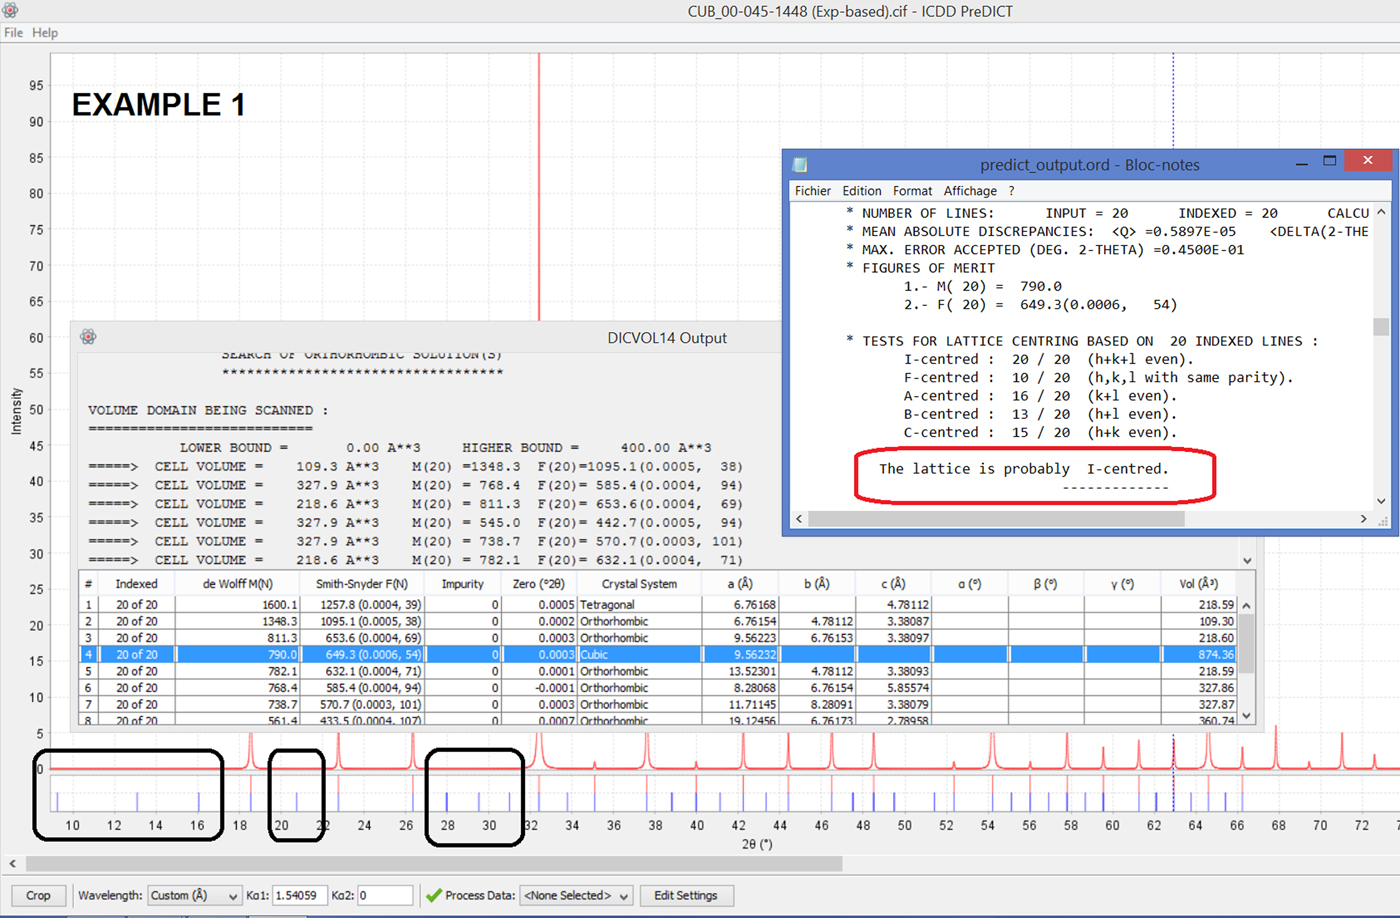
Only high-quality X-ray/neutron diffraction data should be used for indexing. The aim of this first example (described in Figure 4) using simulated data is to warn the reader against high symmetry cases. The various FOMs, M(N), F(N), but also the zero offset and the cell volume should be used with care and as indicative of a potential correct indexing only. A higher-symmetry unit cell (e.g., cubic) is always worth checking even if it does not rank first among the solutions found by DICVOL14 and does not feature the highest FOMs! SIeve+/PDF-4+ (Fawcett et al., Reference Fawcett, Kabekkodu, Blanton and Blanton2017) offer a most convenient way to obtain simulated diffraction 1D histograms. An alternative is to use the freely available CCDC/MERCURY software (Macrae et al., Reference Macrae, Bruno, Chisholm, Edington, McCabe, Pidcock, Rodriguez-Monge, Taylor, van de Streek and Wood2008).
(Colour online) Example 1: Monochromatic CuKα 1 simulation of cubic Cu2FeSbO6. A PreDICT input powder “.CIF” file is first obtained using SIeve+ and the PDF-4+ 2018 database (PDF card 00-045-1448). It is then read into PreDICT, 20 indexing peaks are selected and DICVOL14 runs. Many unit cells are found that include the correct cubic one which only ranks down as #4, FOM-wise. For this latter symmetry, all 20 selected peaks are accounted for, and many calculated indexed peaks are found to have zero intensities [black boxes], strongly suggesting a centering of the unit cell. The pristine DICVOL14 [.ORD] file yields the answer … I-centering … and must thus be compulsorily and thoroughly checked.
V. A TYPICAL EXAMPLE INVOLVING A 1D REAL DATASET
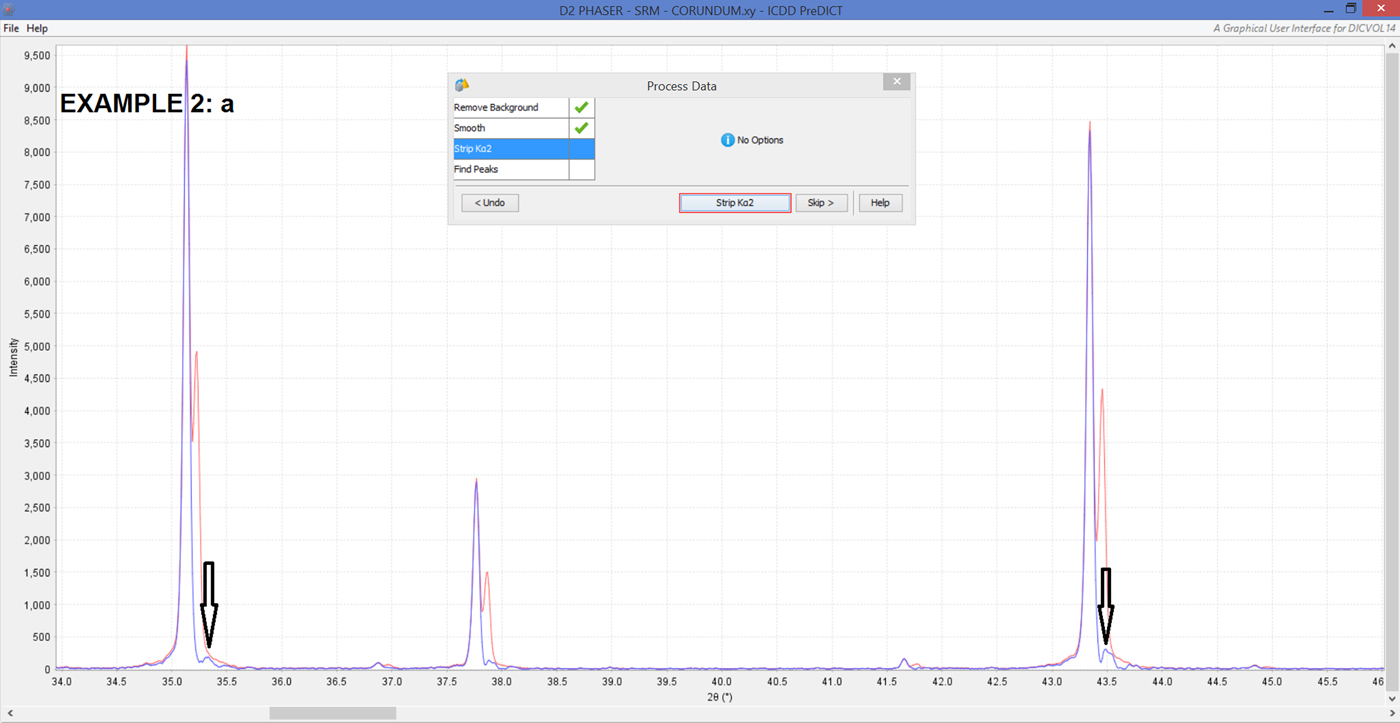
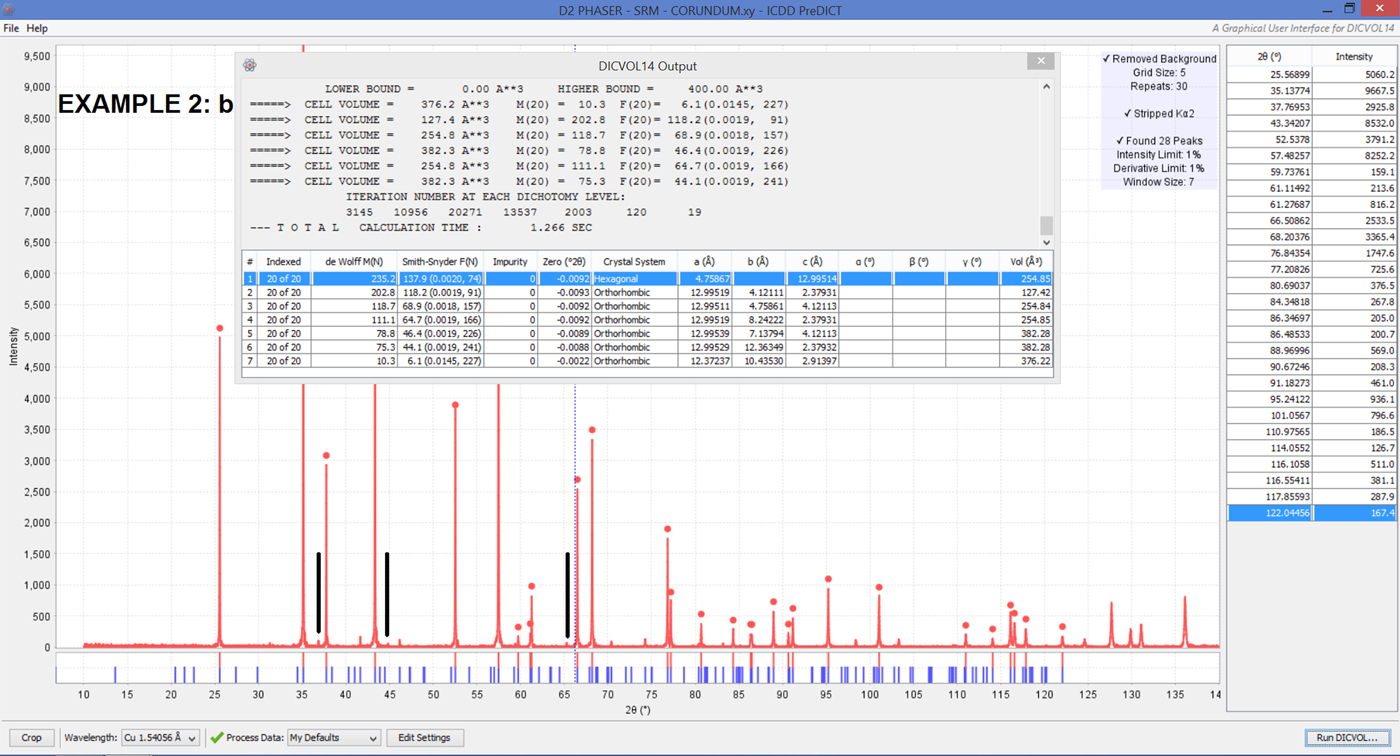
Although definitely not the first choice to attempt indexing on a new unknown chemical compound, polychromatic data (e.g., CuKα 1Kα 2) from a laboratory instrument (e.g., BRUKER/AXS D2PHASER) can in principle be handled by our PreDICT software, once the starting X-ray histogram in binary format [“.RAW”] has been converted to ASCII for instance using the freely available PowDLL software (Kourkoumelis, Reference Kourkoumelis2013). Subsequent data processing possibly involves (i) background removal, (ii) smoothing, and then mandatorily (iii) CuKα 2 or MoKα 2 stripping, yielding the (pre)processed diffraction data. Bragg peak selection for subsequent indexing comes in as the next step. One can use the corundum/Al2O3 SRM (Standard Reference Material: Bruker AXS Korundprobe A26-B26-S) usually provided with D2 PHASER desktop diffractomers to illustrate the above-mentioned pre-processing phase (Figure 5). Let it be with or without impurities (by ignoring weak peaks), the correct unit cell of the SRM is found straightforwardly (Figures 6 and 7). Once PreDICT has been run and it is observed that there are three impurity diffraction peaks (at 2θ = 36.88°, 44.83°, 65.29°), the latter values are inserted into the Sieve+/PDF-4+ 2018 database (ICDD, 2019) and software. The impurity phase is found to most likely be magnesium aluminum oxide (MgAl2O4).
(Colour online) Example 2(a): Polychromatic CuKα 1Kα 2 selected region of raw 1D X-ray diffraction data from a D2 PHASER diffractometer. The measured sample is SRM (corundum). The raw data are first smoothed (red line) and subsequently the CuKα 2 contribution is removed. Note the remnant peaks because of the imperfect removal of the CuKα 2 contribution, which sets limits on trustable weak lines and thus on what can be expected from the indexing process: use synchrotron or laboratory monochromatic radiation whenever available!
(Colour online) Example 2(b): Our SRM corundum sample turned out to be impure with weak impurity lines being observed, three of which are indicated (vertical black lines) by the mismatch between the calculated (blue) lines and related (red) peaks from the processed histogram. If mostly intense Bragg peaks are used for indexing (in the figure, the peaks marked with vertical red bars and red dots), the correct Al2O3 cell is found with very high FOMs: M(20) = 235.2 and F(20) = 137.9(0.0020,74).
(Colour online) Example 2(c): If the three impurity lines (black vertical bars) are now also included in the starting indexing set consisting of 25 ( = 20 + 5) lines (in the figure, vertical red bars and red dots), and up to five impurity peaks are now allowed as part of the indexing calculation, the correct corundum unit cell is again found with very high FOMs: M(20) = 165.7 and F(20) = 109.3(0.0030,61). Requesting up to −5 impurities (see the insert) instead of +5 is a coded way to execute a more exhaustive (but still not fully complete) DICVOL14 search (cf. Dicvol14 manual, v2).

VI. A TYPICAL EXAMPLE INVOLVING A 2D REAL DATASET
Two-dimensional (2D) diffraction at synchrotron macromolecular beamlines is being used increasingly to index, solve, and Rietveld-refine structures from powder data (e.g., Royappa et al., Reference Royappa, Tran, Papoular, Khan, Marbella, Millstone, Gembicky, Chen, Shepard and Elkaïm2018; Horwitz et al., Reference Horwitz, Xie, Filatov, Papoular, Shepard, Zee, Grahn, Gilder and Anderson2019). The preliminary step is to reduce the 2D binary image to a 1D ASCII “.XY” histogram featuring a non-equistepped 2θ increment, for instance by making use of the freely available DECTRIS/ALBULA software. This is not precluding the indexing of powder patterns or to the structure solution using FOX or EXPO, but becomes a problem for the final stage of the data analysis, the Le Bail and Rietveld refinements. The added feature in PreDICT, depicted in Figure 8, circumvents this difficulty.
(Colour online) Example 3(a): Monochromatic synchrotron 2D diffraction data (λ = 0.6888 Å) on a human kidney stone (whewellite) were collected using a 2D DECTRIS EIGER X 9 M detector at the SOLEIL/PROXIMA 2A macromolecular beamline. The data were subsequently converted into a 1D histogram (red line) using the freely available ALBULA software. An ASCII “.XY” dataset is obtained, featuring a decreasing 2θ-step from 0.0143° to 0.0126° across the entire diffractogram, and thereby unsuitable for direct conversion to the “.GSA” format (Larson and Von Dreele, Reference Larson and Von Dreele2004). The PreDICT feature displayed in the inset addresses this situation once a constant 2θ-step has been selected by the user (e.g., the 0.0135° average value). The starting ALBULA 1D histogram can then be suitably interpolated and transformed into a compliant GSAS file now allowing for straightforward subsequent Le Bail/Rietveld refinements.
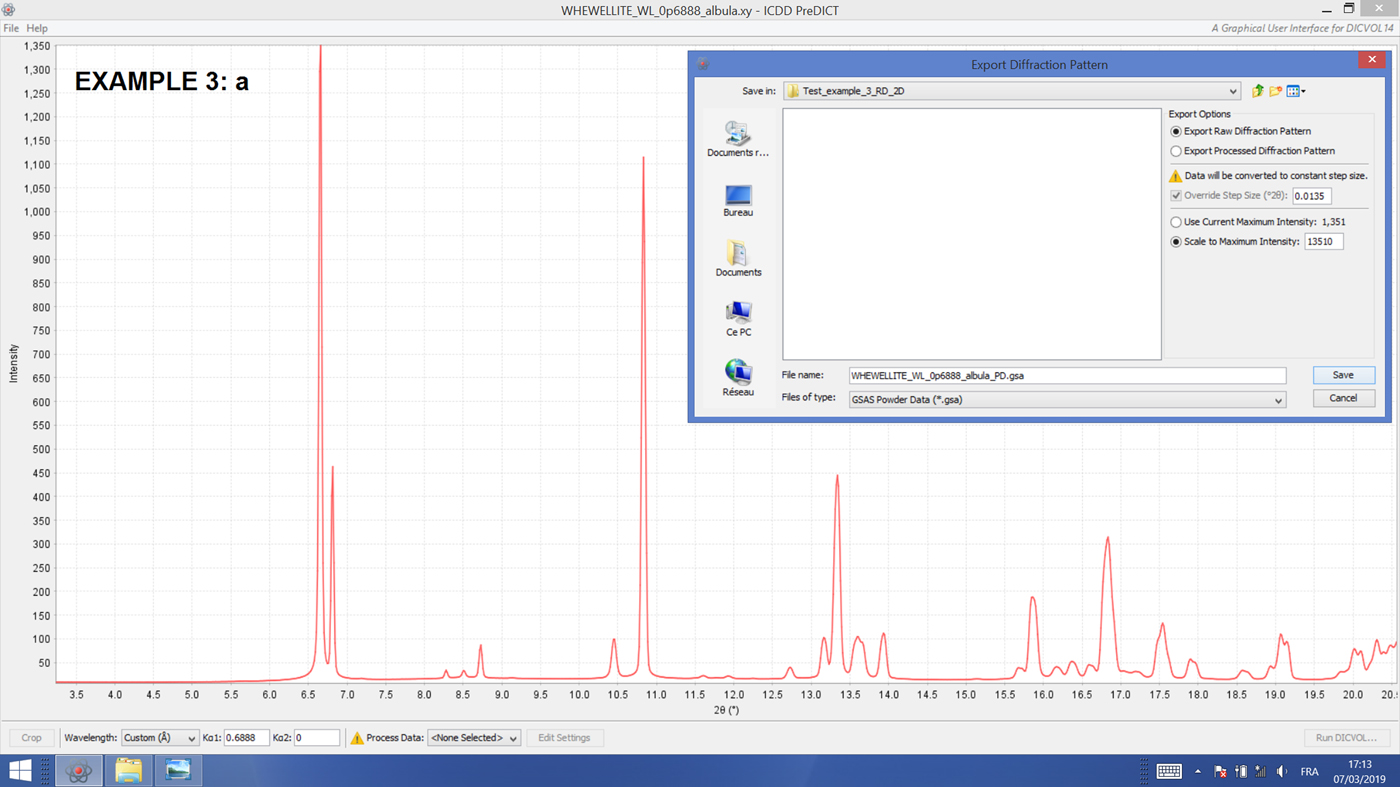
Two-dimensional-borne powder diffraction patterns are mandatory when too long an exposure to the X-ray beam may prove fatal to the samples, for instance in the case of biological samples (e.g., human kidney stones as in Figures 8 and 9). The much shorter (by a factor of about 25–30) data collection time comes at a price: broader peaks with slightly deformed shapes, increased overlap of the Bragg peaks, and so on. Only the experienced user should venture into indexing in such cases, although quite often most successfully.
(Colour online) Example 3(b): In spite of the somewhat large non-equistepped 2θ steps (averaged value: 0.0135°), the correct monoclinic unit cell (Tazzoli and Domeneghetti, Reference Tazzoli and Domeneghetti1980) is readily found by DICVOL14 with quite an acceptable FOM M(20) = 19.9, albeit in a different setting. The unit cell found by DICVOL14 is rightly flagged as primitive (P) in the DICVOL14.ORD output file and the P21/n (another setting of P21/c) space group (#14) accounts for the unobserved indexed reflections. Note that the original non-equistepped X-ray powder diffraction pattern was used for indexing.
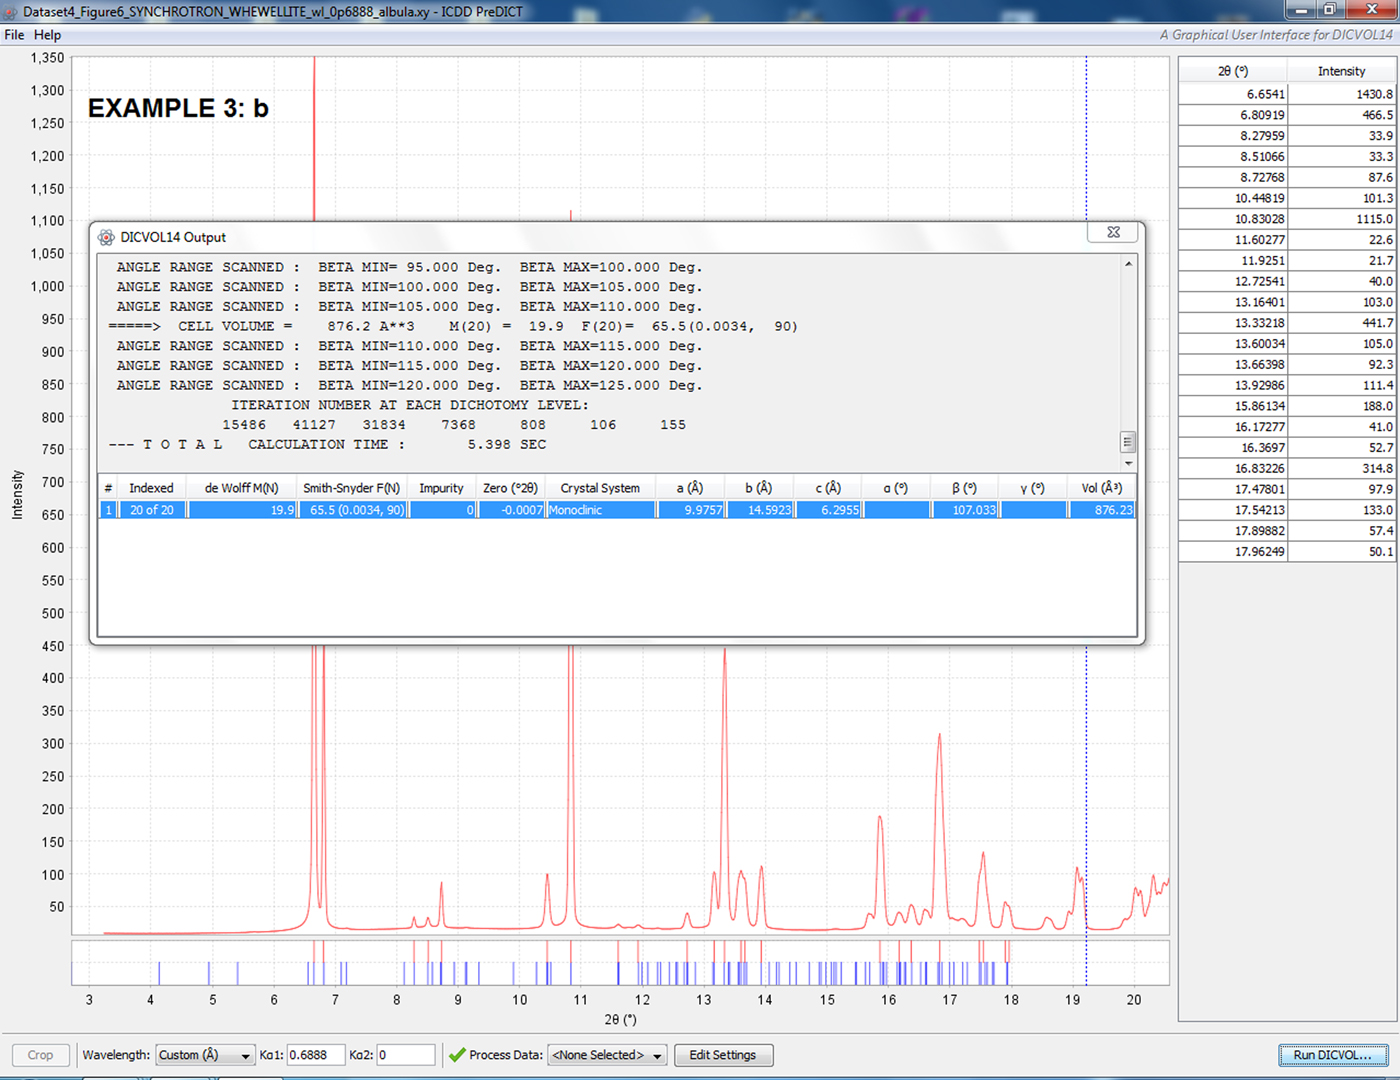
The last real data example described in this section and commented in the captions of Figures 8 and 9 emphasizes the fact that the unit cell is not uniquely defined: only the reduced unit cell is (Santoro and Mighell, Reference Santoro and Mighell1970; Burzlaff et al., Reference Burzlaff, Zimmerman, de Wolff and Hahn1983). In DICVOL04/14, the reduced cell is used to identify equivalent triclinic and monoclinic solutions (see Boultif and Louër, Reference Boultif and Louër2004). In the output files, the reduced cell is reported for a triclinic solution and its conversion to the conventional cell for a monoclinic solution.
VII. CONCLUSION
In this paper, we have presented the main functionalities of our GUI PreDICT for DICVOL14, which stands as the first DICVOL14 GUI to the best of our knowledge. The scope and size of this interface have been strictly limited in order to ensure portability and ease of use. A preliminary version was tested during Crystallographic Intensive Courses and Clinics in the USA, respectively, sponsored by the ACA (American Crystallographic Association) and the ICDD (International Centre for Diffraction Data). As has been abundantly mentioned in the past, the indexing of Powder Diffraction patterns requires user intervention and the best possible software will only provide the user with possible solutions rather than full certainty of correct indexing until a chemically plausible crystal structure is solved and refined. The use of complementary indexing methods can only help the user sort out and validate a possible solution (Bergmann et al., Reference Bergmann, Le Bail, Shirley and Zlokazov2004). Our recommended next best choice for indexing software is another freely available package, N-TREOR, as implemented in the EXPO software suite (Altomare et al., Reference Altomare, Giacovazzo, Guagliardi, Moliterni, Rizzi and Werner2000). When both DICVOL14/PreDICT and N-TREOR/EXPO point to the same unit cell and possibly lattice centering, the future looks bright.
SUPPLEMENTARY MATERIAL
The supplementary material for this article, which includes all the one dimensional diffractograms (simulated and raw data) discussed in this paper, can be found at https://doi.org/10.1017/S0885715619000514. The complete software package itself (PreDICT + DICVOL14) can be freely dowloaded as a unique ZIP file from the ICDD website, www.icdd.com/index.php/predict/.
ACKNOWLEDGMENTS
Dr. Thomas Blanton (ICDD, Newtown Square) is most gratefully acknowledged for his full-fledged support of the PreDICT project from its very inception, as well as for proofreading this manuscript. The authors thank Dr. Nathan Henderson (BRUKER AXS, Madison) for the D2 Phaser corundum data and Dr. William Shepard (SOLEIL, St Aubin) for the Whewellite data collected at the PROXIMA 2A beamline.