


Introduction
Motor vehicle collisions (MVCs) are a considerable source of morbidity and mortality in the United States. In 2010, there were nearly 5.5 million MVCs in the US, with 32,885 resulting fatalities and 2.2 million associated traumatic injuries. While these numbers represent significant improvements over the last decade, there is still, on average, one death every 16 minutes related to MVCs.Reference Plevin, Kaufman, Fraade-Blanar and Bulger 1
A fundamental principle of modern trauma systems is the delivery of the right patient to the right hospital at the right time. Previous work demonstrates that after trauma, decreased time-to-treatment correlates with improved outcomes. 2 - Reference Clark, Winchell and Betensky 4 Furthermore, appropriate triage of severely injured patients to a Level I trauma center is associated with decreased morbidity and a 25% reduction in mortality.Reference Dinh, Bein, Roncal, Byrne, Petchell and Brennan 5 , Reference MacKenzie, Rivara and Jurkovich 6 Emergency Medical Services (EMS) providers use the Guidelines for Field Triage of Trauma Patients, published by the Centers for Disease Control and Prevention (CDC; Atlanta, Georgia USA) National Expert Panel, to appropriately triage trauma patients.Reference Mackenzie, Rivara and Jurkovich 7 After assessing vital signs and the anatomic location of injuries, the mechanism of injury, vehicle intrusion, passenger ejection, and same-compartment occupant deaths are further evaluated as rules to identify patients who would require transfer to the highest level trauma center.Reference Mackenzie, Rivara and Jurkovich 7 An additional guideline was added that also examines the likelihood of severe injury based on telematics data.Reference Mackenzie, Rivara and Jurkovich 7
Studies have demonstrated that demographic and vehicle collision data can be utilized to create models that predict the likelihood of severe injury.Reference Sasser 8 Advanced Automatic Collision Notification (AACN) services in passenger vehicles capture data during a collision triggered by an airbag deployment that includes: change in velocity, principal direction of force, and seat belt use. Based on the potential utility of this data in guiding patient management, in 2011 “vehicle telemetry data consistent with a high risk of injury” was added as one criterion in step three of the triage guidelines.Reference Mackenzie, Rivara and Jurkovich 7 Demographic and collision data are often unavailable at the time of EMS dispatch, but preliminary models created with AACN collision data are equally sensitive at predicting severe injury as compared to the models that incorporate demographic with crash data into the algorithm.Reference Kononen, Flannagan and Wang 9
Other research has, in isolation, examined the impact of environmental factors on EMS response time. Studies have found that rural crashes in particular could benefit by improved crash notification, in terms of greater survivorship.Reference Ayoung-Chee, Mack, Kaufman and Bulger 10 , 11 Overall, mortality would be reduced and analyses using Fatality Analysis Reporting System (FARS) data from the US Department of Transportation/National Highway Traffic Safety Administration (USDOT/NHTSA; Washington DC, USA) showed decreases in fatalities when all crash-to-notification times were within one minute compared to later response times.Reference Lahausse, Fildes, Page and Fitzharris 12 , Reference Wu, Subramanian, Craig, Starnes and Longthorne 13
It is hypothesized that quicker notification time following a collision by utilizing automatic crash notification systems may improve occupant outcomes and help appropriately allocate resources to the scene for crashes involving severely injured patients. Using the NHTSA’s Crash Injury Research and Engineering Network (CIREN) database,Reference Clark and Cushing 14 the National Automotive Sampling System Crashworthiness Data System (NASS CDS) database, 15 and the FARS database, 16 this study assessed the association between EMS response times and the odds of fatality, taking into account fixed crash times, and examined crash, EMS system, and environmental factors impacting EMS response times.
Methods
Crash Injury Research and Engineering Network (CIREN)
The NHTSA’s CIREN database contains MVC data collected by six Level I trauma centers in the US. The database, compiled from 1996 to the present, includes detailed case reviews of serious MVCs. Approximately 650 crash elements and 250 medical elements are recorded for each occupant. The crash investigators document details of the crash scene (eg, tire skid marks and road conditions) in order to establish crash patterns and reconstruct the mechanics of the collision. The involved vehicles are inspected and a crush profile of the damaged plane is obtained to determine the force of the crash. The restraint systems are examined and occupant contact marks (eg, skin and fabric transfers) are documented to correlate with injury mechanisms. Prehospital data are obtained from EMS records. Details of the patient’s hospital course, including radiological findings, operations, and outcomes, are recorded. Each case is reviewed by a crash investigator, a research nurse, bioengineers, and several physicians (including a radiologist and a trauma surgeon) in order to establish a probable cause and mechanism of injury. The CIREN database was queried for all fatal crashes between 1996 and 2012 which had complete EMS times documented (n=171). These cases were divided into categories based on crash-notification time, defined as the amount of time elapsed between the crash and notification of emergency medical personnel (ie, 911 being alerted). In order to assess whether notification time correlates with poor outcomes, prehospital time was divided into segments and descriptive analysis was performed to evaluate patient demographics, cause of serious injury and death, transport mode to the hospital, disposition to a trauma center versus a non-trauma hospital, and number of invasive procedures performed within 24 hours of arrival at a trauma center. This study includes two case studies as examples of patients who may have benefited from AACN. These case studies aim to illustrate how health outcomes are impacted by response times.
Fatal Analysis Reporting System (FARS)
The FARS includes data from all police-reported crashes on public roadways in the US that result in at least one fatality within 30 days of the crash. The FARS database was searched for all fatal crashes between 2000 and 2011 that involved at least one passenger vehicle. Because only one set of EMS response and transport times were available for each crash, detailed analysis was limited to the driver in single-occupant, single-vehicle crashes. Available time segments included crash-time-to-notification, notification-to-EMS-arrival, and EMS-arrival-on-scene to EMS-arrival-at-hospital.
The FARS data were examined via descriptive statistics with an emphasis on examining the role of crash factors that could contribute to prolonged prehospital times. Extrication and crash location (urban or rural) were of particular interest. Rather than mean times, medians were reported due to the distribution of the data. These data are intended to examine factors which impact EMS times rather than mortality, as all crashes were fatal.
National Automotive Sampling System Crashworthiness Data System (NASS CDS)
The NHTSA’s NASS CDS is a nationwide crash data collection program. In order to be included in the NASS CDS, a crash must be police reported, involve a harmful event (property damage and/or personal injury) resulting from a crash, and involve at least one towed passenger car or light truck or van that was in transport on a traffic-way. Data are collected in 27 Primary Sampling Units throughout the US on vehicles involved in approximately 5,000 automobile crashes annually. Ten sampling strata are used that over-sample crashes resulting in fatalities and serious injuries. A crash investigation is performed and all injuries are documented and scored using the Abbreviated Injury Severity coding. 17 , Reference Revell, Pynsent, Abudu and Fairbank 18
All fatal crashes in the US involving a passenger vehicle that occurred between 2000 and 2011 were identified in NASS CDS. Passenger-vehicle driver and occupant(s) at all ages were included in the analysis. The NHTSA provided the CIREN team with time segment information beyond what was available in the public datasets. Time segments included: crash-to-EMS-notification, notification-to-EMS-arrival, EMS-arrival-to-scene-departure, and scene-departure-to-hospital-arrival. If multiple forms of transportation were used, the earliest time available was used for the EMS-arrival-to-scene time, and the latest time available for EMS-departure-from-scene.
The time segments in NASS CDS data were examined descriptively as well as via a logistic regression model, with death as the outcome. Time segments were modeled as a linear predictor, as an ordered categorical predictor with time grouped in intervals, and lastly as an ordered categorical model with dummy measures to give greater flexibility. Time segments for each prehospital period were divided into the following time intervals: zero to nine minutes, 10-19 minutes, 20-29 minutes, 30-59 minutes, and 60+ minutes. Results are reported as odd ratios of fatality in comparison to the zero to nine minute reference interval. To explore potential non-linearity of time in relation to odds of death and to identify potential change points in the direction and significance of odds of death, a spline model was implemented. A variety of cut points were explored.
All models were adjusted to account for differences in age, injury severity score (ISS), and collision severity using change in velocity during the collision (∆V) as a marker of crash severity. Due to concerns over influential outlier values, a delta-beta analysis was conducted to assess change in odds ratio when outliers were excluded from the analysis. A sensitivity analysis including only those crashes with crash-to-notification times less than 12 hours also was conducted. Results of the delta-beta analysis and sensitivity analysis did not vary considerably from previous findings and thus did not suggest the presence of influential outliers. Because the sample no longer represents national-level data due to the large number of cases with missing time data and the variability of time segments due to crash locations, weights were not used for NASS CDS data. Consequently, results should not be interpreted as nationally representative.
For all three data sets, only cases with complete time data were used. Within the analyses for NASS/CDS and FARS, all included individuals arrived at the hospital alive. The data analysis for this paper was completed using Stata software, Version 13 (StataCorp; College Station, Texas USA).
This study was approved by the University of Washington Institutional Review Board, Human Subjects Division (Seattle, Washington USA).
Results
Crash Injury Research and Engineering Network (CIREN)
Data Analysis
The mean age and ISS were similar between the notification interval groups, with the exception of a slightly higher ISS in patients with a notification time of 20-29 minutes (Table 1). The most common cause of death was thoracic trauma (38% of fatalities overall), followed by traumatic brain injury (TBI; 31% of fatalities overall). The distribution of cause of death was similar between notification time intervals.
Table 1 Demographic, Crash, and Hospital Data by Crash-Notification Time

Abbreviations: EMS, Emergency Medical Services; ICU, intensive care unit; ISS, Injury Severity Score; OR, operating room; TBI, traumatic brain injury.
a Crash-notification times are presented as median times, in minutes.
The mean change in velocity (mean ∆V) of fatal collisions was highest in the zero to nine minute interval group (48 kmph) and lowest in the 20-29 minute interval group (38 kmph). Although patients with a crash-notification time of 10-19 minutes were most likely to undergo an invasive procedure overall (60%), notification times of greater than 20 minutes were associated with an increased likelihood of requiring an invasive or operative procedure within the first three hours of hospital admission, although numbers were small. As notification time increased, so did the proportion of patients who were first taken to a regional hospital and subsequently transferred to a trauma center (eight percent in the zero to nine minute group versus 40% in the 30+ minute group), presumably after being stabilized at the local facility.
Case Studies
Multiple case studies were examined in CIREN. Two were selected where, because of the location/environment of the collision, the vehicles were not discovered until the following day. Two of these cases are detailed below as illustrative of situations in which AACN might have benefited the occupants of the vehicles.
-
∙ Case Study 1: The first case study involved the 66-year-old, male front passenger of a 2003 four-door utility vehicle that was involved in a severe frontal impact with a large tree (Figures 1 and 2). The crash occurred on a two-lane rural highway in the late evening in a dark area with no streetlights. The vehicle went down a slight slope before impacting the tree, and was thus not visible from the roadway in the dark conditions. The passenger and driver remained in the vehicle until the following morning when someone noticed the vehicle off the roadway and called 911. The front passenger was found dead when medics arrived the following morning. His injuries included a right subarachnoid hemorrhage, C4 fracture, hyoid fracture, multiple fractures of the sternum with a large right hemothorax and right lower lobe lacerations, a comminuted left patella fracture, and a fracture of the symphysis pubis. Review of these injuries suggests that early crash notification and treatment, particularly of the large right hemothorax, may have improved this patient’s outcome.
-
∙ Case Study 2: The second case study involved the 17-year-old, male rear-seat passenger in a four-door sedan that was involved in a severe frontal impact. He was wearing a manual lap/shoulder seatbelt. This crash occurred in the morning hours in a rural area on a two-lane blacktop county road. The vehicle drifted off the roadway, impacted a ditch/culvert with significant resulting damage (Figure 3), rotated out of the ditch, and came to rest in a resident’s driveway. The vehicle appeared parked, and it wasn’t until dawn when the resident noticed the driver and two passengers still in the car. This backseat passenger sustained bilateral intra-cerebral hemorrhage, facial fractures, bilateral pneumothoraces, a left radial/ulnar fracture, and two small bowel perforations and a serosal tear of the descending colon. The TBI resulted in a prolonged coma and 26 days in the intensive care unit. The delay in treating his small bowel injuries contributed to the development of bacteremia. Earlier notification and initiation of treatment for his brain and abdominal injuries could have improved his overall hospital course and outcome.

Figure 1 Case Study 1: Exterior Damage to the Front of the Vehicle.

Figure 2 Case Study 1: Interior of Vehicle, Front-Right Passenger Position.

Figure 3 Case Study 2: Exterior Damage to the Vehicle.
Fatal Analysis Reporting System (FARS)
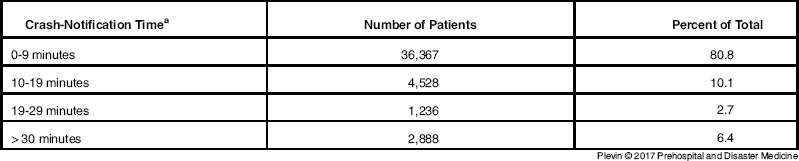
Information was extracted for a total of 91,200 drivers involved in single-vehicle, single-occupant fatal collisions between 2000 and 2011. The patients included in these analyses had a mean age of 40 years and were largely male (76%). The majority had a crash-notification time of less than 10 minutes (Table 2). However, 10.1% of collisions resulted in crash-notification times of 10-19 minutes, and 9.1% had notification times of over 19 minutes (Table 2).
Table 2 Distribution of Crash-Notification Times, from FARS Data
Abbreviation: FARS, Fatality Analysis Reporting System.
a Crash-notification times are presented as median times, in minutes.
In order to evaluate the relative contributions of each prehospital time segment to the total prehospital time, the total prehospital time was divided into quartiles (Figure 4). The median crash-notification time, notification-to-EMS-arrival time, and EMS-arrival-to-hospital-arrival time increased with each successive quartile. The time from EMS-arrival to arrival-at-receiving-hospital composed approximately 74% of the prehospital time, regardless of quartile (Figure 4). When the fatalities were divided according to location (urban or rural), the median times from crash-to-notification were similar (urban=two minutes versus rural=three minutes; Figure 5). However, the crash-notification time was greater than 10 minutes in a higher proportion of rural fatalities. Ninety percent of urban fatalities had crash-notification times of zero to 19 minutes; of the remaining 10%, only three percent had crash-notification times of greater than 30 minutes. Of the rural fatalities, however, 76.7% had crash-notification times of less than 10 minutes, 11.9% were in the 10-19 minute group, 3.4% were in the 20-29 minute group, and eight percent were in the >30 minute group (Figure 6). There also were considerable differences in the other prehospital time segments (Figure 5). Rural location nearly doubled the time from crash notification to EMS arrival (urban=six minutes versus rural=10 minutes) and the time from EMS arrival to hospital arrival increased significantly as well (urban=25 minutes versus rural=32 minutes).

Figure 4 Total Prehospital Time by Quartile, from FARS Data. Each quartile is divided into time segments: crash notification, notification to EMS arrival, and EMS arrival to hospital arrival. Data are presented as median times, in minutes. Abbreviations: EMS, Emergency Medical Services; FARS, Fatality Analysis Reporting System.

Figure 5 Median Total Prehospital Time, Urban versus Rural, from FARS Data. Each group is divided into time segments: crash notification, notification to EMS arrival, and EMS arrival to hospital arrival. Data are presented as median times, in minutes. Abbreviations: EMS, Emergency Medical Services; FARS, Fatality Analysis Reporting System.

Figure 6 Percentage of Fatal Crashes by Crash-Notification Time, from FARS Data. Results are presented separately for crashes occurring in urban and rural locations. Crash-notification times are presented as median times, in minutes. Abbreviation: FARS, Fatality Analysis Reporting System.
Collisions which required extrication of the driver resulted, perhaps unsurprisingly, in increased times from EMS arrival on-scene to arrival at a hospital. In Figure 7, box plots show that collisions requiring patient extrication resulted in higher median, 25th percentile, and 75th percentile EMS-arrival-to-hospital-arrival times than collisions that did not require extrication. The interquartile ranges also are higher, indicating that the group requiring extrication contains more outliers (ie, long EMS-arrival-to-hospital-arrival times).

Figure 7 Box Plots of the Median, 25th, and 75th Percentile EMS Arrival-to-Hospital Arrival Times. Separated into patients requiring extrication and those not requiring extrication. Data were obtained from the FARS database and is presented as median times, in minutes. Abbreviations: EMS, Emergency Medical Services; FARS, Fatality Analysis Reporting System.
National Automotive Sampling System Crashworthiness Data System (NASS CDS)
Information from a total of 12,298 fatal crashes between 2000 and 2011 was extracted from the database. In collisions where the patients were transported by a single ambulance, entrapment increased the median total prehospital time. The time from crash-to-notification was three minutes regardless of whether the victims were trapped in the vehicle. The time from notification-to-arrival of EMS on-scene also was similar (no entrapment=six minutes versus entrapment=seven minutes), as was the time from scene-departure-to-arrival-at-hospital (no entrapment=11 minutes versus entrapment=12 minutes). When victims were trapped, EMS personnel spent a median of 22 minutes on-scene, in contrast to the 16 minutes needed when entrapment was not a factor (Figure 8). Earlier time periods (eg, crash-to-notification and notification-to-EMS-arrival) were very close for both groups.

Figure 8 Median Prehospital Time by Entrapment, from NASS CDS Data. Each group is divided into time segments: crash notification, notification to EMS arrival, EMS arrival to EMS departure, and EMS departure to hospital arrival. Data are presented as median times, in minutes. Abbreviations: EMS, Emergency Medical Services; NASS CDS, National Automotive Sampling System Crashworthiness Data System.
A univariate analysis of the odds of fatality based on the total prehospital time showed that a one-minute increase in prehospital time was associated with a significant increase in the odds of death (OR=1.001; P value=.024). When prehospital time was broken into individual segments, a one-minute increase in crash-notification time, notification-to-EMS-arrival time, and EMS-arrival-to-scene-departure time were associated with increased odds of death, and a one-minute increase in scene-departure-to-hospital-arrival time was associated with decreased odds of death. However, only the odds ratios for the last two time periods, EMS-arrival-on-scene to departure and EMS-departure-from-scene to hospital arrival, were significant. When adjusted for age, ISS, and change in velocity, all time periods became non-significant with the exception of EMS-arrival-to-scene-departure time (OR 1.02 per minute; P<.001). An EMS-arrival-to-scene departure time of one hour or longer, compared to zero to nine minutes, was significantly associated with increased odds of death (OR 5.46; P=.029; Table 3).
Table 3 Odds of Fatality by Time Segment,Footnote a from NASS CDS Data

Abbreviations: EMS, Emergency Medical Services; ISS, Injury Severity Score; NASS CDS, National Automotive Sampling System Crashworthiness Data System; ΔV, change in velocity during the collision.
a Data are presented as odds ratios compared to the 0-9 minute interval for each time segment and are adjusted to account for differences in age, ISS, and ΔV.
Using a spline model and adjusting for patient age, ISS, change in velocity, and EMS mode of transportation (ie, Basic Life Support, Advanced Life Support, ambulance/airlift, or airlift only), the odds of death generally increased with longer crash-notification times. However, the odds ratio only became significant at and beyond 30 minutes. When crash-notification times were 30 minutes or greater, each subsequent one-minute increase in crash-notification time was associated with a significant increase in the odds of death (OR=1.13 per minute; P value<.001). When crash-notification times were less than 30 minutes, there was no statistically significant association between crash-notification time and odds of death, although the results trended in the same direction.
Discussion
Three national databases were used to evaluate whether fatalities related to automobile collisions might decrease with the use of AACN systems. The results indicate that TBI and thoracic trauma are the most common causes of death following an automobile collision (as seen in Case Study 1). Furthermore, longer crash-notification times were associated with an increased likelihood of a patient being taken to a local hospital and later transferred to a trauma center for a higher level of care, and involved more invasive procedures performed in the first three hours of arrival at a trauma center. This suggests that longer times in the field after a collision are associated with some level of clinical decompensation, ultimately resulting in increased needs for higher-level care.
In the two case studies, examples of patients who sustained severe injuries and were not located until hours after the collision as a result of environmental factors were presented. Their most severe injuries (pneumothorax, bowel perforation, and intra-cerebral hemorrhage) are life threatening if untreated, but with timely care can be managed and result in at least partial, and often full recovery. An AACN might have benefited these patients by alerting EMS providers of their location and facilitating timely transfer to a trauma center.
Analysis of FARS data demonstrated that the majority of a patient’s prehospital time occurs between the arrival of EMS providers on-scene and arrival at a receiving hospital. Similarly, the need for extrication led to an increase in time from EMS arrival to hospital arrival. This finding was mirrored in the NASS CDS data, which demonstrated that the need for extrication increased the amount of time between EMS arrival and departure to a hospital, as well as the overall prehospital time. The NASS CDS data also demonstrated that above a threshold crash-notification time of 30 minutes, there is a significantly increased likelihood of death with each additional minute of crash-notification time.
This study identified several areas where AACN would be beneficial. Over 30 years ago, Cowley described the “golden hour” after trauma, with patients who arrive at a trauma center during that time having more favorable outcomes. 19 , Reference Cowley 20 Although the importance of exact quantity of time within “golden hour” has been the subject of debate, the need for prompt and efficient care is undisputed.Reference Cowley 21 , Reference Rogers, Rittenhouse and Gross 22 One of the benefits of AACN is that it notifies EMS of the occurrence and location of a crash immediately after it takes place (likely would have benefited the patients in Case Studies 1 and 2). In light of the significant increase in mortality with crash-notification times over 30 minutes, this basic functionality of AACN could have profound effects on patient outcomes. Since 88%-92% of crashes have a crash-notification time of less than 30 minutes (Tables 1 and 2), AACN would likely be most beneficial in specific circumstances where there is an increased risk of long crash-notification times, such as crashes occurring in rural locations.
Previous work has demonstrated that increased overall prehospital time is associated with higher mortality following rural MVCs (as seen in Case Study 1).Reference Lerner and Moscati 23 It was found that the time from EMS arrival to hospital arrival following rural crashes was longer than in crashes that occurred in urban settings. Furthermore, higher crash-notification time was associated with a larger percentage of fatalities in the rural setting when compared to urban crashes and, in NASS CDS data, dummy category analysis demonstrated that time on-scene was associated with increased odds of fatality after one hour. Taken in aggregate, these data suggest that interventions aimed at decreasing the amount of time EMS personnel spend on-scene may be particularly beneficial for patients in rural collisions by helping them arrive at a hospital within the first hour after injury. This agrees with previous studies which found that EMS interventions were beneficial until they reached over 30 minutes.Reference Zafrullah Arifin and Gunawan 3
Certain prehospital time points are fixed. For example, a rural crash will almost always have a longer EMS-to-scene-arrival time than an urban crash, and crashes requiring extrication will almost always have longer on-scene times compared to crashes where no extrication is needed. An AACN can minimize the non-fixed time point: the time between crash and notification. In addition to notifying EMS providers of the occurrence and location of a crash, AACN transmits data specific to the nature of the collision, including change in velocity, seatbelt use, and direction of force. These variables were among those proposed by the CDC in 2008 for inclusion in AACN data transmission for field triage.Reference Gonzalez, Cummings, Phelan, Mulekar and Rodning 24 Since that time, they have been demonstrated to correlate with the severity of injury sustained in automobile collisions.Reference Sasser 8 , 25 These variables could alert providers to the need for multiple emergency crews, air transport, and specialized equipment for patient extrication. Advanced notification could decrease the time spent dispatching appropriate extrication resources and, therefore, decrease the time patients spend in the field.
Limitations
This analysis has several limitations. None of the three datasets are nationally representative. The CIREN cases are not selected in a statistically random way, but rather are selected based on the enrollment criteria for cases presenting to participating trauma centers. Thus, the cases represent a case series rather than a population-based sample, which limits the ability to make inferences to nationwide rates. However, the CIREN database provides more in-depth injury and medical data than any other nationwide crash database. Only single-passenger vehicle crashes were analyzed in the FARS database because of the complexity of collecting detailed EMS time data on crashes involving multiple vehicles and occupants, and because such data could not be correlated to individual occupants. Furthermore, data on pedestrians involved in an automobile collision as well as occupants of large trucks, motorcycles, and other vehicles were excluded.
The NASS CDS data represent a probability sample survey of police-reported MVCs. Complete case analysis requires time data being available for each case, with individuals surviving at least until they reached the hospital. Because ∆V was used to adjust for crash severity and rollover events do not include a ∆V estimate that utilizes the horizontal force, even if it was less severe than the rollover, provided the crash severity estimate. In addition, crashes with non-horizontal element (rollover only) were not included as ∆V was missing. Also, due to variability in crash location and missing time periods within the database, it is impossible to weight the data. Consequently, these data are not representative at the national level. In addition, fatality was the only outcome evaluated. Among those who survived, time elapsed could still impact the severity of injuries. Incomplete data reporting occurred in all three the databases, and in some cases, it was difficult to accurately pinpoint the beginning and end of each prehospital time segment.
Conclusion
After 30 minutes had elapsed following a MVC, every one-minute increase in crash-notification time significantly increased mortality. Furthermore, the majority of a patient’s prehospital time occurred between the arrival of EMS providers on-scene and arrival at a hospital. The need for extrication and rural location increased these time periods, as well as the overall prehospital time. An AACN may help decrease mortality following MVC by alerting EMS providers to a collision earlier and by helping providers discern when specialized or heavy equipment will be necessary in order to quickly extricate patients from the collision site and facilitate expeditious transfer to a trauma center.


