


Introduction
According to the World Health Organization 2015 data, the estimated global prevalence of hypertension in adults is 22.3% (20.5–24.2) (World Health Organization, 2017), this rate is 19.9% (15.5–24.4) for Turkey (World Health Organization, 2017). Reducing blood pressure (BP) and controlling hypertension decrease the risk of stroke by 35% of congestive heart failure by 42% and of coronary heart disease by 28% (Go et al., Reference Go, Mozaffarian, Roger, Benjamin, Berry, Borden, Bravata, Dai, Ford, Fox, Franco, Fullerton, Gillespie, Hailpern, Heit, Howard, Huffman, Kissela, Kittner, Lackland, Lichtman, Lisabeth, Magid, Marcus, Marelli, Matchar, McGuire, Mohler, Moy, Mussolino, Nichol, Paynter, Schreiner, Sorlie, Stein, Turan, Virani, Wong, Woo and Turner2013). Many factors play role in ineffective control of hypertension such as lack of patient participation in disease management, low compliance to medication use, insufficient intervention of the physician about lifestyle modification due to limitation of time and resources and deficiencies of the health system in the management of chronic diseases (Mancia et al., Reference Mancia, Fagard, Narkiewicz, Redón, Zanchetti, Böhm, Christiaens, Cifkova, De Backer, Dominiczak, Galderisi, Grobbee, Jaarsma, Kirchhof, Kjeldsen, Laurent, Manolis, Nilsson, Ruilope, Schmieder, Sirnes, Sleight, Viigimaa, Waeber and Zannad2013; Milani and Lavie, Reference Milani and Lavie2015).
The increasing use of smartphones and the rapid development of mobile technologies in recent years have led to the popularization of these technologies as a useful tool to control risk factors and improve patient outcomes (World Health Organization, 2011). This development, named as ‘mHealth’, is used to provide health education, to promote behaviour change, to facilitate the diagnosis and management of various health conditions, to support diagnostic tests or to keep medical records (Piette et al., Reference Piette, List, Rana, Townsend, Striplin and Heisler2015). The use of mHealth technologies in the follow-up of BP at home provides more effective cooperation between patient and physician. Mobile applications are shown to have important effects on improving individual’s BP control (Parati et al., Reference Parati, Stergiou, Asmar, Bilo, Leeuw, Imai, Kario, Lurbe, Manolis, Mengden, O’Brien, Ohkubo, Padfield, Palatini, Pickering, Redon, Revera, Ruilope, Shennan, Staessen, Tisler, Waeber, Zanchetti and Mancia2008; Mohammadi et al., Reference Mohammadi, Tafti, Hoveidamanesh, Ghanavati and Pournik2018). The correct use of applications may help to improve the lifestyle of patients with hypertension, increase their adherence to treatment and achieve the target BP. Although the use of smartphones is quite spread in our country, user-friendly and culturally adapted mobile applications to our population, especially in the field of chronic disease management, are limited.
The aim of the study is to assess the effectiveness of the eTansiyon smartphone application in BP control in patients with hypertension.
Methods
Study design and population
The study was a non-randomized controlled study and was conducted between 01.12.2017 and 20.12.2018. The study has been run in a total of six Family Health Units (FHUs) located in a total of five districts in Istanbul and Kocaeli/Turkey; Tuzla, Ümraniye, Maltepe, Pendik (2 units) and Darıca. The population of the study consisted of adult hypertensive patients.
The sample size was calculated by the EpiInfo program, to increase the patients with the target BP by 25% at a 95% confidence level with 90% power (Mills et al., Reference Mills, Bundy, Kelly, Reed, Kearney, Reynolds, Chen and He2016; Sengul et al., Reference Sengul, Akpolat, Erdem, Derici, Arici, Sindel, Karatan, Turgan, Hasanoglu, Caglar and Erturk2016), it was projected that a total of 174 patients with 58 participants in the intervention group (IG) and 116 participants in the control group (CG) (Kelsey, JL, Whittemore, AS, Evans, AS and Thompson WD, Reference Kelsey, Whittemore, Evans and Thompson1996). Similar to the literature (Davidson et al., Reference Davidson, McGillicuddy, Mueller, Brunner-Jackson, Favella, Anderson, Torres, Ruggiero and Treiber2015), it was planned to reach 240 people in total by taking into consideration the fact that 30%–40% of the participants might discharge from the study.
Inclusion criteria
Adult patients between 30 and 74 years old who have been diagnosed with essential hypertension for at least one year and who were using antihypertensive medications, and who have a smartphone, and who have a sphygmomanometer at home and/or who agreed to receive a new sphygmomanometer were included in the study.
Exclusion criteria
Patients who did not meet the inclusion criteria; patients with secondary hypertension; hypertension during pregnancy; patients with a BP measured as ≥180/110 mmHg during the first office visit; patients with stage 3 hypertension and end-organ damage; with a history of stroke, coronary revascularization in the last 3 months; chronic renal failure, heart failure; hearing or understanding problems were excluded from the study.
During the research, patients who changed their family physician and patients who were out of town/could not be reached at the time of evaluation; patients who did not undergo a one-week follow-up of BP; patients from the IG who deleted the smartphone application; the patients who did not want to continue to participate in the research and developed complications due to hypertension were excluded from the study.
Determination of family health units and randomization
The study was announced to an email group including family physicians working in the Family Health Centers. The first six physicians/FHUs that agreed to participate were included in the study. While selecting the study population, it was not possible to reach all hypertensive patients registered in the units, so patients could not be randomized. Randomization was performed at the FHU level so that the patients in the two groups were not affected by each other in the follow-up process. The units were randomized to 4 control and 2 IGs, so that randomization in this study was 2:1. Patients were included in the study using the random sampling method. Research team visited the physicians to assure standardized hypertensive patient follow-up for the control and the IGs and to validate the devices for BP measurement.
eTansiyon smartphone application
The mobile application software was developed by the contribution of Computer Engineering, Computer Technologies and Family Medicine. A study in which the technical information about the design and implementation of eTansiyon mobile application was presented in ASYU as a conference paper (Bajgora et al., Reference Bajgora, Doğan, Altikardes, Yilmaz and Uzuner2020).
This application was designed in Turkish language to increase the knowledge level of patients about hypertension, to increase their motivation for lifestyle modification and to increase their compliance with the treatment and their contribution to disease management. eTansiyon is planned as a diary to record BP measurements. Besides, in this application users can also record their medications, their anthropometric values and their laboratory results, and there are many informative videos contents about hypertension created with the narration of a doctor, instant notifications and messages for pill reminding based on pre-built algorithms. Instant notifications to increase motivation and provide lifestyle changes include many information such as salt restriction and nutritional advice, importance of exercise and weight loss, smoking cessation, restriction of alcohol use, regular medication use and BP measurement. Video contents long 2–5 min on average have been collected under total of 11 titles and listed below.
-
1. What is high BP? In which people does it occur more frequently?
-
2. What complaints and symptoms are seen in high BP?
-
3. What should I pay attention for accurate BP measurement?
-
4. How should I measure my BP at home?
-
5. What problems do high BP cause in my body?
-
6. What should be my target BP value and how can I reach this target?
-
7. As a hypertensive patient, what changes should I make in my lifestyle?
-
8. As a hypertensive patient, what should I pay attention to my diet?
-
9. To what should I pay attention when using medication for high BP?
-
10. What are the emergencies of high BP?
-
11. What are the common mistakes known to be true about high BP?
All the video contents are enabled to be used at any time from the application, and they are also sent to the patients with instant notifications at certain time intervals. In addition, patients using eTansiyon app have an opportunity to share the data they have recorded with their physician. Users could access eTansiyon from Apple Store and Google Play Store for their smartphones.
Data collection
In research units, hypertensive patients who have been informed and who accepted to participate have been recruited in the study. At the first interview, an evaluation form including socio-demographic (age, gender, marital status, education, occupation, salary) and health characteristics (smoking/alcohol status, salt-consumption, physical activity, history of hypertension, hypertensive medication (s), comorbidities), Morisky Medication Adherence Scale (MMAS-8) and Hypertension Knowledge Level Scale (Turkish abbreviation is HiB-DÖ) was filled by face-to-face interview method. Anthropometric and BP measurements were made and recorded. Framingham 10-year risk score was calculated. BP measurements were performed according to the European Society of Hypertension and the European Society of Cardiology (ESH/ESC) recommendations by a valid and calibrated BP measurement device (Omron M3 Comfort). Measurements were made from both arms first; then, 2 times measurement at 2–5 min intervals was made from the high measured arm, and systolic and diastolic BP averages were taken and recorded. All participants were informed about BP measurement at home, and BP-measuring devices were evaluated for their standards and validated. The patients were asked to record their BP measurements twice a day in the morning and evening for seven days and bring them back to the research team to be calculated for systolic and diastolic average values.
During the first interview with IG, eTansiyon was introduced and its user manual was explained. To protect the confidentiality of patient information and to ensure that only patients in IG could use the application, the users were recorded in the application database with user codes defined by the research team.
Follow-up process
The participants in both groups were followed for at least 4 months after the initial evaluation stage by the family physicians according to the common protocol defined by the research team based on evidence-based guidelines.
IG used eTansiyon and instant notifications with videos were sent during follow-up period. At the end of this period, each participant was re-evaluated by the researcher in their own FHU, with the same method used at the first interview. The study was completed with 185 participants, 124 in CG and 61 in IG, who completed the first evaluation, follow-up and final evaluation stages. The schematic view of the study sample is shown in Figure 1.
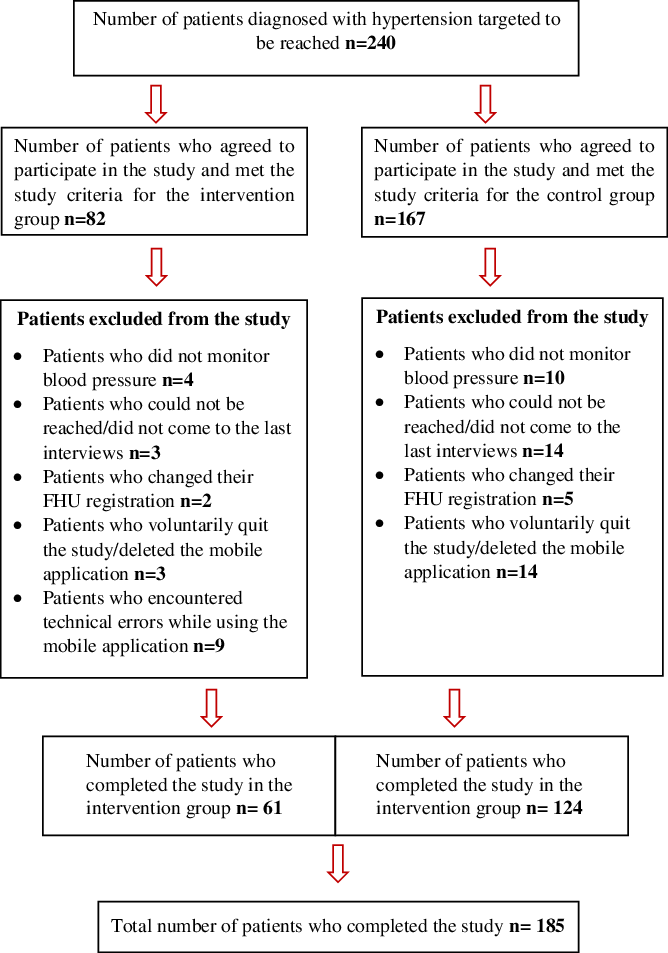
Figure 1. Schematic view of the study sample.
Outcomes of the study
Primary outcomes
-
Decrease in BP values
-
Increase in BP control at target: According to the 2018 ESC/ESH guidelines (Williams et al., Reference Williams, Mancia, Spiering, Rosei, Azizi, Burnier, Clement, Coca, De Simone, Dominiczak, Kahan, Mahfoud, Redon, Ruilope, Zanchetti, Kerins, Kjeldsen, Kreutz, Laurent, Lip, McManus, Narkiewicz, Ruschitzka, Schmeider, Shlyakhto, Tsioufis, Aboyans and Desormais2018), the target for systolic blood pressure (SBP) in office measurements; 120–129 mmHg for all people <65 years of age using of antihypertensive drugs, 130–139 mmHg for all people ≥65 years of age using antihypertensive drugs and 130 mmHg and lower if tolerated for all people <65 years of age using of antihypertensive drugs and who have diabetes (130–139 mmHg for all people with diabetes and ≥65 years of age). The diastolic blood pressure (DBP) target for all people who use antihypertensive medication should be <80 mmHg. Accordingly, when systolic and diastolic measurements are both within the target values, BP is considered ‘at target’; when SBP and/or DBP measurements are above the targeted values, BP is considered ‘not at target’.
Secondary outcomes
-
Increase in knowledge level about hypertension: Hypertension Knowledge Level Scale (Erkoc et al., Reference Erkoc, Isikli, Metintas and Kalyoncu2012) was used to evaluate the knowledge level consisted of 22 items, grouped into six sub-dimensions including definition of hypertension, medical treatment, drug adherence, lifestyle, diet and hypertensive complications. Each item is answered as true, false or do not know, and the patient gets one point for each correct answer. Patients with a total score of 18 and above on scale were accepted as sufficient, below 18 as insufficient.
-
Increase adherence to treatment: MMAS-8 (Morisky, Green and Levine, Reference Morisky, Green and Levine1986) was used. MMAS-8 scale was found to be appropriate to assess level of medication adherence (Chatziefstratiou et al., Reference Chatziefstratiou, Giakoumidakis, Fotos, Baltopoulos and Brokalaki2019) Those who scored ‘0’ were considered as ‘highly adherent’, 1–2 a ‘moderately adherent’ and 3–8 as ‘low adherent’.
-
Decrease in Framingham 10-year risk score for cardiovascular disease; Framingham Heart Study General Cardiovascular Disease Risk Prediction using BMI was used. The ‘Framingham Risk Scoring’ was performed by entering the participants’ gender, age, mean office SBP, hypertension treatment status, smoking status, diabetes history and body mass index at Framingham Heart Study website (Framingham Heart Study, 2018).
Statistical analysis
SPSS (version 20.0, SPSS Inc., Chicago, IL, USA) program was used to evaluate the data. In the analysis, categorical variables were summarized as frequencies and percentages. In the analysis of differences between the groups, chi-square test for categorical variables, Student’s t test for variables with normal distribution and Mann-Whitney U test for non-normal distribution were used. For intra-group changes in the follow-up period, McNemar test for categorical variables and paired-samples t test for continuous variables with normal distribution were used. Repeated measures ANOVA model was used to evaluate the time and group-based interactions of the differences for continuous responses of the groups at the end of the follow-up period (McCulloch and Searle, Reference McCulloch and Searle2000). Generalized estimating equations were used to evaluate the time and group-based interactions of the differences for categorical responses (Hardin and Hilbe, Reference Hardin and Hilbe2012).
Ethical approval was obtained from Marmara University Medical Faculty Clinical Research Ethics Committee with the protocol numbered 09.2017.671 and dated 08.12.2017. The research was conducted on the field with permissions received from the Istanbul and Kocaeli Provincial Health Directorates (numbered 16867222-799/2018 and 34059705-799/2018, respectively). The participants who met inclusion criteria and accepted the research signed the voluntary consent form after reading the volunteer information form and being informed about the research.
Results
Participants’ characteristics
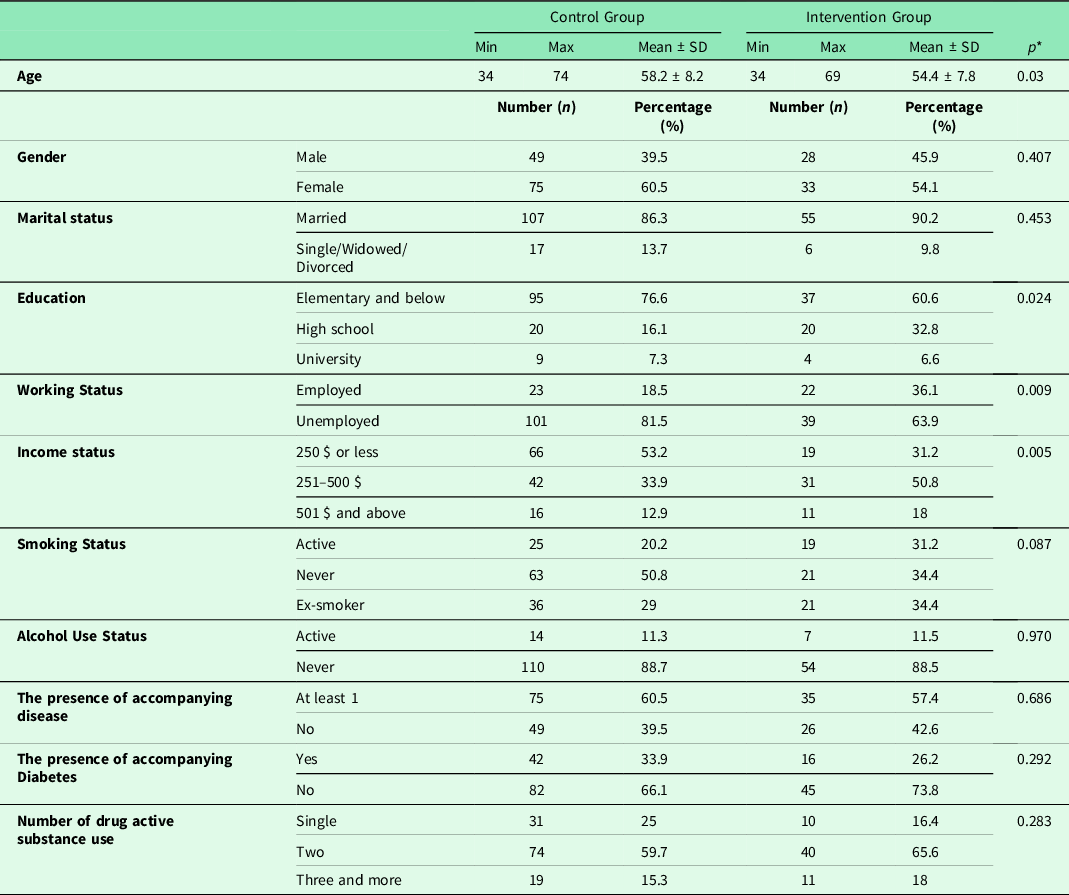
The sociodemographic characteristics of all participants are shown in Table 1. The mean age of the participants was 56.9 ± 8.2 (range:34–74) for all; 58.2 ± 8.2 (range:34–74) in CG; 54.4 ± 7.8 (range:34–69) in IG. The mean age of participants in CG was significantly higher than IG (P = 0.03). The median value of income of all participants was 300 $ (range:100–1600 $). The income level in CG was significantly lower than IG (P = 0.005). Diabetes was evaluated in accompanying diseases, as it affected the target BP results. There was no significant difference between CG and IG in terms of accompanying diabetes (P = 0.292).
Table 1. Distribution of sociodemographic and health-related characteristics of the participants according to groups
The median value of duration of diagnosis of hypertension, follow-up and treatment for the participants was 7 (min:1, max:38) years. This was 8 (min:1, max:38) years in CG and 5 (min:1, max:25) years in IG. The patients in CG had longer follow-up and treatment duration than IG (P = 0.019, Mann-Whitney U test). Average follow-up duration for the research was 176.6 ± 27.2 (min:122, max:239) days for all participants; 183,4 ± 27,4 (min:122, max:239) days for CG, and 162,7 ± 20,9 (min:129, max:198) days for IG. Patients in CG had longer follow-up than IG (P < 0.001).
The mean body mass index (BMI) of the participants at the first interview in the office was 31.7 ± 5 kg/m2 (min:23, max:49.4) for CG and 31.2 ± 4.8 kg/m2 (min:22.5, max:49.5) for IG. There was no significant difference in BMI between groups (P = 0.507).
All participants were using at least one antihypertensive drug for the treatment of hypertension at the first interview. There was no significant difference in terms of the number of drug active substance (DAS) between the groups (P = 0.283).
Blood pressure values
At the first interview, there was no significant difference between the groups in terms of mean office SBP and DBP (P = 0.090, P = 0.896, respectively). In the last interview, the mean office SBP and DBP was significantly lower in IG than CG (P < 0.001, mean difference 9.5, 95% CI: 4.6–13.4 mmHg and P = 0.007, mean difference 3, 95% CI: 1–6.6 mmHg, respectively).
At the first interview, there was no significant difference between the groups in terms of mean home DBP (P = 0.657); however, mean home SBP was higher in CG than IG (P = 0.005, mean difference 5.4; 95% CI 1.6–9.2 mmHg). At the last interview, mean home SBP and DBP were significantly lower in IG compared to CG (P < 0.001, mean difference 10.6, 95% CI 7.1–14.2 mmHg and P < 0.001, mean difference 4.8, 95% CI 2.4–7.3, respectively).
The changes of mean office and home SBP/DBP obtained from the first and last interview within groups are shown in Table 2, and the changes of mean for the groups’ office and home SBP/DBP during the follow-up period are shown in Figure 2.
Table 2. The changes of the mean office and home SBP/DBP values and median Framingham 10-year risk percentages obtained from the first and last interview of the participants
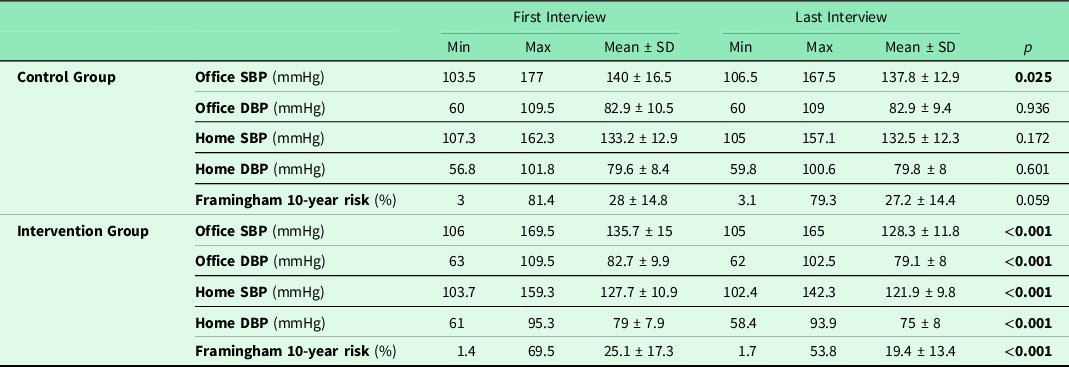
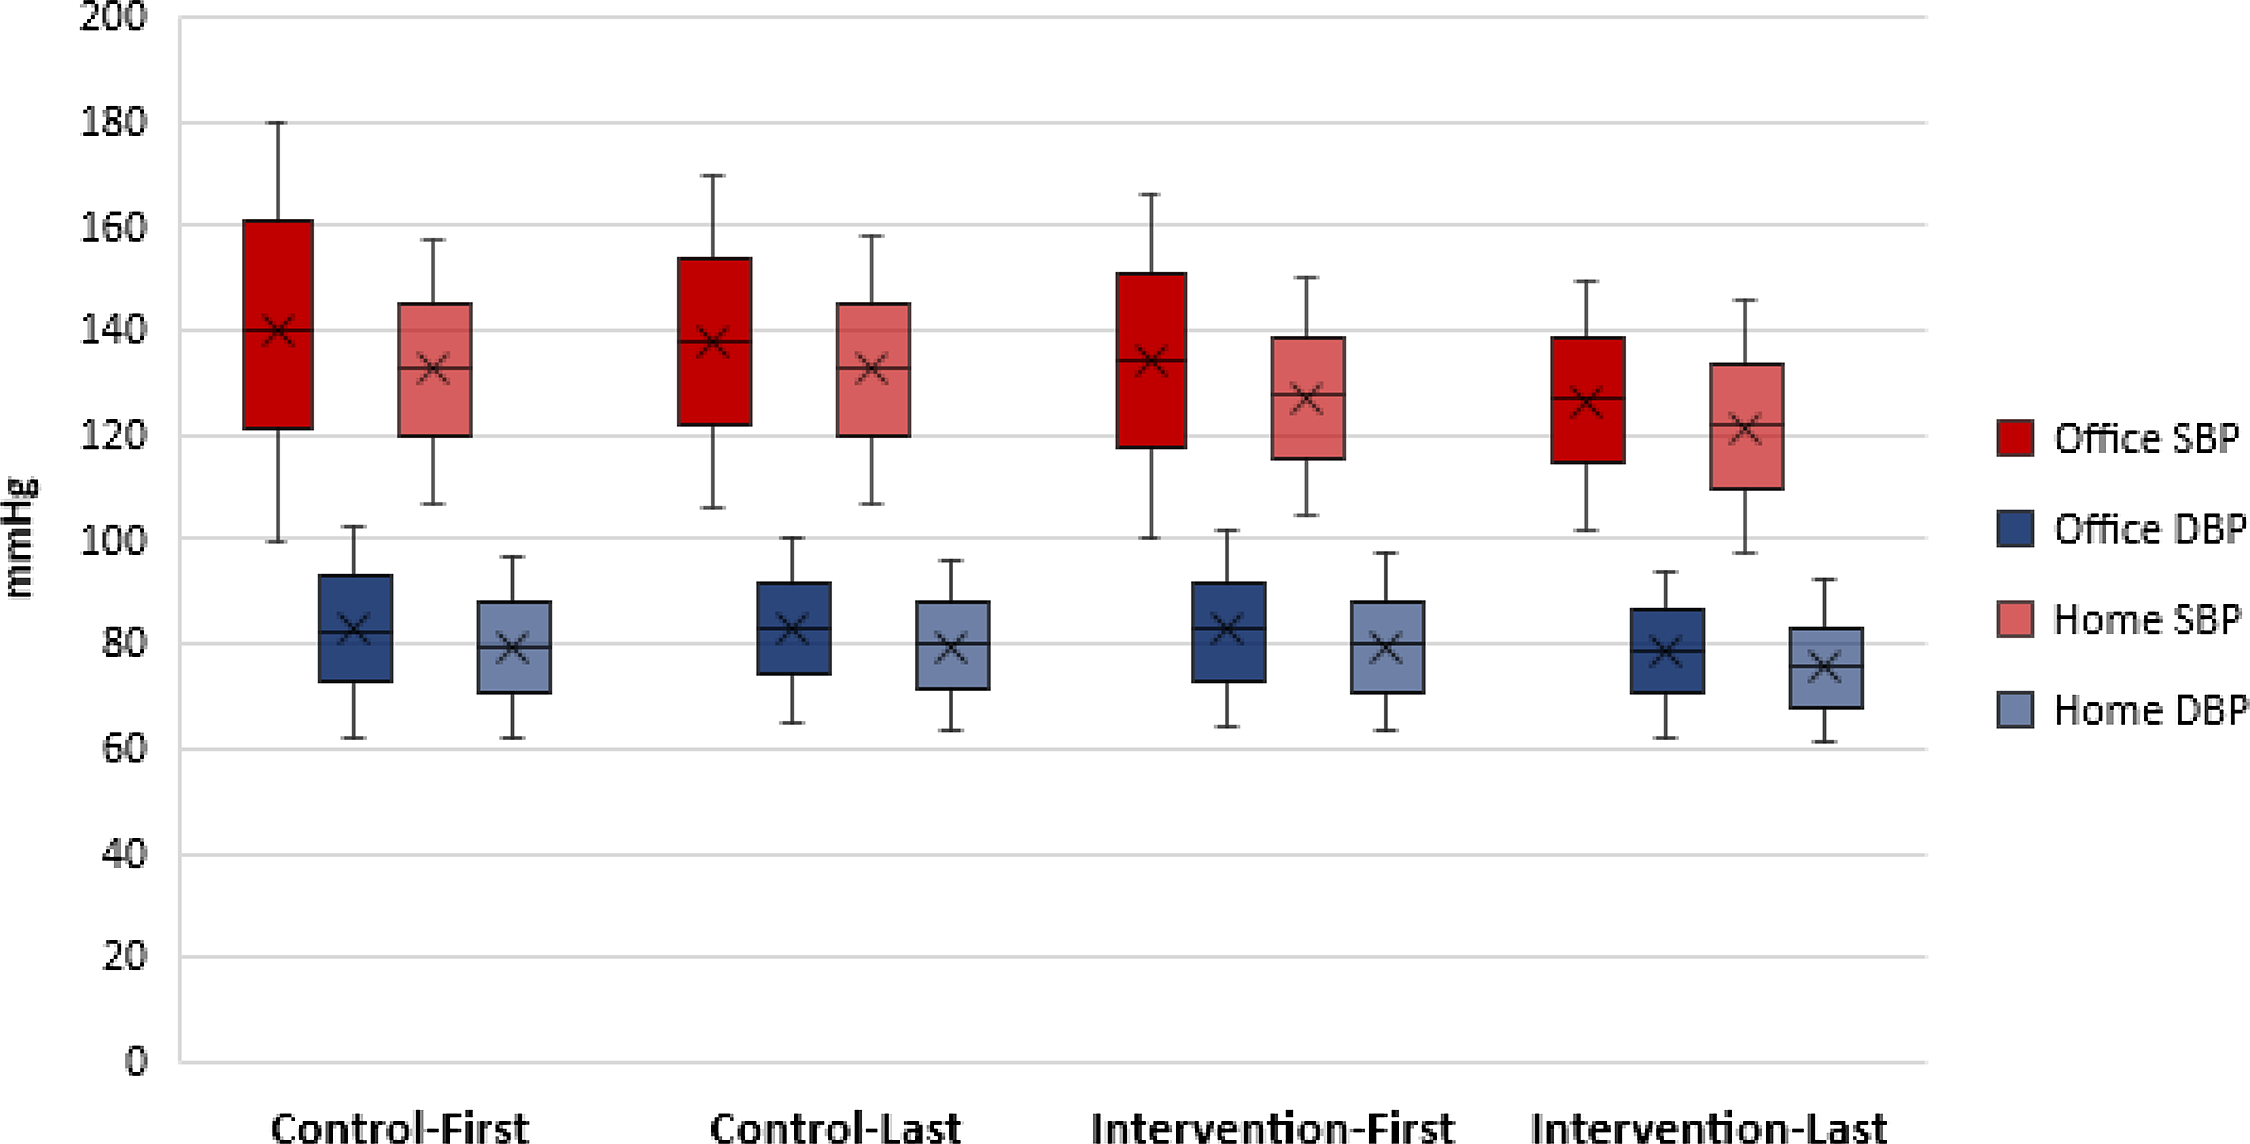
Figure 2. The changes of mean for the groups’ office and home SBP/DBP during the follow-up period.
The target blood pressure levels
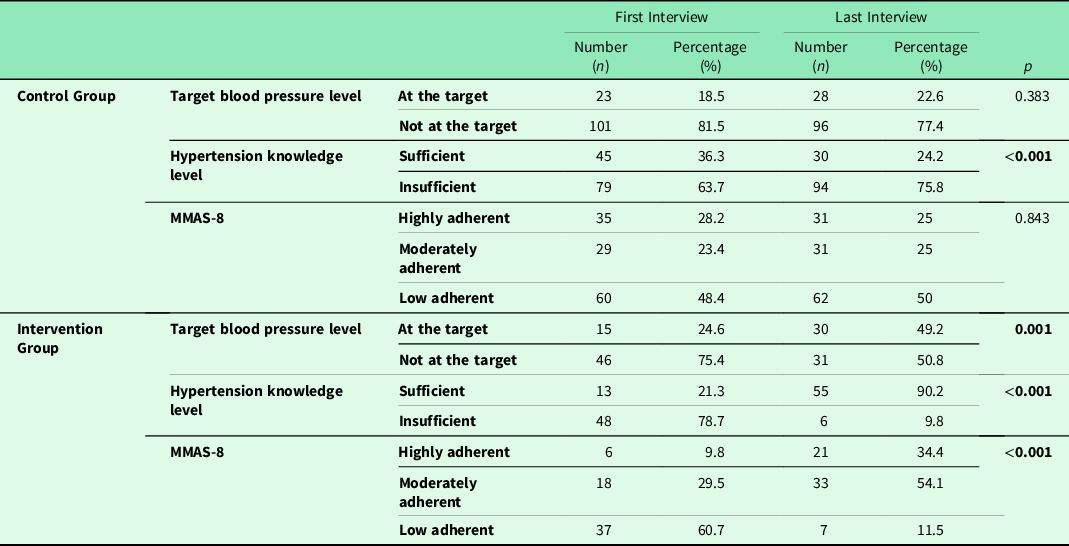
According to the office BP measurement, there was no significant difference between the groups in terms of the rate of people having BP at target in the first interview (P = 0.339). At the last interview, the rate of people with the target BP in IG was significantly higher than CG (P < 0.001). Table 3 shows the changes in the target BP levels within groups during the first and last interview.
Table 3. The changes of the target blood pressure level rates, hypertension knowledge level rates and adherence to treatments rates obtained from the first and last interview of the participants
According to ANOVA and GEE results, the duration of follow-up period for research and intergroup interaction is significant (Tables 4 and 5). IG and CG were affected differently during the follow-up period in terms of office SBP, office DBP, home SBP, home DBP and BP at target rates (P < 0.001, P < 0.001, P < 0.001, P < 0.001 and P = 0.024, respectively).
Table 4. Time and group-based interactions of the differences for blood pressure values
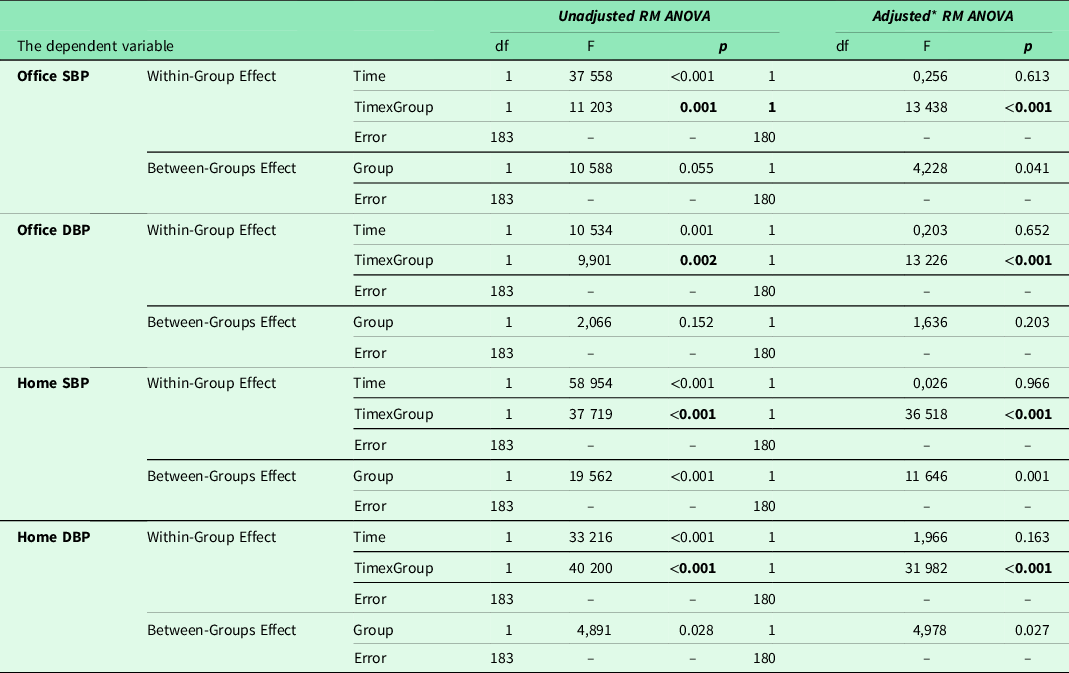
df = degree of freedom, F = test statistic.
* Dependent variable was analysed adjusting for age, educational status, duration of follow-up with diagnosis of hypertension.
Table 5. Time and group-based interactions of the differences for target blood pressure levels
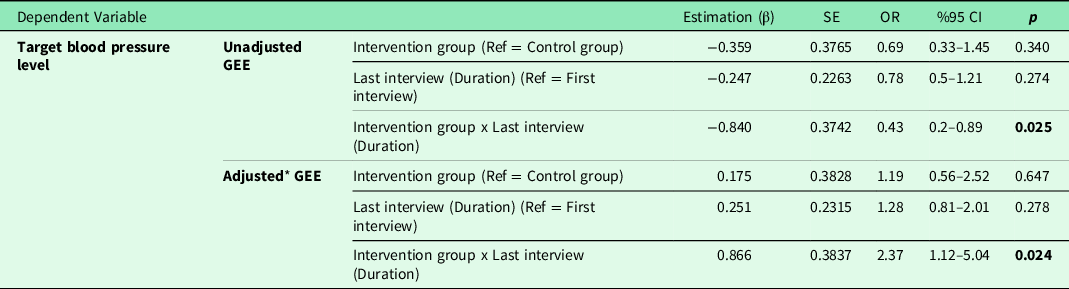
GEE = generalized estimating equations, SE = standard error, OR = odds ratio, Ref = reference category.
* Dependent variable was analysed adjusting for age, educational status, duration of follow-up with diagnosis of hypertension.
Hypertension knowledge levels
At the first interview, Hypertension Knowledge Level Scale (HiB-DÖ) mean score value was 15.8 ± 3.1 (min:7, max:21) for all participants; 15.9 ± 3.4 (min:7, max:21) in CG and 15.5 ± 2.5 (min:10, max:20) in IG. There was no significant difference between groups (P = 0.482). The scale scores of the two groups were dichotomized as sufficient and insufficient according to their knowledge level. The proportion of patients with sufficient knowledge level was higher in CG than in IG (P = 0.039).
At the last interview, mean score value was 16.6 ± 3.3 (min:8, max:22) for all participants; 15.3 ± 3.2 (min:8, max:21) in CG and 19.1 ± 1.6 (min:15, max:22) in IG. The mean score of IG was found to be significantly higher than CG (P < 0.001). According to dichotomized results, the proportion of patients with sufficient knowledge level was higher in IG than in CG (P < 0.001). Table 3 shows the changes in hypertension knowledge level rates within groups during the first and last interview.
Adherence to treatment
At the first interview, according to the MMAS-8 score, 22.2% (n = 41) of the participants were highly adherent, 25.4% (n = 47) were moderately adherent, and 52.4% (n = 97) were low adherent. The proportion of highly adherent patients in CG was higher than the patients in IG (P = 0.005). At the last interview, the proportion of highly adherent patients in IG was higher than the patients in CG (P < 0.001). Table 3 shows the changes in the target BP levels within groups during the first and last interview.
Framingham 10-year risk score for cardiovascular disease
At the first interview, there was no significant difference between the groups in terms of the risk of having CVD (P = 0.245). The median value of the normal percentage (%) of the participants calculated by age and gender using Framingham was 7.9 (IQR 5.5–13, min:2.5, max:22.2) for CG and 7 (IQR 4.7–12.7, min:1.5, max:21.3) for IG. There is no significant difference between the groups in terms of CVD normal risk calculated according to age and gender (P = 0.207, Mann-Whitney U test).
At the last interview, Framingham 10-year risk percentage (%) was significantly lower in IG than in CG (P = 0.001, mean difference 7.81%, 95% CI 3.5–12.2). The changes of median Framingham 10-year percentage obtained from the first and last interview within groups are shown in Table 2.
Discussion
The results of our study show that the intervention with eTansiyon provides a significant decrease in BP measurements, a significant increase in the BP control at target rates, a significant decrease in Framingham 10-year risk score, a significant increase in knowledge level and compliance of the patient with treatments. Some studies conducted with smartphone applications reveal similar results with our research. In the Patient Optimal Strategy of Treatment (POST) study (Albini et al., Reference Albini, Xiaoqiu, Torlasco, Soranna, Faini, Ciminaghi, Celsi, Benedetti, Zambon, Di Rienzo and Parati2016), 601 patients were followed up for 6 months as control and IGs. In this study, the effect of integrated use of a smart phone application called ESH Care on the improvement of hypertension was investigated. It was reported that on the 6th month BP measurements, patients had more decrease in IG office SBP/DBP values (10.5/6.2 mmHg) compared to CG means (6.1/3.4 mmHg). In terms of CG, while the decrease in the office SBP/DBP was 2.2/0.1 mmHg at the end of our study, this decrease was higher in the POST study. In POST study, calling CG to office at least two times during the follow-up period might have created this difference, it might also be caused by differences in the contents of smartphone applications. When compared to the target BP rates, in the POST study, the target BP level was taken as SBP < 140 and DBP < 90 mmHg and only patients not at target were included in the study. At the end, it was reported that 39.9% of CG and 72.3% of IG reached the target BP level.
In our study, patients with hypertension were included regardless of whether they had BP at target or not. The target BP was determined based on the 2018 ESH/ESC guideline and individualized according to age and the existence of diabetes. Although significant increase in the BP at target rates of IG was similar to values in POST study, a similar increase was not observed in our CG. This may be due to the fact that the POST study only involves patients whose BP is not at target; additional visits may explain the reason behind why the percentage of reaching the target in CG is higher than that of our study.
In the EMPOWER-H study (Lv et al., Reference Lv, Xiao, Simmons, Rosas, Chan and Entwistle2017), the initial and 6th month evaluations of a group of 149 patients were compared. In this study, BP values were automatically sent to a WEB-based disease management system and a personalized care model was evaluated to facilitate the management of hypertension by the patients on their own. Significant decreases in office and home SBP/DBP means (15.2/6.4 mmHg, 11.7/6.1 mmHg, respectively) were reported in the 6th month’s evaluation of the patients. In the EMPOWER-H study, it was observed that it had twice as much BP decrease compared to IG of our study. BP records were monitored at least three times a week in a single patient group and individualized feedback and lifestyle recommendations were given to the patients by a team of nurses, dieticians and pharmacists. During the research, a comprehensive intervention including office visits and consultations was carried out. In our study, the patient’s use of eTansiyon was left to the patient’s decision and there was no additional intervention. Within the application, the patients were given the opportunity to inform the family physician about their own recorded BPs and health data at any time by email and get feedback. The CG continued to receive routine health care. The decrease in BP mean values in EMPOWER-H may be due to more intensive intervention. In the EMPOWER-H, as in the POST study, the target BP values were determined as SBP < 140 mmHg and DBP < 90 mmHg in the office, and only patients whose BPs were not at target were included in the study. It was reported that 55.9% of patients had reached the target BP level after intervention, and this rate was 24.6% in our study. This difference may be due to fact that in EMPOWER-H the patients’ BPs were not at target and the intervention was more intense. In addition, the BP targets in ESH/ESC 2018 guide which was used in our study are lower than the previous edition of the same guide.
According to the results of our research, when the scores of the Hypertension Knowledge Level scale were examined, it was found that although the rate of patients with sufficient knowledge level in the first interview was lower in IG compared to CG, it was higher in the last interview than CG. In addition, when the groups were examined in terms of their first and last interview values, a significant increase of 69% was found in IG. This situation is accepted as a result showing that the intervention applied also affects the knowledge level. In CG, it was found that there was a 12% decrease compared to the first interview. This situation can be explained by the fact that patients who scored close to the number determined as the ‘cut-off value’ in the categorization of the scale gave incorrect answers to a few information questions at the end of the study and got a few points lower, thus remaining below the cut-off value and being evaluated in the category of insufficient knowledge level.
In a population-based intervention study in which 2-year follow-up results of 360 hypertensive patients in China were evaluated (Lu et al., Reference Lu, Tang, Lei, Zhang, Lin, Ding and Wang2015), patients were randomized into 3 groups. One of these groups was given booklets containing information about hypertension every month, the other group was given information about hypertension for about 30 min every month by making a phone visit, and the third group was included in the interactive hypertension study groups, where visual health education materials were also presented every month. After two years of intervention, significant increases were observed in the knowledge level scores related to hypertension, with the highest increase with the participants included in the study groups, followed by the normal education group and the self-reading group, respectively. As revealed by this research, the level of knowledge increases significantly with visual and auditory supported interactive methods. In our study, the fact that the information about hypertension was conveyed to patients with both notifications and videos, and the significant increase in the level of knowledge in our IG using eTansiyon application are supported by the results of this study.
When evaluated by categorizing according to MMAS-8 scores, at the end of our study, the rate of participants with low level of adherence to treatment was found to be lower in IG compared to CG. While the proportion of those with high adherence was found to increase significantly by 24.6% in IG, no significant increase was found in CG. In the MedISAFE study (Morawski et al., Reference Morawski, Ghazinouri, Krumme, Lauffenburger, Lu, Durfee, Oley, Lee, Mohta, Haff, Juusola and Choudhry2018), a smartphone application was used as an intervention in which patients could monitor their own medication use, and at the end of a 12-week follow-up period, there was no significant change in the CG, while the MMAS-8 score increased by 0.6 points in the IG. The increase in adherence levels with treatment after the intervention in this study supports the results we have obtained.
Framingham 10-year CVD risk percentage was found to be significantly lower (mean 7.8%) in IG compared to CG at the last interview, although there was no difference between them in the first interview. Considering the changes within the group, the percentage of risk detected in the last interview compared to the first interview decreased significantly in IG (mean 5.7%), while there was no significant decrease in CG. In the literature, the number of studies investigating the risk of cardiovascular disease using mobile applications associated with hypertension is limited, and in one study (Widmer et al., Reference Widmer, Allison, Lerman and Lerman2015), risk factors were investigated separately, a decrease in risk variables was reported, while the total risk was not discussed. The results of our study include a decrease in the total CVD risk percentage, as well as a reduction in factors of the affecting SBP average, the ratio of current smokers and the average BMI.
The active participation of patients in disease management provides success in achieving treatment goals (Proia et al., Reference Proia, Thota, Njie, Finnie, Hopkins, Mukhtar, Pronk, Zeigler, Kottke, Rask, Lackland, Brooks, Braun and Cooksey2014; Thomas et al., Reference Thomas, Shah, Elliot-Bynum, Thomas, Damon, LaPointe, Calhoun, Thomas, Breathett, Mathews, Anderson, Califf and Peterson2014; Jaffe and Young, Reference Jaffe and Young2016). Mobile applications allow the individuals to monitor their personal health data and to share them electronically with their family physician provide continuous and better monitorization of the patient. The contribution of electronic data sharing is important both in terms of continuity in service and easy and unhindered access to the patient’s physician (Samal et al., Reference Samal, Wright, Wong, Linder and Bates2011). In addition to other mobile applications currently used in the world, eTansiyon has been developed by healthcare professionals and its contents are based on evidence. We can consider the effect of eTansiyon on hypertensive patient management in several different dimensions.
Continuous and easy access
The main point that positively affects the occurrence of differences may be that the duration of patient consultation, which is limited in outpatient clinic conditions in patient management, is carried to a dimension where there is no time limit with this application. Patients can remotely share all measurement data with their physicians. This way can enable patients to reach their healthcare providers easily and quickly. It can ensure the continuity of the service by giving the health service providers the opportunity to evaluate even when the patients encounter a problem, are out of the city or cannot meet with the physician.
Video contents
The answers to the questions that most of the patients have in mind, from the definition of hypertension to BP measurement, from lifestyle suggestions to issues that need attention, are given to the patients by a pyhsician through the informative videos included in eTansiyon. With the application, patients can easily access all this information and watch them again. In similar applications (Milani et al., Reference Milani, Lavie, Bober, Milani and Ventura2017; Parati et al., Reference Parati, Torlasco, Omboni and Pellegrini2017), information is presented to patients in written texts, and this creates a limitation in accessing information by including the allocation of time for reading and the effect of visual acuity. However, eTansiyon provides patients with easy access to information in different ways by listening or watching. One of the most effective factors in adult learning is accessing information when needed. With eTansiyon, the information is available on the mobile phone in a place that the patient can reach immediately when they need it. The answers to the most frequently asked questions are also included in the app, and the patients are presented with an evidence-based and reliable source of information.
Messages and notifications
Sending informative and motivational messages about hypertension and related health conditions at certain times of the day through pre-build algorithms planned every three days on average may have affected the knowledge, attitude and behaviour of the patients. There is evidence in the literature that such information and motivational messages are particularly effective in increasing adherence with treatments (Ekinci et al., Reference Ekinci, Tuncel, Merder Coşkun, Akman and Uzuner2017; Varleta et al., Reference Varleta, Acevedo, Akel, Salinas, Navarrete, Garcia, Echegoyen, Rodriguez, Gramusset, Leon, Cofre, Retamal and Romero2017). The visual presence of a physician in the videos and the identification of the notifications in the form of written messages to the patients with that physician may have led to the perception of that physician’s words and the patient’s motivation to increase. Recording the drugs used in treatment and setting an alarm can increase the adherence of the low adherent patients.
Active participation of the patients in disease management
The fact that patients can record their BP measurements, access these measurements whenever they want, presenting these recorded data as a graphical feedback and being able to monitor BP changes provides the patient with the opportunity to control BP. In eTansiyon, giving colours along with the measurements on the BP history screen allows even individuals who have difficulty in using the technology to easily understand the degree of their measurements. Those who use technology more actively can also access detailed analysis from the graphic screen. Recording of BP measurements enables the patient to be evaluated more effectively in the long term for the physician who follows the patient. The patient’s decision-making with the physician in the treatment and goals of hypertension and active participation in the management of the disease are recommended and effective approaches in chronic disease management.
eTansiyon smartphone application makes a great contribution to the continuity of the physician-patient relationship by providing easily accessible evidence-based information, drug reminders, information and motivation notifications and visual content, keeping BP records and providing retrospective analysis to the patient, and allowing physicians to monitor their patients remotely. The strong and continuous physician-patient relationship contributes to increasing the patients’ medication compliance and BP control rates.
As a result, it may contribute to the reduction in mortality and morbidity for hypertension in the long term and to the reduction of health expenditures. As a result, it may contribute to the decrease in mortality and morbidity and health expenditures for hypertension in the long term.
This study has some limitations. The participants were not randomized at Family Health Centers. Randomization was performed at the FHU level. There were 6 FHUs and were included in the study either in control or IGs, consecutively, and participants were recruited by random sampling method. The six units in different locations we included in the study may not be sufficient to disseminate the results of the study to the general population.
Conclusion
The results of the study provide us the evidence that eTansiyon mobile app is an effective and applicable tool for the monitoring of hypertension. In today’s world, family physicians are also expected to benefit from developing technologies and integrate them into their clinical practice. However, there is a need for proven beneficial methods in this field. Considering the daily patient care burden of family physicians and the limitation of time, it is an important opportunity to use mobile technologies in the provision of health services especially for the management of chronic diseases.
Acknowledgments
The authors express their grateful appreciation to Emrah Kırımlı M.D, Hayriye Külbay M.D Güler Şahoğlu Ünver M.D, Senem Aslan M.D for their invaluable supports in managing patients and help gathering data. Our study results in the article have been previously presented as an oral presentation at the 14th Family Medicine Research Days in Istanbul, April 2019.
Financial support
The research with the project number ‘SAG-C-TUP-150218-0039[8212]’ was supported by the Scientific Research Projects Unit of Marmara University with providing 13,474.80₺ financial support for obtaining the necessary technical equipment and services for research.
Conflict of interest
The authors state that they have no conflict of interest and no commercial relationship or other associations that might pose a conflict of interest in connection with the manuscript.
Author contribution
EY: Design, Data Collection, Analysis, Manuscript; AU: Design, Analysis, Manuscript; MB: Design, Technical Support; BD: Design, Technical Support; ZAA: Design, Technical Support; BKG: Data Collection; EA: Analysis


 Open access