


Introduction
Attenuated inhibitory performance is one of the most robust findings in the neuropsychology of attention-deficit/hyperactivity disorder (ADHD) (Alderson et al. Reference Alderson, Rapport and Kofler2007; Lipszyc & Schachar, Reference Lipszyc and Schachar2010). However, it is unclear whether this represents a deficit in outright stopping (reactive inhibition), whether it relates to a deficit in strategic response slowing (proactive inhibition), or both (Chevrier et al. Reference Chevrier, Noseworthy and Schachar2007; Bhaijiwala et al. Reference Bhaijiwala, Chevrier and Schachar2014). In addition, children with other development disorders, such as autism spectrum disorder (ASD), often have symptoms of inattention, impulsivity, and hyperactivity similar to children with ADHD. These may relate to similar underlying changes in inhibitory processing. Indeed, it is unclear if inhibitory deficits are specific to the diagnosis of ADHD or related to symptoms of ADHD irrespective of the formal diagnosis. Here, we set out to dissociate reactive and proactive inhibition in children with symptoms of ADHD, using a modified stop-signal task (SST), called the stop-signal anticipation task (SSAT) (Zandbelt & Vink, Reference Zandbelt and Vink2010).
The SST assesses how participants stop a response that has already been initiated (Verbruggen & Logan, Reference Verbruggen and Logan2008). A stream of go signals is presented that all require a response. Infrequently, a go signal is followed by a stop signal indicating that the participant should withhold his or her response. The ability to stop is conceptualized in terms of a race between two independent processes: a go process that produces the response and a stop process that cancels it (Logan & Cowan, Reference Logan and Cowan1984). If the go process finishes first, a response is produced; if the stop process finishes first, the response is canceled. Furthermore, this model provides methods for the estimation of the speed of the (covert) stop process – the stop-signal reaction time (SSRT) – on the basis of the response rate on stop trials and response times (RT) on go trials. SSRT is a measure of reactive inhibition, but does not address proactive inhibition.
To measure proactive inhibition, the ability to adapt ongoing responses in relation to contextual cues, researchers have adapted the SST by introducing cues that inform the participant about the possibility of an upcoming stop signal (Verbruggen & Logan, Reference Verbruggen and Logan2009; Zandbelt & Vink, Reference Zandbelt and Vink2010). For example, in the SSAT, a visual cue indicates the probability that a stop signal will occur (Zandbelt & Vink, Reference Zandbelt and Vink2010; Zandbelt et al. Reference Zandbelt, Bloemendaal, Neggers, Kahn and Vink2013; Vink et al. Reference Vink, Kaldewaij, Zandbelt, Pas and du Plessis2015). Participants respond to this manipulation by adjusting their response strategy, slowing down as stop-signal probability increases. Another prominent feature of this task is that it requires participants to make a timed response, rather than a speeded response as in the standard SST. As a result, response latency (i.e. RT) differences between groups are usually small or absent (e.g. Zandbelt et al. Reference Zandbelt, van Buuren, Kahn and Vink2011). Thus, the SSAT enables the quantification of proactive response slowing and reactive stopping, while minimizing group differences in baseline response latencies.
Deficits in inhibitory processing have been reported across multiple disorders (e.g. Enticott et al. Reference Enticott, Ogloff and Bradshaw2008; Geurts et al. Reference Geurts, van den Bergh and Ruzzano2014) and deficits associated with a diagnostic category are not necessarily specific to that diagnosis. Therefore, we did not only include children with ADHD, but also children with high parent-rated levels of ADHD symptoms, who had been primarily diagnosed with an ASD. We hypothesized that children with symptoms of ADHD have a specific neurobiological profile, irrespective of their clinical diagnosis. Moreover, by relating performance measures to parent-rated ADHD symptoms across clinical groups, we could analyze neuropsychological functioning in a trans-diagnostic fashion. We hypothesized that these groups would not differ from each other in ADHD symptoms or task performance, as might be suggested by their diagnostic labels.
We first tested if the well-documented finding of slower inhibitory speed (i.e. SSRT) in children with ADHD could be replicated, in the context of timed responding (SSAT) as opposed to speeded responding (standard SST). Second, we investigated whether children with ADHD showed a deficit in proactive inhibition in addition to a deficit in reactive inhibition. Third, we tested if the findings were specific to children with a diagnosis of ADHD or rather were also present in children with ASD and ADHD symptoms. Finally, we tested for an association between parent-rated ADHD symptoms and inhibitory performance across diagnostic groups.
Method
Participants
One hundred and eight right-handed boys aged 8–12 years met full inclusion criteria for this study. An initial screening for off-task behavior, based on mean RT and/or percentage omission errors (OMISS), yielded five extreme outlier subjects (three interquartile ranges above the third quartile of the sample as a whole). As such, data from 103 children were available for final analyses: 39 children with ADHD, 32 children with ASD and ADHD symptoms, and 32 typically developing controls. Table 1 provides demographic information. The institutional review board of the University Medical Center Utrecht (UMCU) approved all study procedures. Both parents and children aged 12 years provided written informed consent, younger children provided verbal assent. Participants with ADHD or ASD and ADHD symptoms were recruited through schools for special education and the UMCU outpatient clinic for developmental disorders. Control participants were recruited through primary schools. Only children using no medication or short-acting psychostimulants (e.g. methylphenidate) were included. In the ADHD group, 28 of 39 participants (72%) were on short-acting psychostimulants. In the group of children with ASD and ADHD symptoms, this was 21 of 29 participants (72%). Here, data on medication use were missing for three participants. All parents were instructed not to administer medication in the 24 h prior to testing. All children received a 30 Euro gift voucher for participating in the study. A majority (76 of 103) of participants included in this study also participated in a set of two fMRI experiments. Results from these tasks were analyzed separately and have been submitted for publication elsewhere.
Table 1. Demographic characteristics

s.d., standard deviation; ADHD, attention-deficit/hyperactivity disorder; ASD, autism spectrum disorder; SWAN-hyp, Strengths and Weaknesses of ADHD and Normal Behavior hyperactivity/ impulsivity subscale; SWAN-att, Strengths and Weaknesses of ADHD and Normal Behavior inattention subscale.
a Significant post hoc group difference from typically developing children after FDR correction.
In/exclusion criteria
The Diagnostic Interview Schedule for Children (DISC-IV, parent version) (Shaffer et al. Reference Shaffer, Fisher, Lucas, Dulcan and Schwab-Stone2000) was administrated to parents of all participants. In addition, children participated in a four-subtest short form of the Wechsler Intelligence Scale for Children (WISC-III) in order to estimate full-scale IQ. General in- and exclusion criteria were: age 8 through 12 years, an (estimated) IQ equal to or higher than 70, no history of or present neurological disorder, and the ability to speak and comprehend Dutch. Additional criteria for children with ADHD included a clinical Diagnostic and Statistical Manual of Mental Disorders, Fourth Edition (DSM-IV) diagnosis of ADHD confirmed by the DISC-IV. Children with ASD and parent-rated ADHD symptoms were included if they met criteria for a clinical DSM-IV diagnosis of ASD and scored above the age-appropriate threshold for subclinical problems on the attention problems subscale of the Child Behavior Checklist (CBCL) (Verhulst et al. Reference Verhulst, Van Der Ende and Koot1996). The absence of psychiatric disorders in typically developing children was confirmed using DISC-IV (with an exception of specific phobia and enuresis). Furthermore, typically developing children were required to have normal (not clinical or subclinical) scores on any of the CBCL subscales.
Questionnaires
Parents were instructed to rate their child's behavior without medication. In addition to the CBCL, parents completed the Strengths and Weaknesses of ADHD and Normal Behavior (SWAN) questionnaire (Polderman et al. Reference Polderman, Derks, Hudziak, Verhulst, Posthuma and Boomsma2007; Lakes et al. Reference Lakes, Swanson and Riggs2012). We chose this questionnaire as it assesses symptoms listed in the DSM-IV definition of ADHD across the complete spectrum of functioning (both strengths and weaknesses relative to their peers). It measures items on a seven-point scale ranging from ‘far below average’ via ‘below average’, ‘somewhat below average’, ‘average’, ‘somewhat above average’, ‘above average’ to ‘far above average’. This way, in general population samples, scores are normally distributed (Polderman et al. Reference Polderman, Derks, Hudziak, Verhulst, Posthuma and Boomsma2007).
Stop-signal anticipation task
The SSAT is a variation on a classic stop-signal paradigm and was designed to assess both reactive and proactive inhibition (Zandbelt & Vink, Reference Zandbelt and Vink2010). We introduced the task in a storyline format, where children were asked to help a spaceship land on the moon (see next paragraph). During all trials, three horizontal lines were shown on a gray background (see Fig. 1). The second line (i.e. target line) was placed at 80% of the distance from the bottom line to the top line. During every go trial, a bar moved from the bottom to the top line in 1000 milliseconds (ms). The first objective was to press a button with the right index finger to halt the bar as close to the target line as possible (i.e. go trial with a target RT of 800 ms). Stop trials were identical to go trials, except that the program made the bar stop before it reached the target line (i.e. stop signal). In this case, participants had to withhold the button press. The probability that a stop signal would appear was manipulated across trials (randomly interspersed) and the color of the target line provided information on this stop-signal probability. The task consisted of four blocks. In each block, there were 41 green trials with 0% stop-signal probability (41 go trials, zero stop trials), 40 yellow trials with 27.5% stop-signal probability (29 go trials, 11 stop trials), 40 orange trials with 32.5% stop-signal probability (27 go trials, 13 stop trials), and 40 red trials with 37.5% stop-signal probability (25 go trials, 15 stop trials), so that there were 122 go trials and 39 stop trials per block. The stop-signal onset time was initially set to 500 ms after trial onset (i.e. 300 ms before the target RT). During the experiment, stop-signal onset time was adjusted in steps of 25 ms for each stop-signal probability level separately, depending on the stopping performance. Specifically, if stopping was successful on the previous stop trial within a probability level, then stopping was made more difficult by shifting the stop-signal onset time 25 ms toward the target RT. This process was reversed when stopping failed. This staircase procedure ensures roughly equal numbers of successful and unsuccessful stop trials.
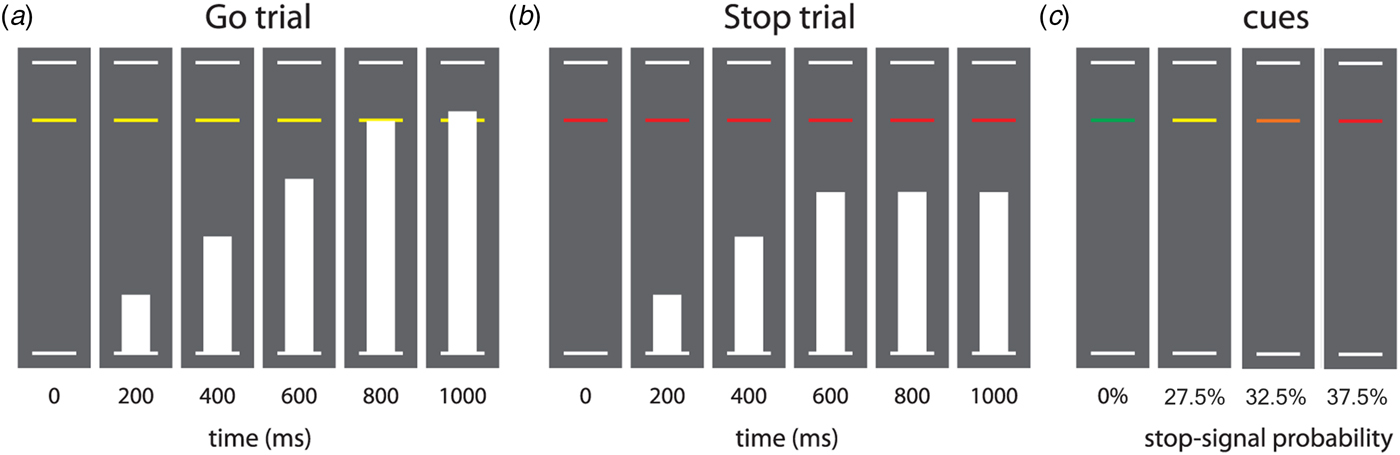
Fig. 1. Task design of the stop-signal anticipation task. Note: Three horizontal lines formed the background displayed continuously during the task. (a) In each trial, a bar moved at constant speed from the bottom up, reaching the middle line in 800 ms. The main task was to stop the bar as close to the middle line as possible by pressing a button with the right index finger. These trials are referred to as go trials. (b) In a minority of trials, the bar stopped moving automatically before reaching the middle line, indicating that a response had to be stopped. These trials are referred to as stop trials. Stop-signal onset was adjusted in steps of 25 ms based on stopping performance, according to a 1-up-1-down staircase procedure (see Methods section). (c) The probability that a stop-signal would occur was manipulated across trials and was indicated by the color of the target response line. There were four stop-signal probability levels: 0% (green), 27.5% (yellow), 32.5% (orange), and 37.5% (red). Caption and figure (with minor modifications) reprinted with permission from Zandbelt & Vink (Reference Zandbelt and Vink2010).
We explained the SSAT to the children in a storyline format. We told them that the first objective was to ensure a soft landing of the spaceship. To achieve this, children were asked to stop the bar as close to the target line as possible (go trial). The second objective was to cancel a landing if circumstances became too dangerous. To achieve this, children were asked to withhold the button press whenever the bar stopped before it reached the target line (stop trial). We instructed the children that a green line indicated that the bar would never be stopped before the target line, a yellow line represented ‘occasionally’, an orange line represented ‘sometimes’, and a red line indicated ‘quite often’. We instructed children that the go and stop trials were equally important and that it would not always be possible to suppress a response when a stop signal occurred. Furthermore, we did not give children any instructions on how to adapt their task strategy in response to this information. All participants performed three practice levels (of respectively 30, 60, and 161 trials) to get acquainted with the paradigm.
A basic differentiation could be made between two types of trials: baseline go trials (stop-signal probability = 0%) and uncertain go and stop trials (stop-signal probability >0%). Uncertain go and stop trials occurred with three different stop probabilities (27.5%, 32.5%, and 37.5%). Mean RT, standard deviations of response times (SDRT), and OMISS were computed separately for certain go trials and for uncertain go trials (pooled across stop-signal probability conditions). SSRT was computed using the integration method (Logan & Cowan, Reference Logan and Cowan1984). We first computed the SSRT of the separate conditions and then pooled them using a weighted mean of the three conditions. To test the basic assumptions of the SST, mean RT of stop failure trials (stop-failure RT) and percentage stop accuracy were computed pooled across all stop-signal probability conditions.
Statistical analyses
According to the race model, a stop-failure RT occurs when the go process finishes before the stop process (i.e. the go process escapes inhibition). As a result, a prediction of the model is that stop-failure RT is shorter than go RT. We tested this prediction for each group separately using a paired samples t test. Second, we tested whether the staircase procedure had indeed produced 50% stop accuracy across all stop-signal probabilities using a one-sample t test.
We tested for an effect of diagnosis on SSRT, RTcertain-go, RTuncertain-go, SDRTcertain-go, SDRTuncertain-go, OMISScertain-go, OMISSuncertain-go, using analysis of covariance (ANCOVA) including age as a covariate. Post hoc testing was applied as appropriate. Proactive inhibition was operationalized as within-subject slowing of RT with increasing stop-signal probability. We quantified this using repeated measures ANCOVA with stop-signal probability as within-subject factor, diagnosis as between-subject factor, and age as covariate. We used Mauchly's test for sphericity. If the assumption of sphericity was not met, the Greenhouse–Geisser correction was applied, resulting in corrected degrees of freedom. In addition, we tested for an association between ADHD symptoms (i.e. SWAN subscale scores) and all outcome measures. We used multiple ANCOVAs with task performance as the dependent variable and age and ADHD symptom scores as covariates. If no between-group differences were found in the between-group analyses, we tested this on the entire sample. For measures that did show between-group differences, we tested within clinical (i.e. ADHD and ASD) and comparison groups separately. Again, age was included as a covariate. In all ANCOVA analyses, we tested the assumption of homogeneity of regression slopes by testing for an interaction effect between group and age. If this assumption was met, the non-significant interaction effect was left out of the final model. Results were corrected for multiple comparisons using a false discovery rate (FDR) correction on the multiple ANCOVA results (per task performance measure) using the Benjamini–Hoghberg procedure (Benjamini & Hochberg, Reference Benjamini and Hochberg1995).
All outcome measures except SSRT were not distributed normally. ANCOVA is fairly robust for deviations from normality, especially when group sizes are approximately equal (Schmider et al. Reference Schmider, Ziegler, Danay, Beyer and Bühner2010). Therefore, we chose to report ANCOVA results and provide a supplement (see online Supplementary Table S1) with additional non-parametric (Kruskal–Wallis) analyses. These analyses did not include age as a covariate. All reported results were replicated in the non-parametric analyses. Lastly, we performed a post hoc repeated measures ANOVA with omission rates for certain and uncertain go trials as repeated measures and group status as factor. An increased omission rate on uncertain go trails would further indicate that children proactively adjust their response thresholds.
Results
Questionnaire data
ANOVA indicated between-group differences on the hyperactivity/impulsivity and inattention scales of the SWAN (see Table 1). Post hoc testing showed that both ADHD symptom groups had lower scores (i.e. more symptoms of ADHD) on the SWAN subscales than typically developing children. Mean scores for both ADHD symptom groups translated to ‘somewhat below average’ (between −1.36 and −1.02) on both scales; and ‘average’ scores on both scales (0.27 and 0.36) for typically developing children. Notably, we found no difference between children with ADHD and children with ASD and symptoms of ADHD for either inattention or hyperactivity, although only subclinical scores of inattention were an inclusion criterion. The range of plus and minus two standard deviations roughly translates to scores between ‘far below average’ (−2.57) and ‘average’ (0.18) for both ADHD symptom groups; and between ‘somewhat below average‘(−0.87) to above average (1.50) for typically developing children.
Model assumptions
We first tested the assumptions underlying the stop-signal paradigm for each group separately. As expected, in each group, mean RT were shorter on stop-failure trials than on uncertain go trials (see online Supplementary Table S2). Stop accuracy did not differ from 50% for typically developing children and children with ASD and symptoms of ADHD. In children with an ADHD diagnosis, we found a mean stop accuracy of 48.9% (see online Supplementary Table S3). This difference was significant, but not considered a substantial violation of model assumptions.
Response time measures
We found main effects of group and age on the SDRT in both conditions (certain-go and uncertain-go), and on the OMISS in both conditions (see Table 2 for descriptive and inferential statistics). We found no group by age interactions. Post hoc analyses showed higher SDRT and more omission errors in both clinical groups compared to typically developing children, independent of age. We found no group differences in RTcertain-go and RTuncertain-go.
Table 2. ANCOVA results for task performance – reactive inhibition

s.d., standard deviation; ADHD, attention-deficit/hyperactivity disorder; ASD, autism spectrum disorder; RT, mean response time; SDRT, standard deviation of response times; OMISS, percentage of omission errors; SSRT, stop-signal reaction time; SSD, stop-signal delay.
a Significant after FDR correction.
Inhibition measures
For reactive inhibition, we found group differences and a main effect of age on SSRT (see Fig. 2 and Table 2 for detailed results). We found no group by age interactions. Post hoc analysis showed longer SSRTs in both clinical groups than in typically developing children. For proactive inhibition, we found a within-subject main effect of stop-signal probability on mean RT (F (2.71,271) = 57.92, p < 0.001), where an increase in stop-signal probability was associated with proactive slowing of RT (see online Supplementary Fig. S1). However, we found no group by stop-signal probability interaction and thus no evidence for differential proactive inhibition between groups (F (5.43,271) = 1.25, p = 0.285). Further, in order to test another proxy measure of proactive inhibition, we performed a post hoc repeated measures ANOVA with omission rates for certain and uncertain go trials as repeated measures, and group status as factor. We found a main within-subject effect of certainty on omission errors, with higher omission rates in uncertain go trials (F (1,100) = 12.44, p = 0.001) indicating proactive inhibition across all children. We found no interaction effect with group and hence no indication for group differences in proactive inhibition.
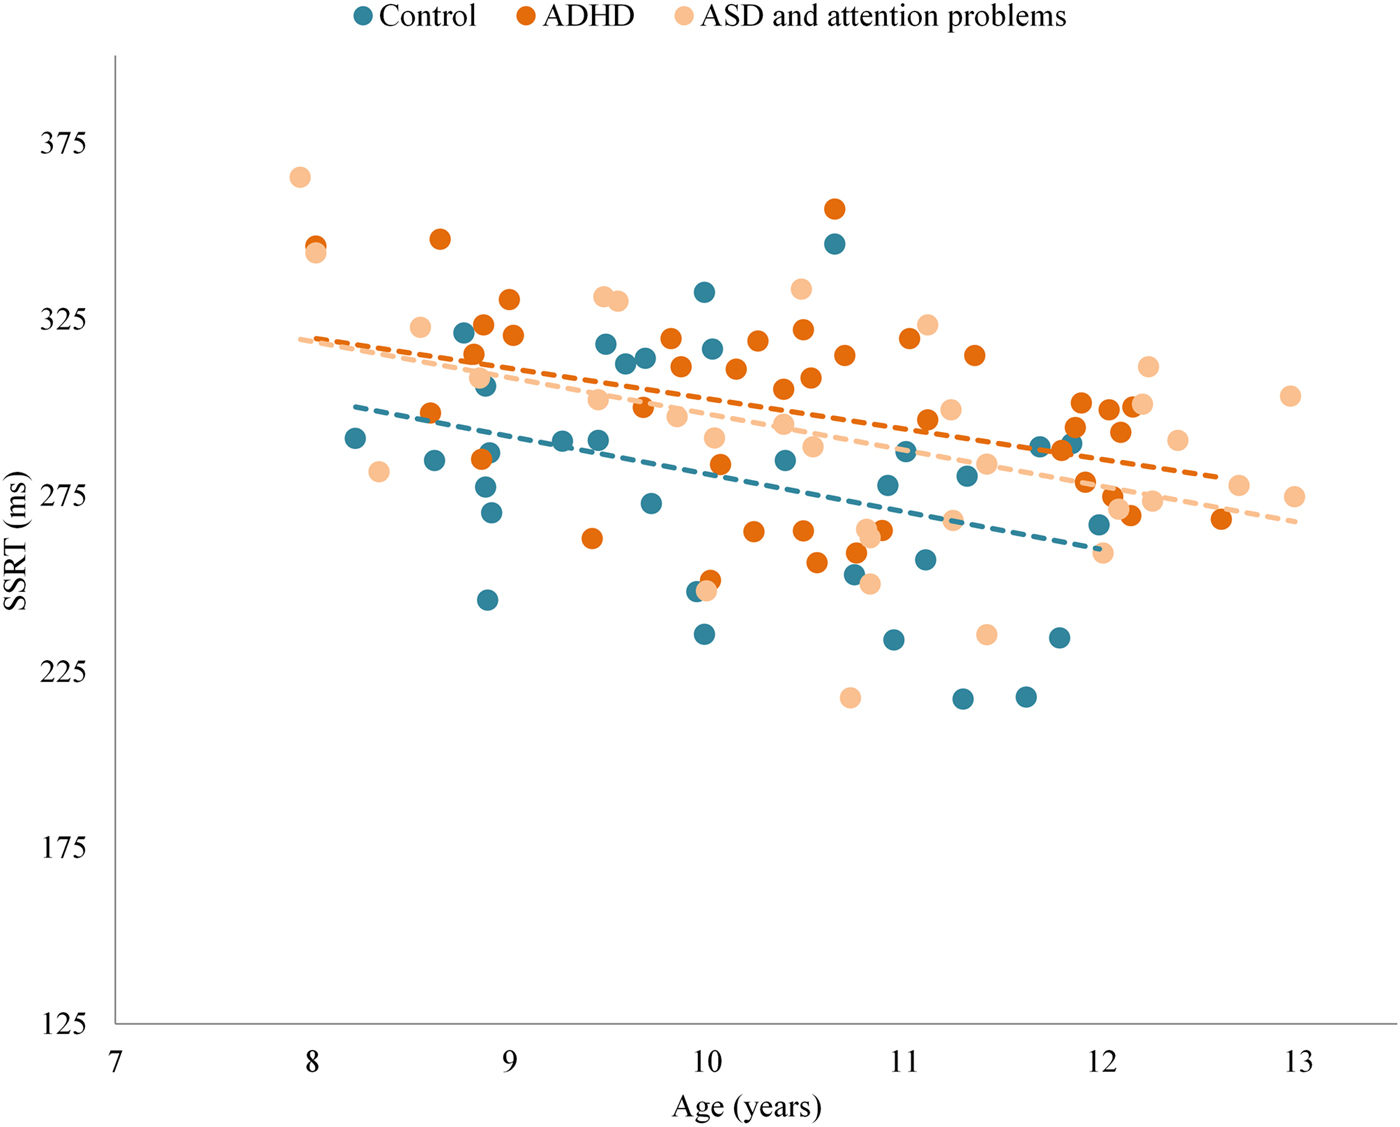
Fig. 2. Group differences in reactive inhibition across the age range. ADHD, attention-deficit/hyperactivity disorder; ASD, autism spectrum disorder; SSRT, stop-signal reaction time; ms, milliseconds.
Within-group effect of ADHD symptoms
We found no association between measures of task performance and attention problems (SWAN attention problems subscale) or hyperactivity/impulsivity (SWAN hyperactivity/impulsivity subscale). We tested this separately in the combined clinical group (ADHD and ASD with ADHD symptoms) and in the comparison group. In typically developing children, the association between attention problems and SSRT (F (1,29) = 4.43, p = 0.044) was nominally significant, but this did not survive FDR correction for multiple comparisons. For those performance measures that did not show between-group differences in the initial ANCOVA, the effect of ADHD symptom scores on task performance was tested across all groups. In this analysis, we found no association between the subscales of the SWAN and RTcertain-go, RTuncertain-go or the within-subject main effect of stop-signal probability on mean RT (i.e. proactive inhibition).
Discussion
We used a modified SST to disentangle proactive inhibition (strategic response slowing) and reactive inhibition (outright stopping) in ADHD. We replicated the well-documented finding of poorer reactive inhibition in children with ADHD compared with typically developing children. In addition, we found this inhibitory deficit in children with ASD and a similar level of ADHD symptoms. We found no evidence for a deficit in proactive inhibition in either clinical group.
Markedly, we found deficits in reactive inhibition (i.e. increased SSRT) in children with ADHD in a task that involves timed as opposed to speeded responding. Possibly as a result of these timed responses, we found no evidence for differences in mean RT on go trials between children with ADHD and typically developing children. This argues against suggestions that increased RT may confound changes in SSRT in ADHD (Alderson et al. Reference Alderson, Rapport and Kofler2007).
The standard SST assesses reactive inhibition only (Zandbelt & Vink, Reference Zandbelt and Vink2010; Aron, Reference Aron2011; Zandbelt et al. Reference Zandbelt, Bloemendaal, Neggers, Kahn and Vink2013). To facilitate a distinction between proactive and reactive processes, a task-based manipulation of proactive inhibition was developed by Zandbelt & Vink (Reference Zandbelt and Vink2010). They found that, without any explicit instructions, healthy adults slowed their responses when stop-signal probability increased (Zandbelt & Vink, Reference Zandbelt and Vink2010; Zandbelt et al. Reference Zandbelt, van Buuren, Kahn and Vink2011). Here, we replicated this finding in children, showing a similar effect of proactive inhibition overall. However, we found no evidence for a deficit in proactive inhibition in children with symptoms of ADHD. We did find decreased accuracy on uncertain go trials compared with certain go trials, perhaps further indicating proactive slowing as children adjusted their response thresholds to specific go trials. This could be further investigated using more elaborate methods such as diffusion models in studies specifically designed to this purpose (e.g. Verbruggen & Logan, Reference Verbruggen and Logan2009).
Thus, children with symptoms of ADHD did seem to engage a response set where they anticipated infrequent stop trials, yet they still showed reduced inhibitory processing. Deficits in response inhibition in children with ADHD have been shown before with a relatively high degree of consistency (Lijffijt et al. Reference Lijffijt, Kenemans, Verbaten and van Engeland2005; Alderson et al. Reference Alderson, Rapport and Kofler2007; Lipszyc & Schachar, Reference Lipszyc and Schachar2010). Response inhibition is an operationalization of cognitive control and it has been theorized that changes in cognitive control may be one of multiple, separable neurobiological pathways that can lead to symptoms of ADHD (Sonuga-Barke, Reference Sonuga-Barke2002, Reference Sonuga-Barke2003, Reference Sonuga-Barke2005; Nigg et al. Reference Nigg, Willcutt, Doyle and Sonuga-Barke2005; Durston et al. Reference Durston, van Belle and de Zeeuw2011). Deficits in reactive inhibition have been suggested to be mediated by a neurobiological deficit in the hyperdirect pathway of motor control (including right inferior frontal gyrus, subthalamic nucleus and globus pallidus pars interna) subserving fast, global motor inhibition (Nambu et al. Reference Nambu, Tokuno and Takada2002; Frank et al. Reference Frank, Samanta, Moustafa and Sherman2007; Aron, Reference Aron2011). Alternatively, this deficit could be due to impairments in attentional processing that manifest when multiple signals (go and stop) are processed in parallel. Attentional lapses could also affect task performance in children with (symptoms of) ADHD (Sonuga-Barke & Castellanos, Reference Sonuga-Barke and Castellanos2007). In line with other studies (Willcutt et al. Reference Willcutt, Doyle, Nigg, Faraone and Pennington2005; Metin et al. Reference Metin, Roeyers, Wiersema, van der Meere and Sonuga-Barke2012), we found an increase in omission errors in children with (symptoms of) ADHD, that may be suggestive of attentional lapses. In the SSAT, these attentional lapses result in better stopping performance (i.e. SSRT), as lapses during stop trials inevitably result in correct stop trials. If this is the case, the attenuated response inhibition that we found could be an underestimation of the true effect.
Meta-analytical studies have also confirmed deficits in response inhibition in children with ASD (Geurts et al. Reference Geurts, van den Bergh and Ruzzano2014). In line with these studies, we did not find deficits in reactive inhibition to be specific to children with a primary diagnosis of ADHD. Children with similar levels of parent-rated ADHD symptoms but a primary diagnosis of ASD showed similar deficits in reactive inhibition. We hypothesized that if an inhibitory deficit was found across both clinical groups, inhibitory performance was likely to be related to ADHD symptoms in a dimensional way. Such a linear relationship has previously been reported in population-based studies (Tillman et al. Reference Tillman, Thorell, Brocki and Bohlin2007; Crosbie et al. Reference Crosbie, Arnold, Paterson, Swanson, Dupuis and Li2013). Surprisingly we found no such trans-diagnostic relationship within our clinical groups. One possible explanation may be that the linear relationship does not hold for the extreme ends of the distribution. As an example, a diathesis-stress model of nature–nurture interactions could imply that above a certain threshold of inhibitory problems, environmental factors have more impact on the expression of ADHD symptoms than inhibitory problems themselves (Monroe & Simons, Reference Monroe and Simons1991; Belsky & Pluess, Reference Belsky and Pluess2009). Another explanation could be that different neurobiological mechanisms lead to reduced inhibitory control in either group (i.e. ADHD and ASD).
In this study, we were able to dissociate reactive and proactive inhibition. However, we did not dissociate reactive inhibition from attentional switching. Psychophysiological measures such as event-related potentials have been used to disentangle different aspects of response inhibition as measured by the stop-signal paradigm (Kenemans, Reference Kenemans2015). Because of the high temporal resolution of EEG, distinctions can be made between different phases of processing. These studies point toward a deficit in the switching of attention to the stop signal as a possible cause for inhibitory problems (Bekker et al. Reference Bekker, Overtoom, Kooij, Buitelaar, Verbaten and Kenemans2005; Kenemans et al. Reference Kenemans, Bekker, Lijffijt, Overtoom, Jonkman and Verbaten2005; Verbruggen et al. Reference Verbruggen, Aron, Stevens and Chambers2010). One could even argue that as per definition reactive inhibition is a task of attentional switching.
In sum, we found evidence for a deficit of reactive inhibition in children with ADHD symptoms in the absence of evidence for deficits in proactive inhibition. These findings re-emphasize the role of reactive inhibition as a separable neuropsychological domain that is affected in children with ADHD. Moreover, our findings in children with ASD and symptoms of ADHD stress the importance of a trans-diagnostic approach to the relation between behavior and neuropsychology.
Supplementary material
The supplementary material for this article can be found at https://doi.org/10.1017/S0033291718000107
Acknowledgements
The authors thank all children who participated in this study. The authors thank all of their parents. The authors also thank the research assistants and interns, and all the members of their team who contributed to data collection. This work was supported by a grant from the Netherlands Organization for Scientific Research (Nederlandse Organisatie voor Wetenschappelijk Onderzoek, NWO) (SD, grant number Vici-453-10-005). The funding source had no influence on study design, data analysis or the written report.
Declaration of Interest
None.
Ethical Standards
The authors assert that all procedures contributing to this work comply with the ethical standards of the relevant national and institutional committees on human experimentation and with the Helsinki Declaration of 1975, as revised in 2008.


 Open access