


1. Introduction
Be/X-ray binaries (BeXRBs) comprise the largest subset of the High Mass X-ray Binaries (Fortin et al. Reference Fortin, García, Simaz Bunzel and Chaty2023). They consist of an X-ray emitting neutron star pulsar in an (often eccentric) orbit around a Be star, that is, a non-supergiant B-type star that has shown hydrogen lines in emission. Be stars also show an excess of infrared emission, compared to a star of the same spectral type. The emission lines and infrared excess are attributed to an equatorial circumstellar disc due to material expelled from the rapidly rotating Be star. Some BeXRBs exhibit persistent X-ray emission whilst others only show such emission close to periastron, when the neutron star passes through the Be star circumstellar disc (Reig Reference Reig2011).
Here, we present the discovery of a new BeXRB, 4XMM J182531.5–144036, identified from an investigation of hard X-ray sources in the XMM-Newton serendipitous survey. The source was also detected by Chandra, so we investigate those archival observations too. In Section 2, we introduce the X-ray observations and discuss the reduction of both datasets. The timing and spectral analysis of the X-ray source is then described within Sections 3 and 4, respectively. Section 5 examines near infrared observations and the identification of the counterpart to this system, and Section 6 presents a discussion of our results.
2. X-ray observations
2.1. XMM-Newton
The field of 4XMM J182531.5–144036 was observed on the 2008 April 10 by XMM-Newton (Jansen et al. 2001) for $33.5$
ks starting at MJD 54566.76197. The target was the Wolf-Rayet star WR 115, and the source 4XMM J182531.5–144036 is located close to the edge of the field of view (see Fig. 1, left). The observation was performed using all three EPIC cameras in imaging mode; the MOS1, MOS2, and PN cameras were employed in full frame mode using a medium filter. Additionally, the Optical Monitor (OM) instrument performed optical/UV observations with the UVM2 filter.
$33.5$
ks starting at MJD 54566.76197. The target was the Wolf-Rayet star WR 115, and the source 4XMM J182531.5–144036 is located close to the edge of the field of view (see Fig. 1, left). The observation was performed using all three EPIC cameras in imaging mode; the MOS1, MOS2, and PN cameras were employed in full frame mode using a medium filter. Additionally, the Optical Monitor (OM) instrument performed optical/UV observations with the UVM2 filter.
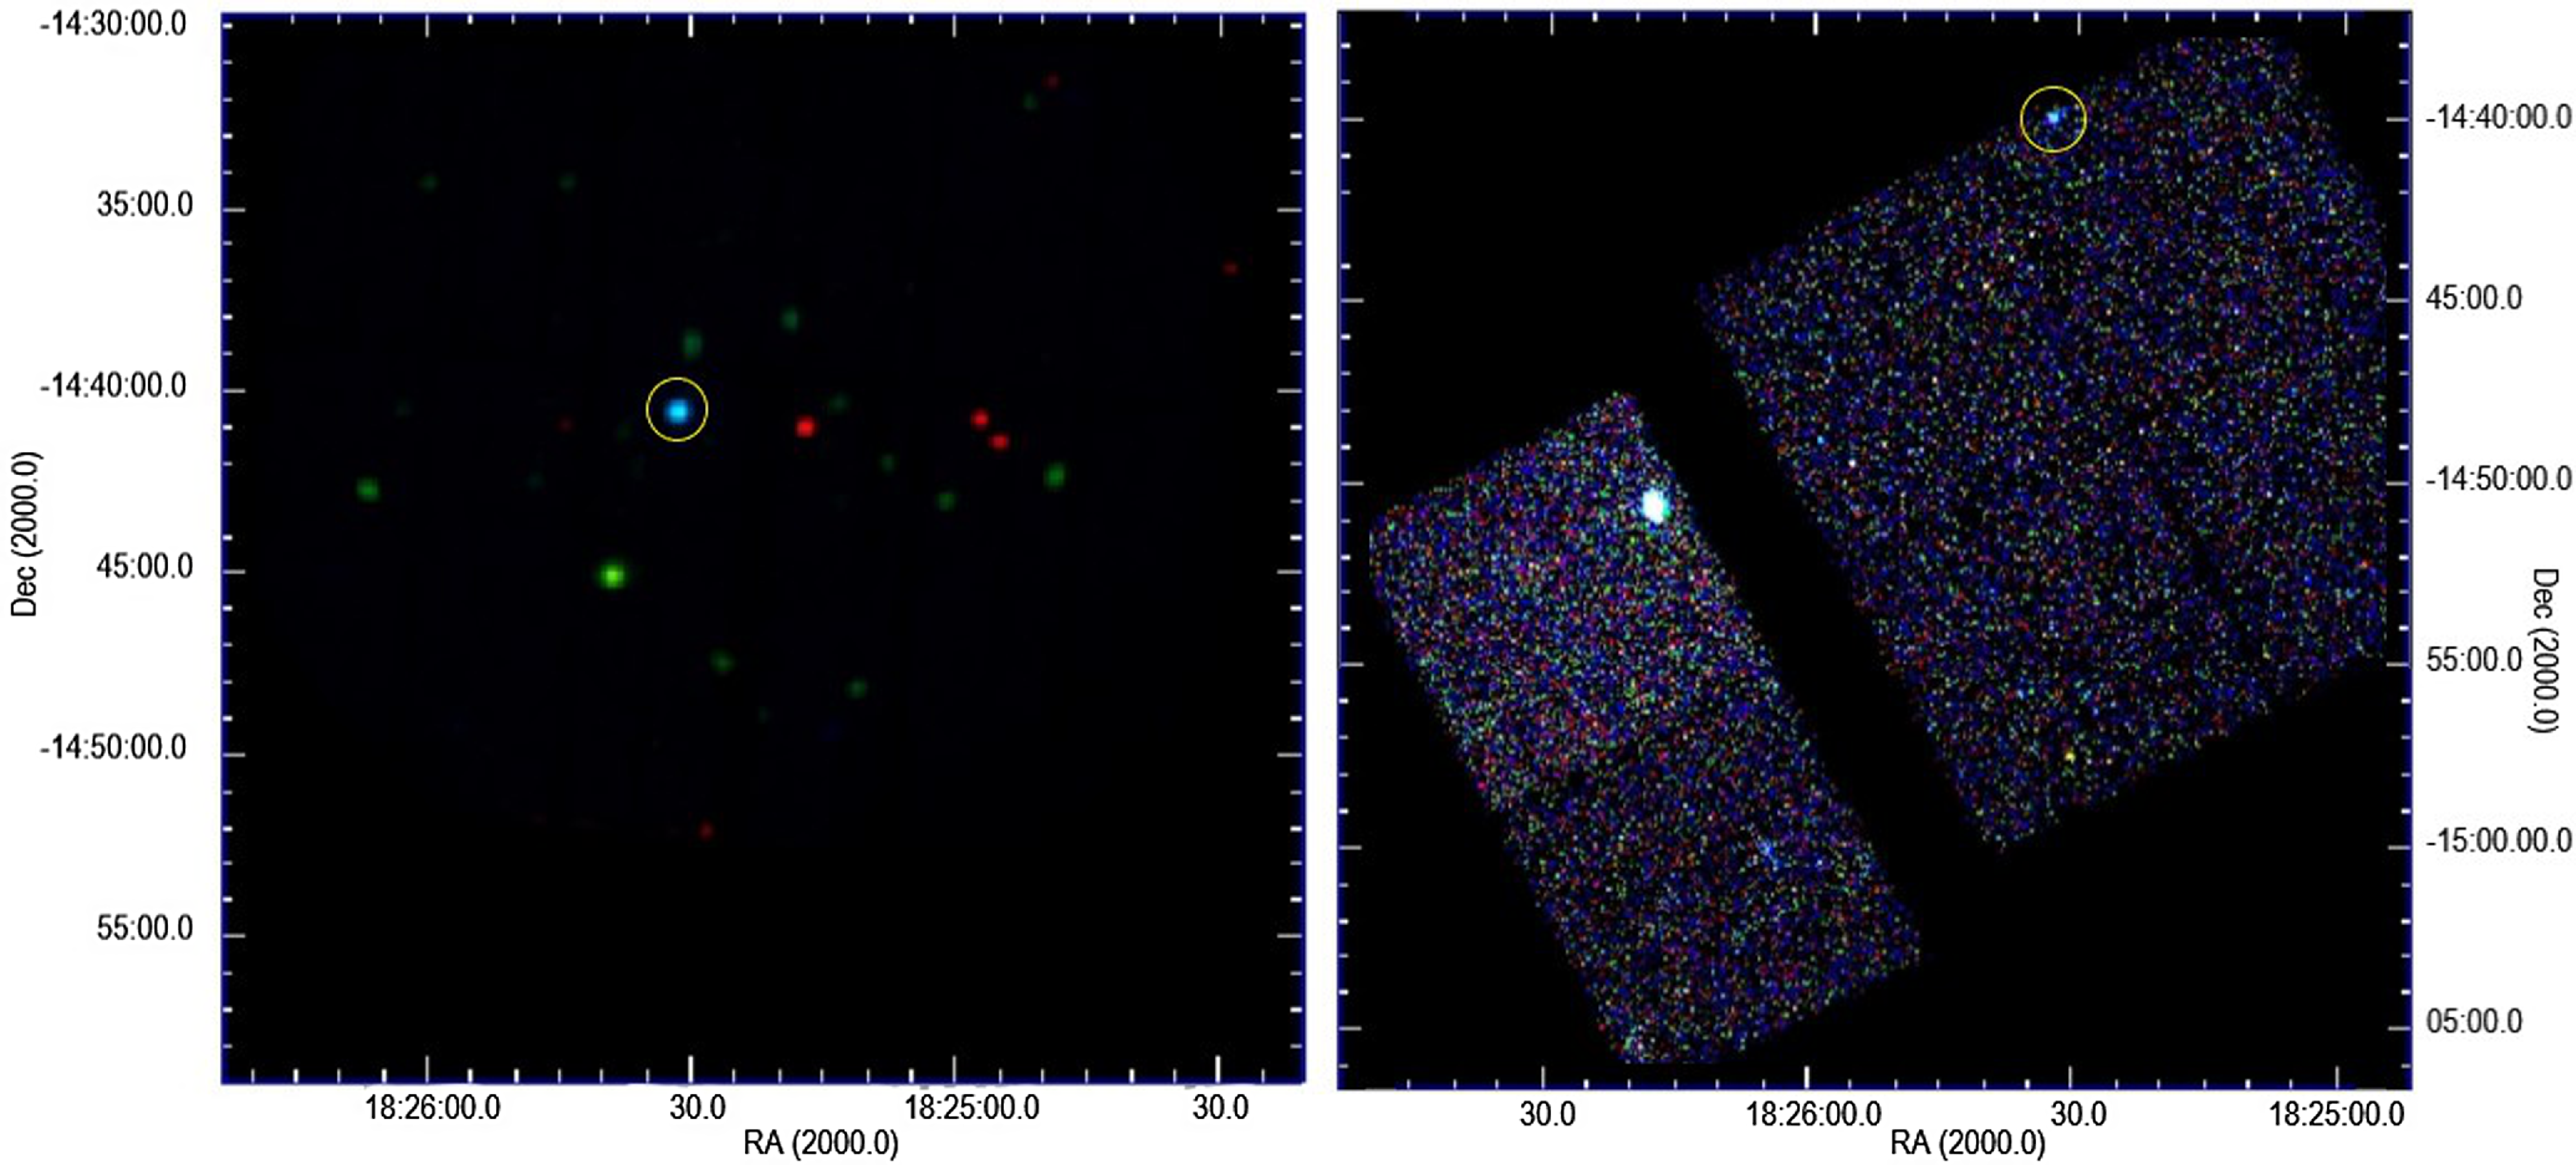
Figure 1. Left: Merged XMM-Newton EPIC RGB mosaic image (red: 0.2–1 keV, green: 1–2 keV, blue: 2–10 keV). Gaussian smoothing with a kernel radius of 3 has been applied to the image. 4XMM J182531.5–144036 is the ringed light blue source near the centre. Right: Chandra ACIS-I merged RGB mosaic image (red: 0.5–1.2 keV, green: 1.2–2.0 keV and blue: 2.0–7.0 keV. CXOU J182531.4–144036 is the ringed source at the top of the right-hand ACIS-I detector. Featured prominently on the left-hand side of the detector is the HMXB V479 Sct/LS 5039 (Hadasch et al. Reference Hadasch2012).
4XMM J182531.5–144036 was initially detected by the XMM-Newton pipeline (Watson et al. Reference Watson2009) at RA: $18^{\text{h}}$ $25^{\text{m}}$ $31.5^{\text{s}}$
and Dec:
$31.5^{\text{s}}$
and Dec: $-14^{\circ}$ $40^{\prime}$ $36.6^{\prime\prime}$
(J2000) with a positional uncertainty of
$36.6^{\prime\prime}$
(J2000) with a positional uncertainty of $1.1^{\prime\prime}$
(
$1.1^{\prime\prime}$
( $3\sigma$
). For this observation, the 2MASS catalogue was used to correct the source position, providing a reduced pointing error of
$3\sigma$
). For this observation, the 2MASS catalogue was used to correct the source position, providing a reduced pointing error of $0.35^{\prime\prime}$
. No source was detected in the OM mosaiced image within the EPIC error circle.
$0.35^{\prime\prime}$
. No source was detected in the OM mosaiced image within the EPIC error circle.
Observation Data Files (ODFs) were processed using the XMM-Newton Science Analysis System (SAS) v21.0 (http://xmm.esa.int/sas/). Event lists for each PN and MOS camera were generated using the epproc or emproc script, respectively, each employing the most recent calibration files and using default parameters. Bad events caused by cosmic rays, edge effects, and bad rows were identified and discarded. Single-event light curves were constructed for all three EPIC cameras using energies greater than 10 keV to detect any episodes of soft proton flaring that may have occurred during the observation. For each camera, a Good Time Interval (GTI) file was created to filter out these flaring episodes, with a background threshold of 1 count s $^{-1}$
for the PN and 0.3 count s
$^{-1}$
for the PN and 0.3 count s $^{-1}$
for the MOS detectors. This resulted in net exposure times after flare removal of 28.0/32.8/32.9 ks for the PN/MOS1/MOS2 cameras, respectively.
$^{-1}$
for the MOS detectors. This resulted in net exposure times after flare removal of 28.0/32.8/32.9 ks for the PN/MOS1/MOS2 cameras, respectively.
Source events were extracted for all three detectors in the energy range 0.2–10 keV using an extraction region of radius $44^{\prime\prime}$
surrounding 4XMM J182531.5–144036. Background events were also extracted from an identical sized circular region (free of any contaminating sources) and located at the same off-axis position. For the EPIC-PN spectrum and light curve, we selected single-pixel and double-pixel events; for EPIC-MOS, we used single to quadruple events. The source had EPIC PN /MOS1/MOS2 count rates of
$44^{\prime\prime}$
surrounding 4XMM J182531.5–144036. Background events were also extracted from an identical sized circular region (free of any contaminating sources) and located at the same off-axis position. For the EPIC-PN spectrum and light curve, we selected single-pixel and double-pixel events; for EPIC-MOS, we used single to quadruple events. The source had EPIC PN /MOS1/MOS2 count rates of $0.177 \pm 0.003$
/
$0.177 \pm 0.003$
/ $0.056 \pm 0.002$
/
$0.056 \pm 0.002$
/ $0.060 \pm 0.002$
counts s
$0.060 \pm 0.002$
counts s $^{-1}$
, respectively (background subtracted and corrected for vignetting and the point spread function). Images in three distinct energy bands, 0.2–1 keV (red), 1–2 keV (green), and 2–10 keV (blue), were extracted from the data and merged into a RGB mosaic (Fig. 1) to display the spectral colours. The size of the 2-d bins used in making the images was 100 pixels per bin in both x and y direction (about 5 arcsec).
$^{-1}$
, respectively (background subtracted and corrected for vignetting and the point spread function). Images in three distinct energy bands, 0.2–1 keV (red), 1–2 keV (green), and 2–10 keV (blue), were extracted from the data and merged into a RGB mosaic (Fig. 1) to display the spectral colours. The size of the 2-d bins used in making the images was 100 pixels per bin in both x and y direction (about 5 arcsec).
Source and background light curves with the maximum time resolution of 73 ms for the PN and 2.6 s for MOS1 and MOS2 were then created. To improve statistics, we re-binned the PN light curve to a resolution of 2.6 s and combined this with the MOS1 and MOS2 light curves into a single light curve. The GTIs for each camera largely overlap with each other, and all GTIs for each camera were used in the subsequent analysis. After background subtraction, the resultant light curve was barycentrically corrected using the task barycen. Background and source spectra were then extracted for each EPIC camera, together with response and ancillary response files. The spectra were not re-binned, and the full spectral resolution was retained for the subsequent spectral fitting.
2.2. Chandra
The Chandra source designated CXOU J182531.4–144036 was detected during an observation of the supernova remnant G16.85–1.05 (PI: Garmire) on 2004 July 11 for $\sim$
18 ks starting at MJD 53197.51016. The observations employed the Advanced CCD Imaging Spectrometer (ACIS-I) (Garmire et al. Reference Garmire, Bautz, Ford, Nousek, Truemper and Tananbaum2003) in wide-field imaging mode utilising chips I0 – I3 plus S2 and S3 in faint data mode. The data were reduced using CIAO v4.5 and the latest calibration files at that time (calDB 4.5.7). Initially, we reprocessed the default level 2 files using the chandra_repro script to apply the current calibration set. All processing of the data was carried out with reference to the list of current Chandra data reduction threads (http://cxc.harvard.edu/ciao/threads/).
$\sim$
18 ks starting at MJD 53197.51016. The observations employed the Advanced CCD Imaging Spectrometer (ACIS-I) (Garmire et al. Reference Garmire, Bautz, Ford, Nousek, Truemper and Tananbaum2003) in wide-field imaging mode utilising chips I0 – I3 plus S2 and S3 in faint data mode. The data were reduced using CIAO v4.5 and the latest calibration files at that time (calDB 4.5.7). Initially, we reprocessed the default level 2 files using the chandra_repro script to apply the current calibration set. All processing of the data was carried out with reference to the list of current Chandra data reduction threads (http://cxc.harvard.edu/ciao/threads/).
Selecting a circular background region with a radius of 42 $^{\prime\prime}$
from the level 2 event file, we created a light curve in the energy range 0.5–7.0 keV to ascertain the degree of flaring. No periods of flaring were detected during the full exposure time. A three-colour image of field was then constructed (see Fig. 1, right). To convert the counts detected into fluxes, we then constructed an exposure map in the energy range 0.3–8 keV with a centre-band energy of 2.3 keV.
$^{\prime\prime}$
from the level 2 event file, we created a light curve in the energy range 0.5–7.0 keV to ascertain the degree of flaring. No periods of flaring were detected during the full exposure time. A three-colour image of field was then constructed (see Fig. 1, right). To convert the counts detected into fluxes, we then constructed an exposure map in the energy range 0.3–8 keV with a centre-band energy of 2.3 keV.
To extract events in the energy range 0.2–8 keV from CXOU J182531.4–144036, we used the ChaRT and MARX programmes to calculate the radius given by 90 $\%$
of the PSF at an energy of 4.5 keV. The calculated PSF is heavily dependent on the off-axis and azimuthal angles. As the source is close to the edge of the detector, this yielded an off-axis angle
$\%$
of the PSF at an energy of 4.5 keV. The calculated PSF is heavily dependent on the off-axis and azimuthal angles. As the source is close to the edge of the detector, this yielded an off-axis angle $\theta = 8.3^{\prime}$
and azimuthal angle
$\theta = 8.3^{\prime}$
and azimuthal angle $\phi = 341.186^{\circ}$
, giving an extraction radius of
$\phi = 341.186^{\circ}$
, giving an extraction radius of $\sim$ $10^{\prime\prime}$
for a region enclosed by 90% of the PSF. For the background extraction regions, we used a circular radius of
$10^{\prime\prime}$
for a region enclosed by 90% of the PSF. For the background extraction regions, we used a circular radius of $40^{\prime\prime}$
at a similar off-axis and azimuthal angle as the source. The script specextract was used to extract source and background spectra and generate the response files. Prior to analysis, these spectra were again binned at 20 counts per bin to improve statistics. Using the script dmextract, we created a background subtracted lightcurve with a maximum time resolution of 3.2 s, before barycentrically correcting this light curve using the tool axbary.
$40^{\prime\prime}$
at a similar off-axis and azimuthal angle as the source. The script specextract was used to extract source and background spectra and generate the response files. Prior to analysis, these spectra were again binned at 20 counts per bin to improve statistics. Using the script dmextract, we created a background subtracted lightcurve with a maximum time resolution of 3.2 s, before barycentrically correcting this light curve using the tool axbary.
3. Timing analysis
3.1. Chandra
Fig. 2 displays the background subtracted light curve of CXOU J182531.4–144036. It is immediately apparent from this light curve that this source exhibits significant variability. The source was previously discussed by Muno et al. (Reference Muno, Gaensler, Nechita, Miller and Slane2008) who detected a 780-s periodic signal in the same archival Chandra data, when searching for magnetars.
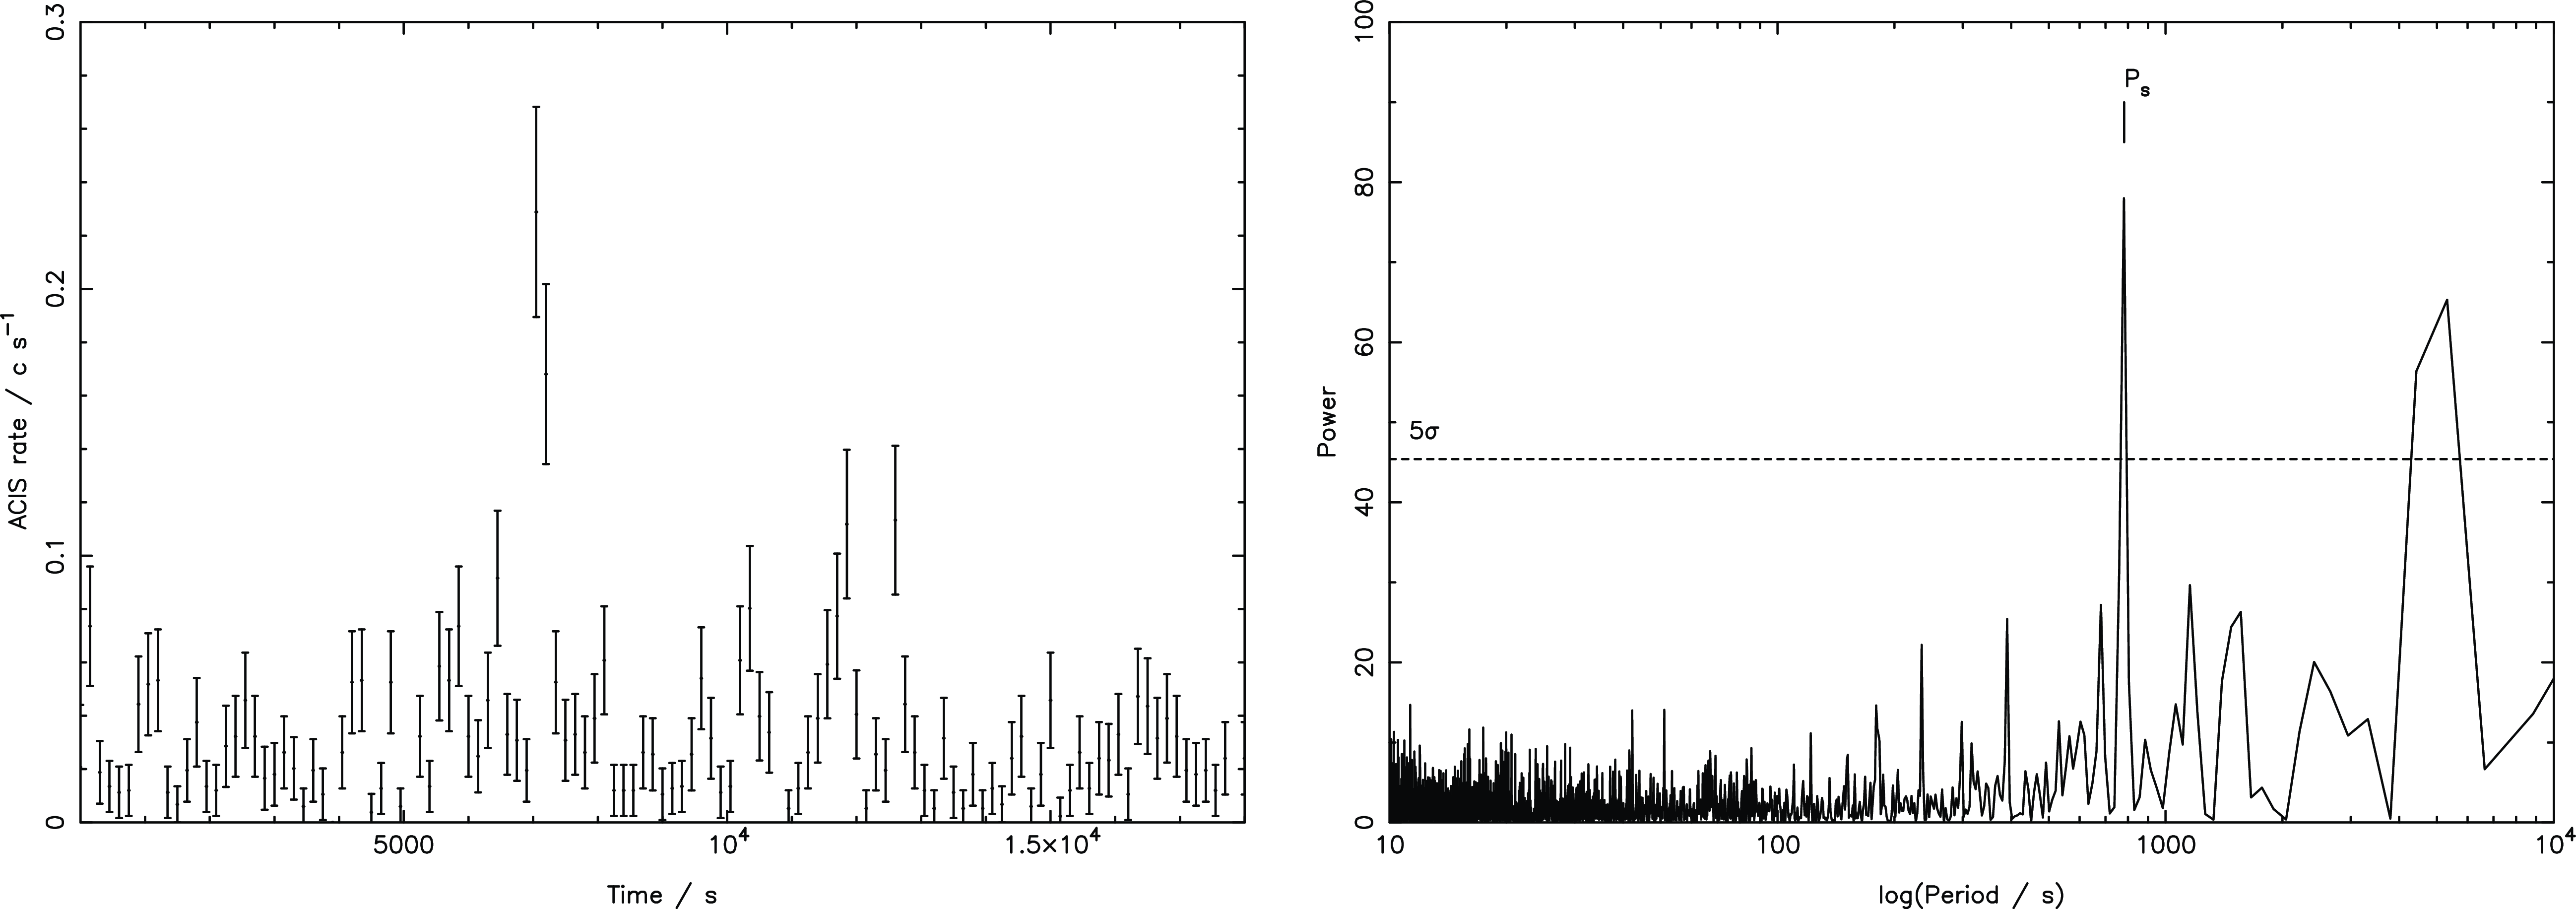
Figure 2. Left: Chandra background subtracted light curve binned at 150 s. The time axis begins at the start of the observation, at 53197.510 MJD. Right: Power spectrum of the Chandra background subtracted light curve, showing the detection of modulation at a period of 781 s. The $5 \sigma$
signal detection threshold is indicated by the dashed line.
$5 \sigma$
signal detection threshold is indicated by the dashed line.
To investigate this further, a power spectrum (Fig. 2) was generated for the 3.2 s resolution ACIS-I light curve using the Xronos tool powspec. Upon examination, it is apparent that there is a prominent peak that occurs at $\sim$
780 s and a weaker harmonic at half this period. The
$\sim$
780 s and a weaker harmonic at half this period. The $5 \sigma$
period detection threshold is indicated on the plot. To further constrain the value of the period of this source, we employed an epoch-folding period search method (Larsson Reference Larsson1996). Using the HEASOFT task efsearch, we searched for periods between 400 and 1 200 s. The resolution of the period search is defined by the Fourier Period Resolution (FPR) parameter
$5 \sigma$
period detection threshold is indicated on the plot. To further constrain the value of the period of this source, we employed an epoch-folding period search method (Larsson Reference Larsson1996). Using the HEASOFT task efsearch, we searched for periods between 400 and 1 200 s. The resolution of the period search is defined by the Fourier Period Resolution (FPR) parameter $\delta P = P^{2}/2T_{\text{obs}}$
. With
$\delta P = P^{2}/2T_{\text{obs}}$
. With $P = 780$
s and
$P = 780$
s and $T_{\text{obs}} = 18$
ks, this gives
$T_{\text{obs}} = 18$
ks, this gives $\delta P \sim 16.9$
s. To improve the likelihood of finding the best period, we overestimated the FPR by a factor of
$\delta P \sim 16.9$
s. To improve the likelihood of finding the best period, we overestimated the FPR by a factor of $\sim$
20 giving
$\sim$
20 giving $\delta P = 0.85$
s. We then used this reduced
$\delta P = 0.85$
s. We then used this reduced $\delta P$
as the period resolution of the epoch folding period search. The plot of
$\delta P$
as the period resolution of the epoch folding period search. The plot of $\chi^{2}$
versus period produced by the efsearch task shows a broad peak and fitting this with a Gaussian yielded a central value of 781 s. The uncertainty in the Gaussian central value is
$\chi^{2}$
versus period produced by the efsearch task shows a broad peak and fitting this with a Gaussian yielded a central value of 781 s. The uncertainty in the Gaussian central value is $\sim$ $0.15$
s, so the 1-
$0.15$
s, so the 1- $\sigma$
confidence level in the period is estimated as this uncertainty multiplied by the FPR overestimation factor, yielding
$\sigma$
confidence level in the period is estimated as this uncertainty multiplied by the FPR overestimation factor, yielding $\pm 3$
s. This period of
$\pm 3$
s. This period of $781 \pm 3$
s is in agreement with that found by Muno et al. (Reference Muno, Gaensler, Nechita, Miller and Slane2008). The 0.2–8 keV light curve was then phase folded in 10-phase bins over this best-fitted period, and the resulting folded light curve is shown in Fig. 3.
$781 \pm 3$
s is in agreement with that found by Muno et al. (Reference Muno, Gaensler, Nechita, Miller and Slane2008). The 0.2–8 keV light curve was then phase folded in 10-phase bins over this best-fitted period, and the resulting folded light curve is shown in Fig. 3.

Figure 3.
Chandra background subtracted light curve folded over the best fit period of 781 s. The zero phase is set at the point of minimum observed modulation. The error bars represent the 1- $\sigma$
confidence level.
$\sigma$
confidence level.
3.2. XMM-Newton
The background subtracted and combined EPIC light curve of 4XMM J182531.5–144036 is shown in Fig. 4 where it has been binned at 150 s for clarity. As with the Chandra light curve, it is apparent from Fig. 4 that this source displays a noticeable degree of variability. This combined light curve was used to construct a power spectrum in order to determine the nature of any periodic signal from the source. Fig. 4 shows the power spectrum obtained and once again the $5\sigma$
period detection threshold is indicated. The power spectrum obtained is very similar to that from Chandra in exhibiting a significant peak at
$5\sigma$
period detection threshold is indicated. The power spectrum obtained is very similar to that from Chandra in exhibiting a significant peak at $\sim$
780 s.
$\sim$
780 s.

Figure 4. Left: EPIC (PN, MOS1, and MOS2 combined) 0.2–10.0 keV background subtracted light curve binned at 150 s. The time axis indicates the time since the start of the observation at MJD 54566.761. Gaps in the light curve are the result of removing background flares. Right: Power spectrum of the EPIC background subtracted light curve. Below 1 000 s the most prominent peak in the spectrum occurs at $\sim$
780 s. The
$\sim$
780 s. The $5 \sigma$
signal detection threshold is indicated by the dashed line.
$5 \sigma$
signal detection threshold is indicated by the dashed line.
Using efsearch, we searched for a period in the same time frame as that of the Chandra source, namely between 400 and 1 200 s. Again, fitting the peak value found from the folded period search with a Gaussian, a central value of 781 s was obtained. The 1- $\sigma$
uncertainty in the period was also obtained using the method described in Section 3.1. The best-fitting period was found to be
$\sigma$
uncertainty in the period was also obtained using the method described in Section 3.1. The best-fitting period was found to be $781 \pm 2$
s. Fig. 5 shows the EPIC 0.2–10 keV light curve phase folded at this period.
$781 \pm 2$
s. Fig. 5 shows the EPIC 0.2–10 keV light curve phase folded at this period.

Figure 5. The EPIC 0.2–10 keV background subtracted light curve folded over the best-fit period. The zero phase is set at the point of minimum observed modulation. 1- $\sigma$
error bars are shown.
$\sigma$
error bars are shown.
4. X-ray spectral analysis
We extracted energy spectra for 4XMM J182531.5–144036 for all three EPIC cameras in the XMM-Newton observation and the ACIS-I camera from the Chandra observation. The spectral analysis was performed with XSPEC v.12.8.0 (Arnaud Reference Arnaud, Jacoby and Barnes1996). The four spectra were fitted simultaneously in the energy range 0.4–10.0 keV with an absorbed power law, with the hydrogen column density $N_{\text{H}}$
, photon index
$N_{\text{H}}$
, photon index $\Gamma$
, and normalisation left as free parameters. Fitting was performed using the C-stat statistic (Kaastra Reference Kaastra2017) which is appropriate for spectra with few counts per channel. The absorbed power law produced an acceptable fit and is shown in Fig. 6. The best-fit parameters are
$\Gamma$
, and normalisation left as free parameters. Fitting was performed using the C-stat statistic (Kaastra Reference Kaastra2017) which is appropriate for spectra with few counts per channel. The absorbed power law produced an acceptable fit and is shown in Fig. 6. The best-fit parameters are $N_{\text{H}} = (6.9 \pm 0.5) \times 10^{22}\,\text{atoms} \, \text{cm}^{-2}$
and
$N_{\text{H}} = (6.9 \pm 0.5) \times 10^{22}\,\text{atoms} \, \text{cm}^{-2}$
and $\Gamma = 2.2 \pm 0.2$
. There is no evidence for an iron line at 6.4 keV. The 0.2–10.0 keV unabsorbed flux from the fit is
$\Gamma = 2.2 \pm 0.2$
. There is no evidence for an iron line at 6.4 keV. The 0.2–10.0 keV unabsorbed flux from the fit is $F_{X} = (7.2 \pm 0.1) \times 10^{-12}$
erg s
$F_{X} = (7.2 \pm 0.1) \times 10^{-12}$
erg s $^{-1}$
cm
$^{-1}$
cm $^{2}$
. For the regretably unconstrained limits in distance for the source (derived from NIR photometry and the spectral classification of the counterpart, see Section 5.1) of
$^{2}$
. For the regretably unconstrained limits in distance for the source (derived from NIR photometry and the spectral classification of the counterpart, see Section 5.1) of $\sim$
1 kpc and
$\sim$
1 kpc and $\sim$
7 kpc, this corresponds to X-ray luminosities of
$\sim$
7 kpc, this corresponds to X-ray luminosities of $8 \times 10^{32}$
erg s
$8 \times 10^{32}$
erg s $^{-1}$
and
$^{-1}$
and $4 \times 10^{34}$
erg s
$4 \times 10^{34}$
erg s $^{-1}$
, respectively. We also attempted to fit the spectrum with an exponentially cutoff power law model, which is often seen in Be/X-ray binaries. However, this does not improve the fit and the resulting parameter uncertainties are even less well constrained than for the simple power law model.
$^{-1}$
, respectively. We also attempted to fit the spectrum with an exponentially cutoff power law model, which is often seen in Be/X-ray binaries. However, this does not improve the fit and the resulting parameter uncertainties are even less well constrained than for the simple power law model.
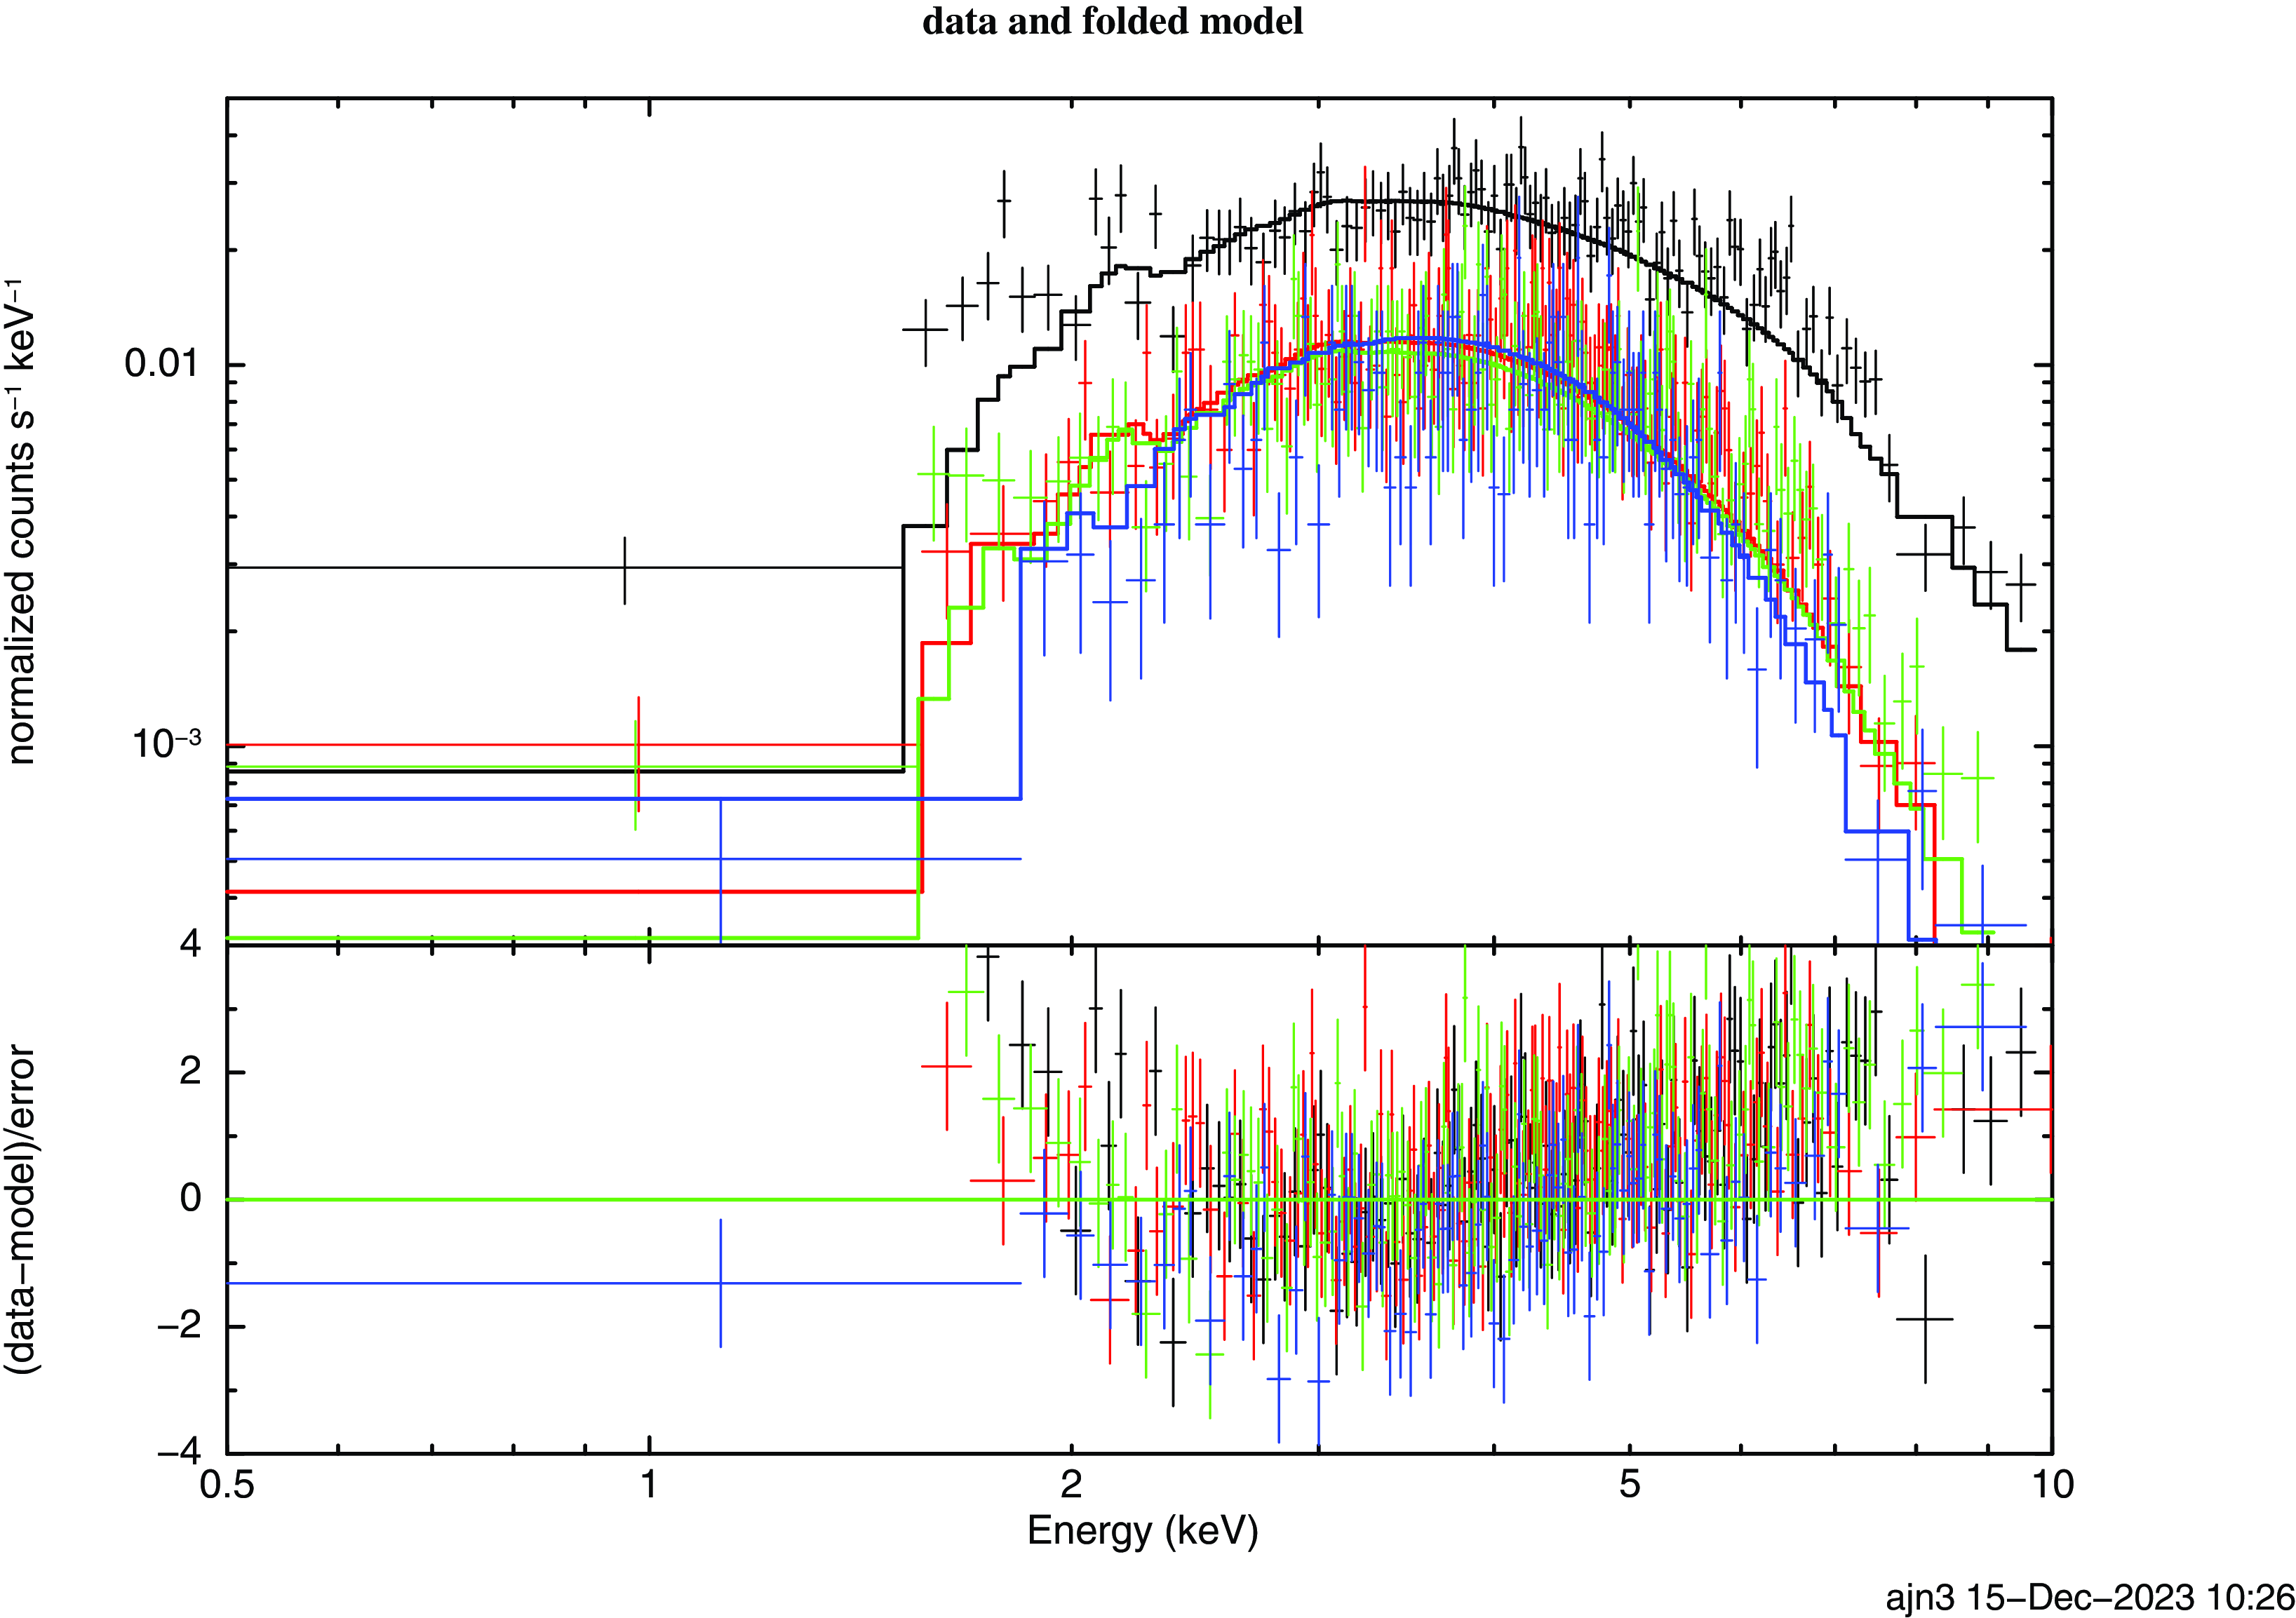
Figure 6. The combined XMM-Newton EPIC and Chandra ACIS-I spectrum of 4XMM J182531.5–144036. (top) The EPIC-PN (black), EPIC-MOS1 (red), EPIC-MOS2 (green), and ACIS-I (blue) data points together with the fitted absorbed power law model. (bottom) The residuals between the data and the best-fit model.
5. Near-infrared observations
5.1. UKIDSS photometry
To search for any possible near-infrared (NIR) counterparts to the X-ray source 4XMM J182531.5–144036, we employed the UKIDSS (UKIRT Infrared Deep Sky Survey) Galactic Plane Survey DR6 photometric data (Warren et al. Reference Warren2007) to search a region of 6 $^{\prime\prime}$
surrounding its position. There was only one candidate with UKIDSS UGPS J182531.48–144036.5 located at 0.6
$^{\prime\prime}$
surrounding its position. There was only one candidate with UKIDSS UGPS J182531.48–144036.5 located at 0.6 $^{\prime\prime}$
from the reported X-ray position. It has infrared magnitudes of
$^{\prime\prime}$
from the reported X-ray position. It has infrared magnitudes of $J=16.28$
,
$J=16.28$
, $H=14.92$
and
$H=14.92$
and $K=13.99$
, respectively.
$K=13.99$
, respectively.
Fig. 7 shows a J-band UKIDSS image of the region surrounding the position of 4XMM J182531.5–144036. The white circle represents the Chandra detected position with a 95 $\%$
confidence limit for CXOU J182531.4-144036. The red circle describes the 1-
$\%$
confidence limit for CXOU J182531.4-144036. The red circle describes the 1- $\sigma$
positional uncertainty of the source as detected by XMM-Newton. The NIR counterpart is labelled as object C.
$\sigma$
positional uncertainty of the source as detected by XMM-Newton. The NIR counterpart is labelled as object C.
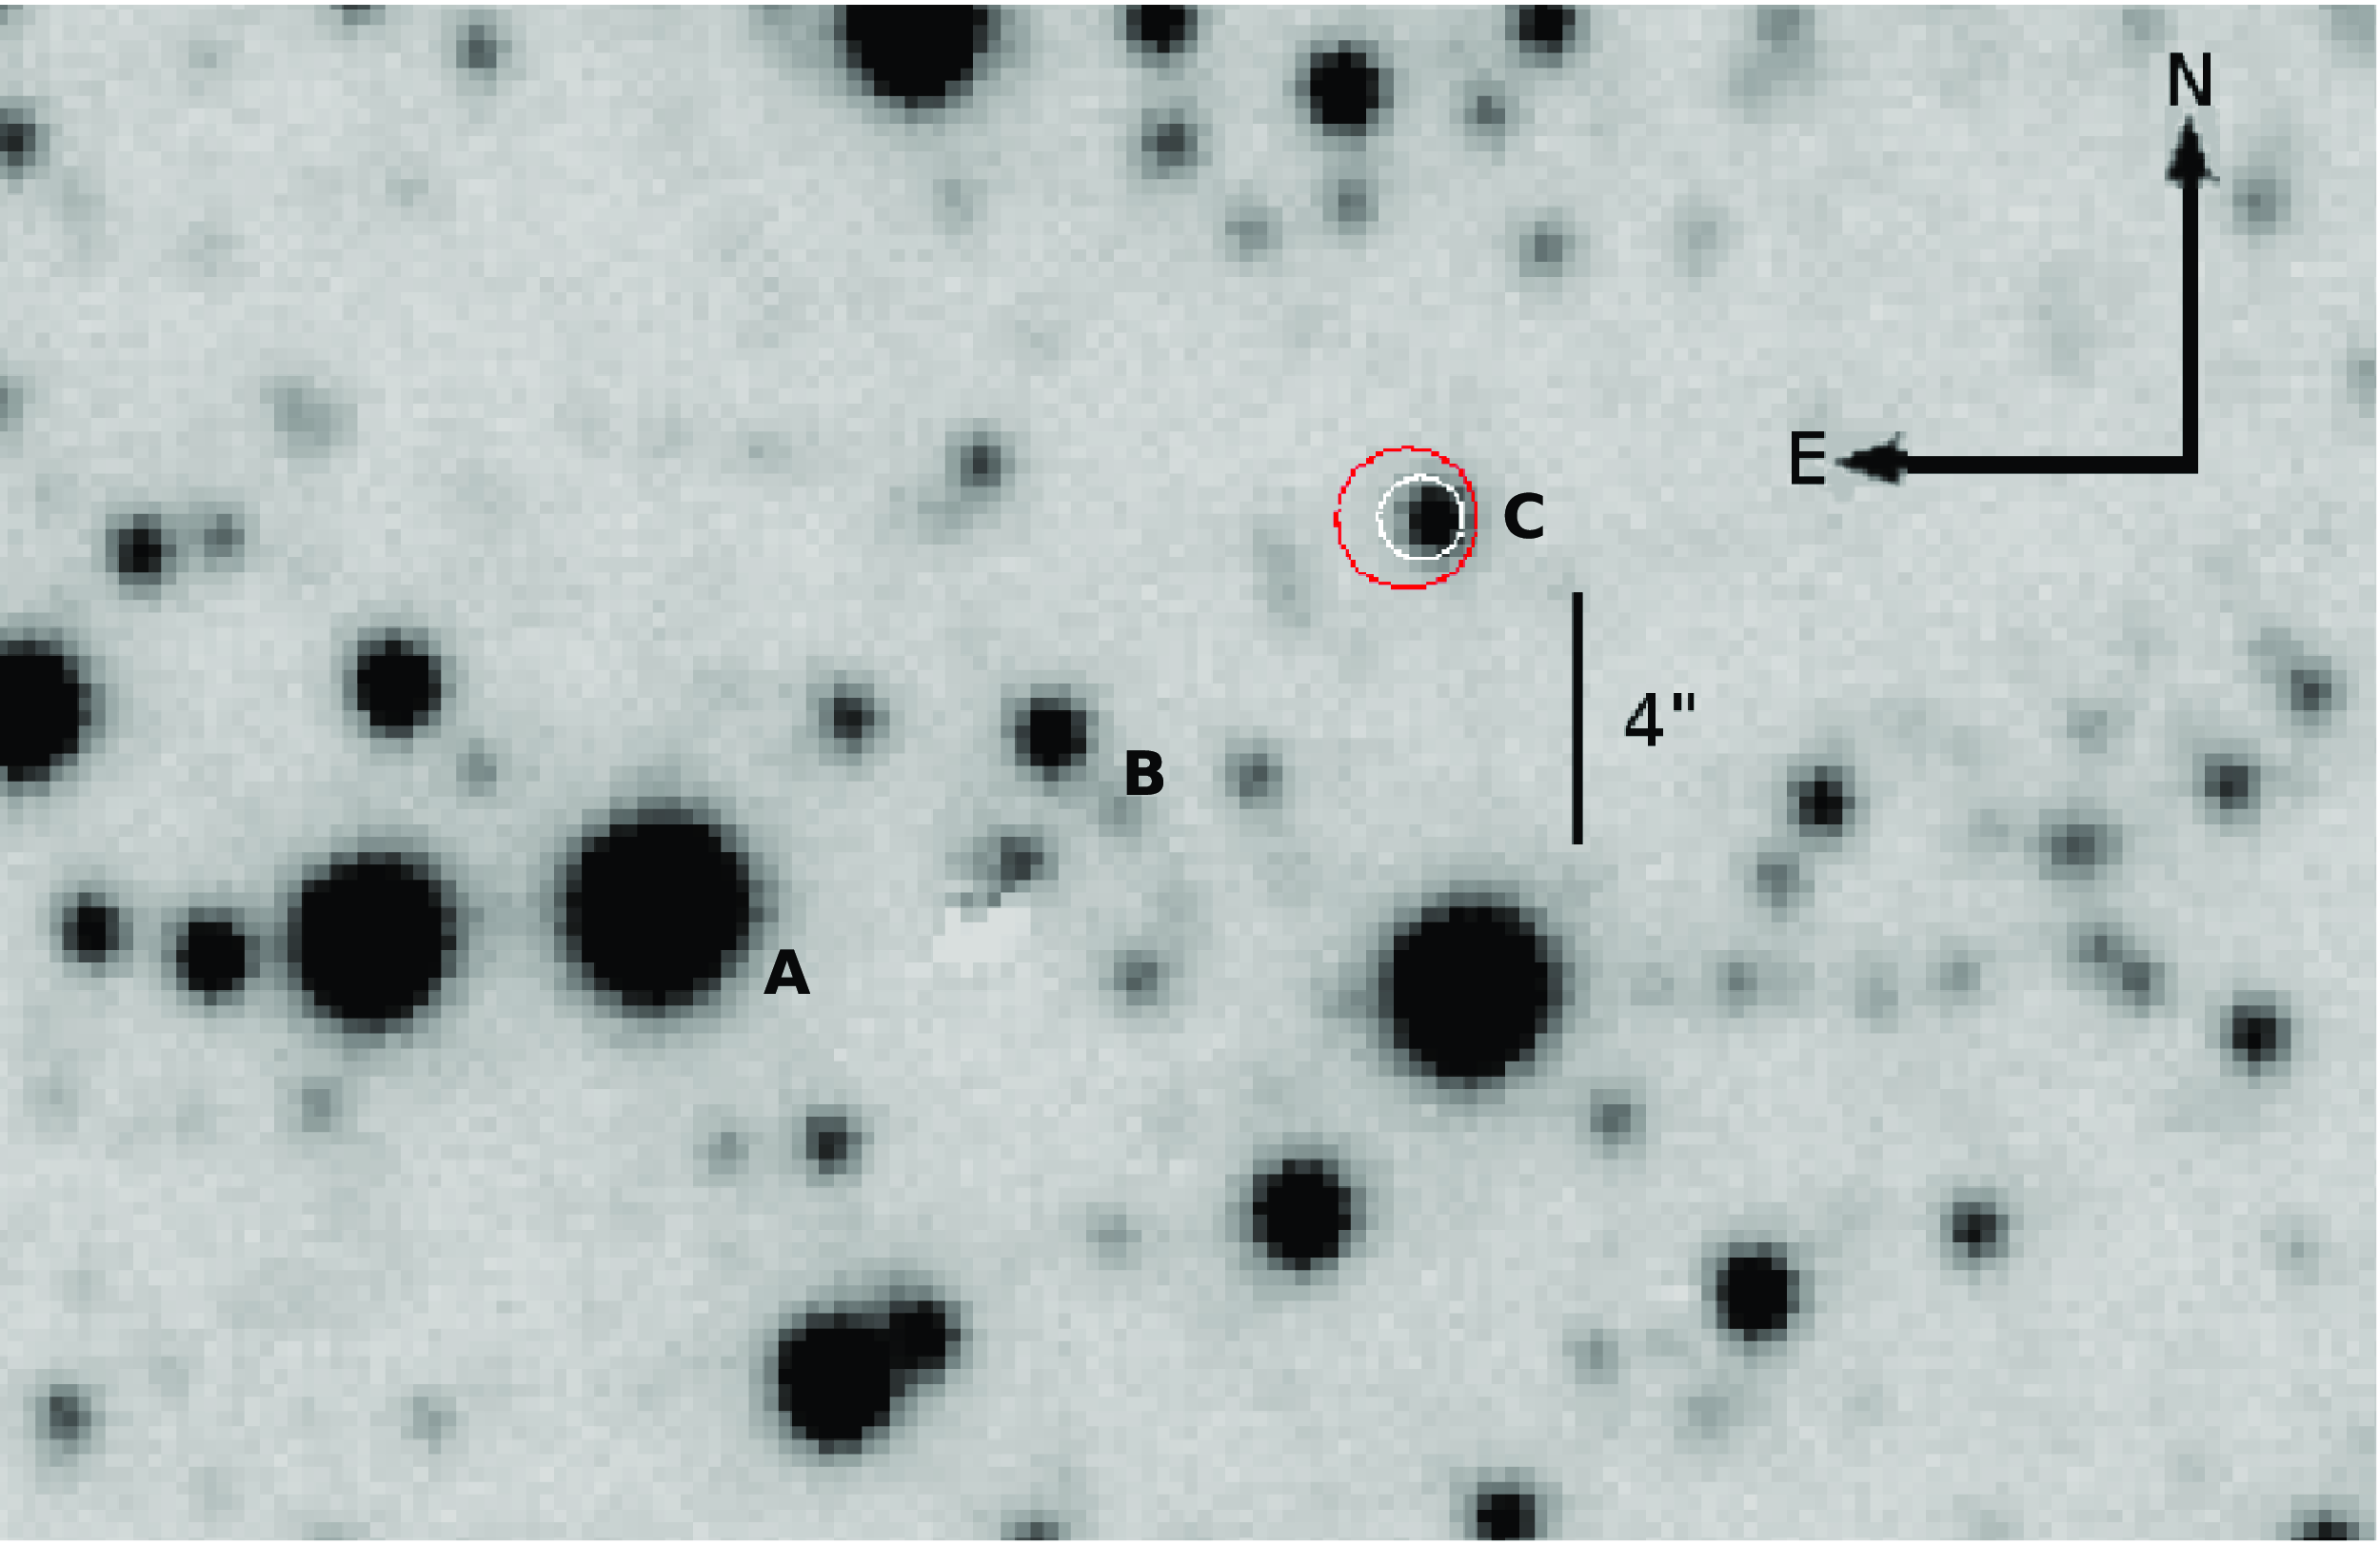
Figure 7. A $25^{\prime \prime} \times 38^{\prime \prime}$
UKIDSS J-band finding chart for 4XMM J182531.5–144036. The red circle is centred on the XMM-Newton detected position, with a radius of
$25^{\prime \prime} \times 38^{\prime \prime}$
UKIDSS J-band finding chart for 4XMM J182531.5–144036. The red circle is centred on the XMM-Newton detected position, with a radius of $1^{\prime \prime}$
equal to the positional error. The white circle is centred on the Chandra detected position and has a radius of
$1^{\prime \prime}$
equal to the positional error. The white circle is centred on the Chandra detected position and has a radius of $0.6^{\prime \prime}$
equal to its positional error.
$0.6^{\prime \prime}$
equal to its positional error.
The X-ray spectral fitting gave an equivalent hydrogen column density to the source of $N_{\text{H}} = 6.9 \times 10^{22}$
atoms cm
$N_{\text{H}} = 6.9 \times 10^{22}$
atoms cm $^{-2}$
. Assuming this to be due to interstellar material, using the relationship of Predehl & Schmitt (Reference Predehl and Schmitt1995), this implies an optical extinction of
$^{-2}$
. Assuming this to be due to interstellar material, using the relationship of Predehl & Schmitt (Reference Predehl and Schmitt1995), this implies an optical extinction of $A_V = 38.5$
mag, or in the K-band
$A_V = 38.5$
mag, or in the K-band $A_K = 4.3$
mag (Rieke & Lebofsky Reference Rieke and Lebofsky1985). Therefore, the de-reddened K-band magnitude of the counterpart may be estimated as
$A_K = 4.3$
mag (Rieke & Lebofsky Reference Rieke and Lebofsky1985). Therefore, the de-reddened K-band magnitude of the counterpart may be estimated as $K=9.7$
mag. For an assumed spectral type of O9 – B3 III – V, the absolute K-band magnitude is in the range
$K=9.7$
mag. For an assumed spectral type of O9 – B3 III – V, the absolute K-band magnitude is in the range $-4.48$
to
$-4.48$
to $-0.25$
(Blum, Conti, & Damineli Reference Blum, Conti and Damineli2000) (Martins & Plez Reference Martins and Plez2006). So the distance may be estimated as between
$-0.25$
(Blum, Conti, & Damineli Reference Blum, Conti and Damineli2000) (Martins & Plez Reference Martins and Plez2006). So the distance may be estimated as between $\sim$
1 kpc and
$\sim$
1 kpc and $\sim$
7 kpc. The object is too faint to be detected by Gaia, so we have no independent distance estimate.
$\sim$
7 kpc. The object is too faint to be detected by Gaia, so we have no independent distance estimate.
Finally, the UKIDSS JHK magnitudes of the counterpart are plotted in Fig. 8 along with Kurucz model atmosphere spectral energy distributions of O9V, B1V, and B3III stars in the range 1.0–2.2
 $${\rm{\mu }}$$
m. These are normalised to the J-band magnitude of the counterpart and show that the infrared spectrum of the candidate at wavelengths longer than 1.5
$${\rm{\mu }}$$
m. These are normalised to the J-band magnitude of the counterpart and show that the infrared spectrum of the candidate at wavelengths longer than 1.5
 $${\rm{\mu }}$$
m is far brighter than these comparison stellar types.
$${\rm{\mu }}$$
m is far brighter than these comparison stellar types.

Figure 8. The spectral energy distribution (SED) in the JHK region of the infrared counterpart to 4XMM J182531.5–144036, shown by the three asterisks. Models for the SEDs of O9V, B1V and B3III stars are shown for comparison.
5.2. ISAAC spectrum
The NIR candidate was subsequently observed with the NIR spectrograph ISAAC on the VLT on 2011 May 14 as part of a programme of follow-up infrared spectra of counterparts to 24 X-ray sources. Due to the faintness of the targets, we utilised the SW LRes mode to obtain low-resolution ( $R \sim 500$
) spectra in the K
$R \sim 500$
) spectra in the K $_{s}$
band using a
$_{s}$
band using a $0.8^{\prime\prime}$
wide slit. Nodded science spectra were obtained at a central wavelength of 2.2
$0.8^{\prime\prime}$
wide slit. Nodded science spectra were obtained at a central wavelength of 2.2
 $${\rm{\mu }}$$
m for an integration time of 2 160 s, followed by observations of the bright (K
$${\rm{\mu }}$$
m for an integration time of 2 160 s, followed by observations of the bright (K $_{s}$
= 8.5) B8V telluric standard Hip 092285 for an integration time of 10 s.
$_{s}$
= 8.5) B8V telluric standard Hip 092285 for an integration time of 10 s.
The $120^{\prime\prime}$
long slit was orientated
$120^{\prime\prime}$
long slit was orientated $130^{\circ}$
anticlockwise from North. As such two further stars, marked A and B in Fig. 7 with magnitudes
$130^{\circ}$
anticlockwise from North. As such two further stars, marked A and B in Fig. 7 with magnitudes $J = 13.23$
and
$J = 13.23$
and $J = 16.07$
, respectively, were also within the slit. The automatic ISAAC pipeline reduction process defaults to extracting the brightest spectrum in the slit, which in this case was star A (whose spectrum included multiple CO bandheads indicative of a red giant). The spectrum of the candidate counterpart C was subsequently extracted manually and is shown in Fig. 9. It displays strong emission lines corresponding to HeI (2.06
$J = 16.07$
, respectively, were also within the slit. The automatic ISAAC pipeline reduction process defaults to extracting the brightest spectrum in the slit, which in this case was star A (whose spectrum included multiple CO bandheads indicative of a red giant). The spectrum of the candidate counterpart C was subsequently extracted manually and is shown in Fig. 9. It displays strong emission lines corresponding to HeI (2.06
 $${\rm{\mu }}$$
m) and hydrogen Br
$${\rm{\mu }}$$
m) and hydrogen Br $\gamma$
(2.165
$\gamma$
(2.165
 $${\rm{\mu }}$$
m). The equivalent width of the Br
$${\rm{\mu }}$$
m). The equivalent width of the Br $\gamma$
line is
$\gamma$
line is $7.0 \pm 1.3$
Å.
$7.0 \pm 1.3$
Å.

Figure 9. NIR spectrum of the counterpart to 4XMM J182531.5–144036 obtained with ISAAC on the VLT.
6. Discussion
The infrared counterpart to 4XMM J182531.5–144036 displays a near-infrared excess when compared to the spectra of early B-type dwarf or giant stars and exhibits a strong hydrogen emission line. These features are characteristic of the Be star phenomenon. Furthermore, the presence of a coherent X-ray pulsation with a period of 781 s in both the XMM-Newton and Chandra data of 4XMM J182531.5–144036 is typical of that seen in BeXRB pulsars (Reig Reference Reig2011), while the asymmetric nature of the X-ray pulse profile is also typical of accreting X-ray pulsars and can provide information about the magnetic field structure of the neutron star (Meszaros Reference Meszaros1984). The fact that the X-ray pulsation is seen with the same profile in widely separated observations (XMM-Newton from 2008 April and Chandra from 2004 July) indicates that the X-ray emission is likely persistent. The hard X-ray spectrum, lack of an iron line, and (poorly constrained) inferred luminosity are also consistent with other wide-orbit, low eccentricity BeXRBs with relatively slow neutron star spin periods ( $>$
200 s), such as X Per (Reig & Roche Reference Reig and Roche1999). Considering the locus of BeXRB systems on the Corbet diagram Corbet diagram (Reig Reference Reig2011), we may estimate that this object has an orbital period in the range
$>$
200 s), such as X Per (Reig & Roche Reference Reig and Roche1999). Considering the locus of BeXRB systems on the Corbet diagram Corbet diagram (Reig Reference Reig2011), we may estimate that this object has an orbital period in the range $\sim$
250–500 d. We therefore conclude that 4XMM J182531.5–144036 is a newly identified persistent, long period, Be/X-ray binary.
$\sim$
250–500 d. We therefore conclude that 4XMM J182531.5–144036 is a newly identified persistent, long period, Be/X-ray binary.
Acknowledgements
This work is based on data obtained as part of the UKIRT Infrared Deep Sky Survey and on observations collected at the European Organisation for Astronomical Research in the Southern Hemisphere under ESO programme 087.D-0873(A). It also uses observations obtained with XMM-Newton, an ESA science mission with instruments and contributions directly funded by ESA Member States and NASA, and data obtained from the Chandra Data Archive and the Chandra Source Catalog, with software provided by the Chandra X-ray Center (CXC) in the application packages CIAO and Sherpa. We thank the anonymous referee for several useful suggestions.
Data availability
Not applicable.


 Open access