


1 INTRODUCTION
Star formation occurs in the densest regions of molecular clouds which undergo gravitational collapse. Therefore, studying the evolution and stability of giant molecular clouds (GMCs) allows us to investigate which processes lead to star formation. There are many theories on how a GMC can collapse and form stars, but this topic remains poorly understood. To address this question we have to look at the forces acting on clouds, such as turbulence, magnetic fields, and rotation. Zuckerman & Evans (Reference Zuckerman and Evans, II1974) and Fleck (Reference Fleck1980) propose that turbulence inside GMCs is important and stabilises the cloud against gravitational collapse, and thus star formation is indirectly related to the turbulence (Hennebelle & Chabrier Reference Hennebelle and Chabrier2011). However, Ballesteros-Paredes et al. (Reference Ballesteros-Paredes, Klessen, Mac Low and Vazquez-Semadeni2007) suggest that on smaller scales turbulence can also promote local collapse. Magnetic fields inside the cloud can delay collapse until ambipolar diffusion removes magnetic support (Shu Reference Shu, van Woerden, Allen and Burton1985), and thus magnetic fields are also important in regulating star formation (Mouschovias, Ciolek, & Morton Reference Mouschovias, Ciolek and Morton2011).
The Large Magellanic Cloud (LMC) is one of the closest galaxies to the Milky Way, at a distance 50.1 kpc (Alves Reference Alves2004). The irregular shape of the LMC is commonly attributed to the tidal force exerted on it by the Milky Way (Lin, Jones, & Klemola Reference Lin, Jones and Klemola1995), and this interaction is assumed to be the main reason for the LMC's episodic high star formation rate (Indu & Subramaniam Reference Indu and Subramaniam2011). Its metallicity is lower than the Milky Way (Westerlund Reference Westerlund1997), and it thus represents a good analogy to high redshift galaxies. Its nearby location and near face-on orientation make it an ideal galaxy to study star formation, as we can accurately map and resolve the GMCs. Previous studies have focused on local effects such as turbulence or magnetic fields inside the interstellar medium in studying cloud stability and star formation. Since the LMC's irregular shape suggests that it is tidally stressed and deformed on a galactic scale, we propose to look for potential large-scale influences on star formation: the galactic tide and shear due to differential galactic rotation.
Given their mass and size, the GMCs of the Milky Way only exceed the minimum mass for tidal stability by a factor of 3. Stark & Blitz (Reference Stark and Blitz1978) thus proposed that tidal forces can have an influence on GMC morphology. Similar conclusions were found by Blitz (Reference Blitz1985) for the GMCs in M31. Rosolowsky & Blitz (Reference Rosolowsky and Blitz2005) evaluated the tidal stability of GMCs in M64 and found them globally stable, except in the very inner part of the galaxy. Blitz & Glassgold (Reference Blitz and Glassgold1982) found that whereas atomic clouds are in tidal balance in M101, the atomic clouds in the LMC are five times less massive than necessary to resist tidal disruption, and hence their resulting lifetime could be very short, of order 107 years. Similarly, the study by Ballesteros-Paredes et al. (Reference Ballesteros-Paredes, Gómez, Loinard, Torres and Pichardo2009) concluded that the Taurus molecular cloud in the Milky Way is also suffering significant galactic tidal disruption since its tidal energy is at least three times larger than its gravitational energy.
GMCs can also be disrupted by galactic rotational shear which can tear clouds apart. Large-scale numerical simulations by Dobbs & Pringle (Reference Dobbs and Pringle2013) suggest that clouds which are very filamentary can easily be torn apart. Using a multicomponent Toomre parameter to assess large-scale effects on GMCs stability, Yang et al. (Reference Yang, Gruendl, Chu, Mac Low and Fukui2007) recently concluded that gravitational instability of the disk drives most large-scale star formation in the LMC. However, it has been demonstrated by Hunter, Elmegreen, & Baker (Reference Hunter, Elmegreen and Baker1998) and Elson, de Blok, & Kraan-Korteweg (Reference Elson, de Blok and Kraan-Korteweg2012) that a shear parameter based on the time available for perturbations to grow inside the GMCs is a more efficient way to identify regions of nearby galactic disks that are actively star-forming.
The main purpose of this paper is to investigate if galactic tidal and shear effects in the LMC can influence GMC stability and star formation. We use the Magellanic Mopra Assessment dataset, which was a high angular resolution 12CO (J = 1-0) mapping survey of the Magellanic Clouds using the 22-m Mopra TelescopeFootnote 1 . This survey (Hughes et al. Reference Hughes2010; Wong et al. Reference Wong2011) targeted initially the brightest clouds of the NANTEN survey (Fukui et al. Reference Fukui2008) to study the basic properties of giant molecular clouds. One of the main results of this survey is that most massive GMCs are associated with luminous young stars, but the limited sensitivity of the survey and lack of knowledge about stellar ages have prevented the determination of a characteristic GMC lifetime. Moreover, Wong et al. (Reference Wong2011) found no correlation between the virial parameter—the ratio of a cloud's kinetic to self-gravitational energy—of LMC GMCs and the presence of young stellar objects, suggesting there may not be a connection between the global stability of a GMC and its level of star-formation activity. In this work, we start by defining the shear parameter and tidal stability, and then calculate their effects on the GMCs for a range of possible LMC rotation curves. Then we investigate the stability state of the GMCs and search for correlations between cloud properties such as velocity dispersion, morphology, position in the galaxy, and their stability state. Finally, we discuss the potential link between shear, the galactic tide, and star formation in the LMC.
2 GMC STABILITY IN THE GALACTIC POTENTIAL
In this section, we describe the two methods that we use to assess the stability of GMCs. Both are large-scale dynamical effects describing the interaction between GMCs and the overall galactic potential.
2.1 The effect of shear
2.1.1 Physical interpretation
To characterise the impact of differential rotation on the stability of GMCs against gravitational collapse, the Toomre parameter is commonly used. It quantifies the competition between self-gravity, pressure, and coriolis forces experienced by a cloud. However, to correctly trace the stability against shear and compare it with star formation activity, one must often derive a multicomponent Toomre parameter which includes the effects of the stellar potential (Yang et al. Reference Yang, Gruendl, Chu, Mac Low and Fukui2007) or even the dark matter potential (Elson et al. Reference Elson, de Blok and Kraan-Korteweg2012), plus the gas potential.
Hunter et al. (Reference Hunter, Elmegreen and Baker1998) point out that the coriolis force assuming angular momentum conservation can be overestimated since angular momentum is expected to be carried away by the magnetic field. They instead propose to use another quantity called the shear parameter: the idea is to evaluate the time available for perturbations to collapse in the presence of local rotational shear due to the global rotation of the galaxy. The shear parameter value can differ from the Toomre parameter from −12% for a flat rotation curve to −50% for a slow rising rotation curve. Elson et al. (Reference Elson, de Blok and Kraan-Korteweg2012) recently showed that using the shear parameter can better trace the star formation activity in the inner part of the dwarf galaxies NGC 2915 and NGC 1705 than a more complex multicomponent gas + star Toomre criterion.
2.1.2 Shear parameter Sg
Following the work of Dib et al. (Reference Dib, Helou, Moore, Urquhart and Dariush2012) and Hunter et al. (Reference Hunter, Elmegreen and Baker1998), we derive the shear parameter. The timescale over which a density perturbation can grow effectively against galactic rotational shear is of order 1/A, where A is the Oort constant. With dimension t −1, the Oort constant A measures the local shear level and is defined by:
 \begin{equation}
A=0.5 \left( \frac{V}{R} - \frac{dV}{dR} \right) \, ,
\end{equation}
\begin{equation}
A=0.5 \left( \frac{V}{R} - \frac{dV}{dR} \right) \, ,
\end{equation}
 \begin{equation}
A= 0.5 \left( \frac{V}{R} - \frac{\mid V(R+\frac{r}{2}(1+g)) - V(R-\frac{r}{2}(1+g)) \mid }{2r} \right) \, ,
\end{equation}
\begin{equation}
A= 0.5 \left( \frac{V}{R} - \frac{\mid V(R+\frac{r}{2}(1+g)) - V(R-\frac{r}{2}(1+g)) \mid }{2r} \right) \, ,
\end{equation}
 \begin{equation}
\delta \Sigma _{peak} = \delta \Sigma _{0} \exp \left( \frac{2\pi G \Sigma }{\sigma A} \right) \, ,
\end{equation}
\begin{equation}
\delta \Sigma _{peak} = \delta \Sigma _{0} \exp \left( \frac{2\pi G \Sigma }{\sigma A} \right) \, ,
\end{equation}
 \begin{equation}
C=\frac{\delta \Sigma _{peak}}{\delta \Sigma _{0}}= \exp \left( \frac{2\pi G \Sigma _{sh}}{\sigma A} \right) \, .
\end{equation}
\begin{equation}
C=\frac{\delta \Sigma _{peak}}{\delta \Sigma _{0}}= \exp \left( \frac{2\pi G \Sigma _{sh}}{\sigma A} \right) \, .
\end{equation}
With that in mind, we can easily derive the critical surface density, Σ sh , which represents the minimal surface density needed to resist the shear, given by:
 \begin{equation}
\Sigma _{sh}=\frac{A \sigma \ln (C)}{2\pi G} \, .
\end{equation}
\begin{equation}
\Sigma _{sh}=\frac{A \sigma \ln (C)}{2\pi G} \, .
\end{equation}
Finally, we can define the shear parameter, Sg , which is the ratio between the critical surface density and the actual gas surface density:
 \begin{equation}
S_{g}=\frac{\Sigma _{sh}}{\Sigma }=\frac{A \sigma \alpha _{A}}{\pi G \Sigma } \, ,
\end{equation}
\begin{equation}
S_{g}=\frac{\Sigma _{sh}}{\Sigma }=\frac{A \sigma \alpha _{A}}{\pi G \Sigma } \, ,
\end{equation}
2.2 The effect of tides
2.2.1 The tidal acceleration T
To study the tidal stability of GMCs in the LMC, we begin by considering the local gravitational stability and then add the influence of the galaxy. To evaluate the stability state of the GMCs, we use the Roche criterion which defines the region where tidal forces dominate over gravity.
We initially consider clouds which are self-gravitating, or ‘bound clouds’ as defined by Blitz & Glassgold (Reference Blitz and Glassgold1982). A cloud will be bound if its gravitational energy is greater than its kinetic energy, which is traced by the velocity dispersion, σ, via:
 \begin{equation}
\left|\frac{-GM}{r}\right| \ge \frac{1}{2}\sigma ^{2} \, ,
\end{equation}
\begin{equation}
\left|\frac{-GM}{r}\right| \ge \frac{1}{2}\sigma ^{2} \, ,
\end{equation}
Next we add the influence of the galaxy, which can contribute to the cloud stability in two ways: (i) it can act like gravity and help confine the cloud, and (ii) it can act against gravity and disrupt the cloud. The expression for the tidal acceleration T given by Stark & Blitz (Reference Stark and Blitz1978) is
 \begin{equation}
T=\frac{V^{2}}{R^{2}}-\frac{\partial }{\partial R}\left(\frac{V^{2}}{R}\right) \, ,
\end{equation}
\begin{equation}
T=\frac{V^{2}}{R^{2}}-\frac{\partial }{\partial R}\left(\frac{V^{2}}{R}\right) \, ,
\end{equation}
If now we ignore the internal velocity of the cloud and integrate the cloud radius times the tidal acceleration Tr along its radius, our bound cloud must obey the following energy equation in order to resist the galactic tide:
 \begin{equation}
\left|\frac{-GM}{r}\right| \ge \frac{1}{2} Tr^{2} \qquad \textrm {with } {\sigma = 0} \, .
\end{equation}
\begin{equation}
\left|\frac{-GM}{r}\right| \ge \frac{1}{2} Tr^{2} \qquad \textrm {with } {\sigma = 0} \, .
\end{equation}
We will use various rotation curves of the LMC from the literature to obtain V(R) and hence determine the tidal acceleration T.
2.2.2 Roche criterion
The Roche limit of a body orbiting around a more massive object is the minimal distance where this body is held together by its own gravity in the rotating frame. Below this limit, the orbiting body can be torn apart by the tidal force of the more massive object. The Roche criteria for our GMCs is an equilibrium between the self-gravity of the cloud, its internal pressure, and the galactic tide. To derive this expression, Stark & Blitz (Reference Stark and Blitz1978) used the fact that the total energy (the sum of the kinetic, gravitational, and tidal energy) of the cloud must always be less than the energy at the inner Lagrange point, a stationary position where the gravitational attraction of the galactic centre cancels the self-gravity of the cloud. If the total energy is higher than the energy at the inner Lagrange point, the cloud will migrate from its actual position to the inner Lagrange point and be torn apart around this point. Evaluating the potential at the inner Lagrange point, the Roche criterion is given by:
 \begin{equation}
\frac{1}{2}\sigma ^{2} -\frac{GM}{r} - \frac{1}{2} Tr^{2} + \frac{3}{2}(GM)^{2/3}T^{1/3} < 0 \, .
\end{equation}
\begin{equation}
\frac{1}{2}\sigma ^{2} -\frac{GM}{r} - \frac{1}{2} Tr^{2} + \frac{3}{2}(GM)^{2/3}T^{1/3} < 0 \, .
\end{equation}
We will use this expression to determine the tidal stability of our sample of GMCs.
3 DATA
In this section, we introduce the MAGMA survey and the catalogue of the LMC GMCs used in this study and discuss how we evaluate the star formation activity in these clouds. We also describe the rotation curves used to estimate the galactic influence on the stability of GMCs.
3.1 The MAGMA survey
The Magellanic Mopra Assessment (MAGMA) consists of CO (J = 1-0) mapping survey of both the LMC and the Small Magellanic Cloud. Observations for the LMC were performed with the ATNF Mopra 22-m telescope from 2005 to 2010 and initially targeted the 114 brightest clouds of the NANTEN surveys by Fukui et al. (Reference Fukui2008). The survey covered a total area of 3.6 deg2, where the known CO complexes from the NANTEN survey were located, but with an improved angular resolution by a factor 4 to resolve the largest GMCs. The observed MAGMA fields cover a large fraction (80%) of the total CO emission from the LMC traced by the NANTEN data. The angular resolution of the MAGMA data is about 45″, corresponding to a linear scale of ~11 pc. In this work, only clouds with a radius greater than 11 pc were included in our analysis. The RMS of the noise fluctuations ranges from 0.2 to 0.5 K per 0.5 km/s channel, with a mean value of 0.3 K. For a typical GMC linewidth of 3 km/s, the 3σ sensitivity limit is 5 M⊙pc − 2, assuming X CO = 2 × 1020 cm−2(K km s−1)−1.
To identify significant CO structures in the MAGMA data cubes, the automated CPROPS package (Rosolowsky & Leroy Reference Rosolowsky and Leroy2006) was used to identify ‘emitting islands’, defined as isolated regions of significant emission (greater than 3σ) expanded in all directions in the data cube to a 2σ edge. Those emitting regions were then decomposed into 450 individual clouds, of which 260 have r > 11 pc. The catalogue derived by Wong et al. (Reference Wong2011) provides a range of information about the 260 resolved clouds in terms of their structure and properties. For this work, we use the GMCs’ radius r, major-to-minor axes ratio a/b, galactocentric radius R, total integrated CO mass M CO, velocity dispersion σ, and peak CO brightness temperature T CO. The GMCs identified by MAGMA have typical radii between 5 and 71 pc, masses between 3 × 10³ and 2 × 10⁶ M⊙, and velocity dispersion between 2 and 32 km/s, with average values of 28 pc, 1.5 × 10⁵ M⊙, and 2.8 km/s respectively. All the GMCs used in our study are located in the inner part of the LMC with R < 3500 pc.
3.2 24 μm flux density
It has recently been shown by Relaño & Kennicutt (Reference Relaño and Kennicutt2009) that there is a good spatial correlation between 24 μm and Hα emission in M33, suggesting that the dust emitting at 24 μm is predominantly heated by the emission coming from OB stars within the H II regions. Emission at 24 μm is thus an efficient signature of ionised photons inside an H II region. Therefore, we will use the 24 μm surface brightness derived for each GMC of the MAGMA survey as a proxy for their star formation activity.
To trace the emission at 24 μm in the LMC, we use the Spitzer mosaic obtained by the Surveying Agents of Galaxy Evolution (SAGE) Legacy Program (Meixner et al. Reference Meixner2006), using the Multiband Imaging Photometer (Rieke et al. Reference Rieke2004). The native angular resolution of this map is 6″, and the surface brightness sensitivity to diffuse emission is 1 MJy sr−1. We use the full enhanced LMC mosaic that is publicly available through the Spitzer Science Centre archiveFootnote 2 . Spitzer observations for the SAGE project were scheduled at two different epochs, separated by an interval of three months, in order to minimise striping artefacts and to constrain source variability. We use the image that was produced by combining both epochs of observations. Processing of the SAGE Legacy data includes steps to remove residual instrumental signatures and to subtract background emission at 24 μm. To estimate the average 24 μm surface brightness associated with a GMC in the MAGMA catalogue, we use the mean value of all pixels within the projected area of cloud.
3.3 Galactic rotation curves
In order to evaluate the tidal acceleration T and the Oort constant A for the shear parameter Sg , we need data from the rotation curve of the LMC which provides the radial velocity V(R). Once the radial velocity is known, we can derive values for T(R) and A(R) throughout the LMC. Since both the tidal acceleration and the shear parameter are strongly dependent on the galactocentric radius R (and by extension the radial velocity V) for small galactocentric radii, we evaluate the stability by using three different determinations of the LMC rotation curve:
-
1. The first rotation curve is from Feitzinger (Reference Feitzinger and Evans1979), which uses data from the HI survey of the LMC by McGee & Milton (Reference McGee and Milton1966). The beam size of the survey using was about 14.5′ and the velocity resolution 7 km/s for a sample of 330 objects. This dataset was also used by Blitz & Glassgold (Reference Blitz and Glassgold1982) to determine the tidal stability of atomic clouds in the LMC. The LMC parameters deduced by McGee & Milton (Reference McGee and Milton1966) and adopted by Feitzinger (Reference Feitzinger and Evans1979) include distance (52 kpc), rotation centre coordinates (α= 5:20:00, δ= − 69:00:00), inclination (27°), and position angle (170°).
-
2. The second rotation curve is from Wong et al. (Reference Wong2009), who use the HI survey of Kim et al. (Reference Kim, Staveley-Smith, Dopita, Freeman, Sault, Kesteven and McConnell1998) with improved proper motion measurements. The radial velocity map was corrected for the LMC's proper motion as determined by Kallivayalil, van der Marel, & Alcock (Reference Kallivayalil, van der Marel and Alcock2006) using the expressions given by van der Marel et al. (Reference van der Marel, Alves, Hardy and Suntzeff2002). The GIPSY programme ROTCUR was used to fit a rotation curve with best fit values for the receding major axis position angle (341°), the systemic velocity (277 km/s), and the centre position (α = 5:19:30, δ = − 68:59:00) determined by Wong et al. (Reference Wong2009). The disk inclination, which is not well-constrained by the gas kinematics, was fixed at 35°, based on the photometric study by van der Marel & Cioni (Reference van der Marel and Cioni2001).
-
3. The third rotation curve is that derived for carbon stars from Alves & Nelson (Reference Alves and Nelson2000). Their procedure was as follows: positions and galactocentric radial velocities for Magellanic Cloud carbon stars were taken from Kunkel, Irwin, & Demers (Reference Kunkel, Irwin and Demers1997), discarding all Small Magellanic Cloud stars, intercloud carbon stars, and carbon stars located near the centre of the LMC (Kunkel et al. Reference Kunkel, Irwin and Demers1997), resulting in homogeneous dataset of 422 carbon stars. Then the carbon star velocities were corrected for the projected radial velocity gradient by adopting the LMC space motion calculated by Kroupa & Bastian (Reference Kroupa and Bastian1997). Assuming the centre of the LMC is at α = 05:17:06 and δ = − 69:02:00 and an inclination of 33°, they convert each carbon stars right ascension and declination into spherical coordinates, then derive the galactocentric radius R and the velocity function V.
A common parametrisation of the radial velocity V as a function of galactocentric radius R is given by Binney & Tremaine (Reference Binney and Tremaine1987):
 \begin{equation}
V=\frac{V_{0}}{1+\left(\frac{R}{R_{0}}\right)^{-\gamma }} \, ,
\end{equation}
\begin{equation}
V=\frac{V_{0}}{1+\left(\frac{R}{R_{0}}\right)^{-\gamma }} \, ,
\end{equation}
 \begin{equation}
\chi ^{2}= \sum _{i}^{N} \left( \frac{V_{obs}(i) - V_{mod}(i)}{\epsilon _{V}}\right)^{2} \, ,
\end{equation}
\begin{equation}
\chi ^{2}= \sum _{i}^{N} \left( \frac{V_{obs}(i) - V_{mod}(i)}{\epsilon _{V}}\right)^{2} \, ,
\end{equation}
Table 1. Rotation curve parameters from χ2 best fit to the three datasets.
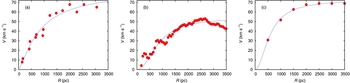
Figure 1. Least squares fit to the three LMC rotation curves, V(R), used in this work from (a) Feitzinger (Reference Feitzinger and Evans1979), (b) Wong et al. (Reference Wong2009), and (c) Alves & Nelson (Reference Alves and Nelson2000). The symbols are the observations from those works and the curves are our best fit to the data.
4 RESULTS
Here we report the results from our analysis using the shear parameter and the tidal acceleration to investigate the stability of the LMC's GMCs. In addition, potential relationships between these instability quantities and cloud properties, as well as star formation activity, are investigated.
We use the rotation curve from Feitzinger (Reference Feitzinger and Evans1979) to derive the values for the Oort constant values A (equation (2)) and tidal acceleration T (equation (8)). (Using the other two rotation curves does not strongly change our conclusions, but a qualitative discussion of their impact is presented in Section 5.) We assume a X CO factor equal to 3 × 1020 cm−2 (K km s−1)−1 to derive the mass and surface density of the MAGMA GMCs from measurements of their CO luminosity and surface brightness, and then derive the ratio between the actual CO mass and the minimal mass, M CO/Mmin , required for tidal stability. Ideally when calculating the GMC mass we would like to use the H2 mass, since it is the major constituent of the GMCs. We discuss our choice of X CO factor, and its potential impact on our results, in Section 5.
4.1 The shear parameter
Figure 2 shows the distribution of the shear parameter, Sg , for all our GMCs. We can immediately see that the distribution ranges between 0.03 and 0.48 and peaks around Sg ~ 0.12. Since Sg < 1, shear is not the dominant mechanism supporting the clouds against gravitational collapse. Similar conclusions were derived for the Milky Way by Dib et al. (Reference Dib, Helou, Moore, Urquhart and Dariush2012). Note that we obtain an average value of the Oort constant A = 13 km/s/kpc, which is consistent with the local value for the Milky Way of 15 km/s/kpc (Feast & Whitelock Reference Feast and Whitelock1997). Moreover, as can be seen in Figure 3, the shear parameter Sg remains almost constant (with a median value ~ 0.12) across the galaxy for gravitationally bound and unbound GMCs as defined by the virial parameter α vir , and thus no specific location with high values of the shear parameter Sg could be identified. This result further supports the findings of Dib et al. (Reference Dib, Helou, Moore, Urquhart and Dariush2012) for the Milky Way. We also investigated the importance of shear in the very high star forming region 30 Doradus (Torres-Flores et al. Reference Torres-Flores, Barbá, Maíz Apellániz, Rubio, Bosch, Hénault-Brunet and Evans2013), by selecting all the clouds in a 0.5° radius around the centre of 30 Dor (RA: 84.658° and Dec: –69.095°). We found eight clouds inside this radius with shear parameter, Sg , ranging between 0.09 and 0.32 with a mean value of 0.18, which is consistent with the mean value over the complete sample Sg ~ 0.12. The virial parameter taken here as α vir = 5rσ2/GM CO distinguishes the unbound clouds for which the kinetic energy dominates over the gravitational energy (α vir > 1), from the gravitationally bound clouds which have less kinetic energy than gravitational energy (α vir < 1). We notice that the sub-sample for unbound clouds (α vir > 1) in Figure 3 tends to have higher Sg than the gravitationally bound clouds (α vir < 1). While it is physically intuitive that less strongly bound clouds are more liable to disruption by external effects, we note that this correlation may be partially algebraically imposed, since σ and r both appear in the numerator of our expressions for α vir and Sg .
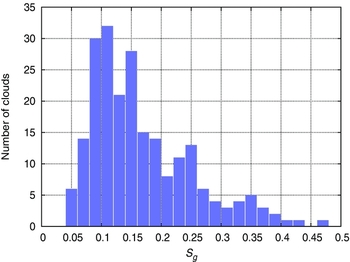
Figure 2. Distribution of the shear parameter Sg for our selected sample of 260 GMCs.

Figure 3. Variation of the shear parameter, Sg , for our selected sample of 260 resolved GMCs as a function of the galactocentric radius, R. The blue triangles are the gravitationally bound clouds (α vir < 1) and the red dots are the unbound clouds (α vir >1). The dotted line shows the median value of Sg for the entire sample of clouds in radial bins of 0.5 kpc.
We next compare the importance of shear for each cloud with its intrinsic properties such as mass, radius, velocity dispersion, and major-to-minor axes ratio in Figure 4. No strong correlations between GMC properties and shear have been found. Figure 4b shows a weak trend for the largest clouds to have higher Sg , suggesting that large clouds are more influenced by shear, although their Sg values are all a factor of >2 less than unity and hence well below the threshold for disruption by shear (see Figure 2). However, Figure 4 a shows no correlation between mass M CO and Sg values. Figure 4c suggests that the shear parameter, Sg , increases with increasing values of the velocity dispersion σ but, as noted previously, this trend may reflect the covariance of Sg with σ.
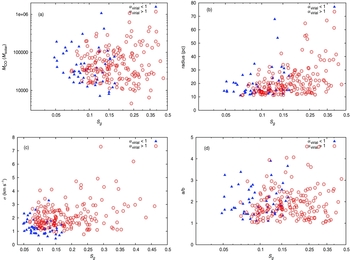
Figure 4. Relationship between the shear parameter Sg and (a) the cloud mass M CO in solar masses, (b) the cloud radius r in pc, (c) the velocity dispersion σ in km/s, and (d) the major-to-minor axes ratio, a/b. The blue triangles are the gravitationally bound clouds (α vir < 1) and the red dots are the unbound clouds (α vir >1).
Dobbs & Pringle (Reference Dobbs and Pringle2013) ran numerical simulations to test cloud evolution on large galactic scales. From their study of one particular cloud, they found that shear plays a key role in the dispersal of the cloud through its morphology, finding that filamentary clouds are more easily torn apart than round clouds, and that the filamentary morphology of GMCs is partially the result of shearing forces. The galaxy simulated by Dobbs & Pringle (Reference Dobbs and Pringle2013) is a massive spiral disk galaxy with a 2-armed spiral perturbation. Its stellar potential is deeper and the shear strength is correspondingly higher than in the LMC, which is a low-mass, irregular system. Figure 4d shows that there is no correlation between the major-to-minor axis ratio of the LMC GMCs and the shear parameter, and the elongated clouds exhibit a broad range of shear parameter values. One possibility is that local dynamical events play a more important role in shaping GMC morphology in the LMC than in disk galaxies, where shear is more dominant.
Figure 5 shows the 24 μm flux density versus the shear parameter for each cloud. As previously discussed, the 24 μm flux can be used to infer star formation activity. Shear instability resulting in cloud disruption is expected to be an obstacle for star formation. We find no correlation between the shear parameter of the clouds and their star formation activity, which is not surprising given the low absolute values of Sg for LMC GMCs and suggests that local and/or internal physical processes such as magnetic fields, turbulence, and stellar feedback are more important for regulating the onset and progress of SF in LMC molecular clouds.

Figure 5. Relationship between the shear parameter, Sg , for our selected sample of 260 resolved GMCs and the average 24 μm flux density, F 24, used as a star formation tracer. The blue triangles are the gravitational bound clouds (α vir < 1) and the red dots are the unbound clouds (α vir > 1).
4.2 The tidal acceleration
We plot the tidal acceleration T as a function of the galactocentric radius R for each rotation curve discussed in Section 3.3 in Figure 6. If we first consider the region of interest between 1000 and 3500 pc, the tidal acceleration is in the range 500 − 2000 km s − 2kpc − 2, which are similar to the values derived by Blitz & Glassgold (Reference Blitz and Glassgold1982) for the LMC. Logically, one expects that the tidal acceleration will decrease as we move away from the centre of the galaxy. However, we can see from Figure 6 that the tidal acceleration can take negative values in the inner 300 pc for the rotation curve from Feitzinger (Reference Feitzinger and Evans1979), 500 pc for the rotation curve from Alves & Nelson (Reference Alves and Nelson2000), and 1000 pc for Wong et al. (Reference Wong2009). Those surprising values can be attributed to the fact that the galactic bulge remains poorly constrained, and indeed there are few data points in the inner part of the LMC (Figure 1) to accurately constrain the rotation curve. Moreover, the exact location of the kinematic galactic centre remains unknown. Beyond the inner few 100 pc the T curves are more typical of the expected shape, so we need to be cautious of the results for the GMCs close to the galactic centre. As a precaution, while using the rotation curve from Feitzinger (Reference Feitzinger and Evans1979), we discard all the clouds located interior to a galactocentric radius of 300 pc, reducing our sample from 260 to 224 resolved clouds.

Figure 6. The tidal acceleration T versus galactocentric radius R, where the T values have been derived from the three different rotation curves of Feitzinger (Reference Feitzinger and Evans1979), Alves & Nelson (Reference Alves and Nelson2000), and Wong et al. (Reference Wong2009).
4.3 Evaluation of the minimal mass from the Roche criteria
With the T values and the geometric and physical parameters of the GMCs, such as velocity dispersion σ, radius r, and CO mass M CO from the catalogue of Wong et al. (Reference Wong2011), we can now evaluate the Roche criteria using equation (10) for the 224 resolved GMCs exterior to 300 pc.
Once the Roche criteria is evaluated for each GMC, two pieces of information can be extracted. Firstly, the sign of the Roche criteria tells us whether the GMC is tidally stable or not: if the expression corresponding to equation (10) is negative, then the total energy of the GMC is not sufficient to make the GMC reach the inner Lagrange point and the GMC is tidally stable. Secondly, by setting equation (10) to zero, the minimal mass, M min, of a tidally stable GMC can be calculated.
Figure 7 shows the distribution of the ratio of observed cloud mass to the minimal mass, M
CO/M
min, for our sample. The distribution ranges widely between 0.5 and 7, peaking around 2. However, very few of the GMCs appear to be tidally unstable, i.e. with M
CO/ $M_{\text{min}}<1$
, and 80% of our GMCs have M
CO/
$M_{\text{min}}<1$
, and 80% of our GMCs have M
CO/ $M_{\text{min}}$
between 1.5 and 4. We thus conclude that the GMCs in the LMC are globally stable or at the edge of instability.
$M_{\text{min}}$
between 1.5 and 4. We thus conclude that the GMCs in the LMC are globally stable or at the edge of instability.

Figure 7. Distribution of the ratio between observed cloud mass and minimal mass, M CO/M min, required for tidal stability for our selected sample of 224 resolved GMCs exterior to 300 pc.
Stark & Blitz (Reference Stark and Blitz1978) suggested that because the tidal acceleration T is supposed to be stronger in the inner region of the galaxy, GMCs closer to the galactic centre have to be denser in order to resist the stronger tidal stress. While the tidal acceleration T takes negative values interior 300 pc (see Figure 6), we can investigate a link between the position of the GMCs in the LMC and their M CO/M min ratio beyond 300 pc. Figure 8 presents the variation of the mass ratio as a function of galactocentric radius. There is no specific location with higher or lower tidal stability levels, and indeed the mass ratio ranges widely across all galactocentric radii. However, we can remark that the sub-sample of unbound clouds (α vir >1) tends to have lower M CO/M min (<4) than the gravitationally bound clouds (α vir < 1), suggesting that velocity dispersion may be one of the most significant factors affecting the stability. One may wonder if the M min for tidal stability has any variation with galactocentric radius. If it does, then the lack of dependence of M CO/M min on radius would be quite interesting, and might support the idea that cloud mass is limited by tides. However, we also find no dependence of M min on galactic radius. In the 30 Doradus region, clouds exhibit a mass ratio M CO/M min ranging from 1.2 to 3.75 with a mean value of 2.17, which is consistent with the mean value over the entire sample M CO/M min~2. Thus both stability parameters (M CO/M min and Sg ) for clouds around 30 Doradus do not show any significant difference compared to the values obtained for the complete sample of clouds.
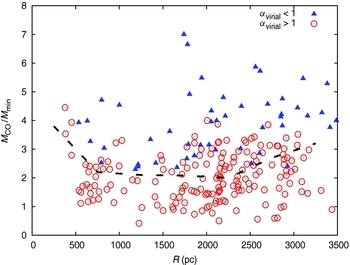
Figure 8. Variation of the ratio M CO/M min as a function of the galactocentric radius R for our selected sample of 224 resolved GMCs exterior to 300 pc. The blue triangles are the gravitational bound clouds (α vir < 1) and the red dots are the unbound clouds (α vir > 1). The dotted line shows the median value of M CO/M min for the entire sample of clouds in radial bins of 0.5 kpc.
We next compare the values of M
CO/ $M_{\text{min}}$
of each cloud with its intrinsic properties such as major-to-minor axes ratio, radius, and value of the peak CO brightness temperature in Figure 9. Regarding the link between morphology and level of tidal stability, it may be worth noting in Figure 9 a that if a/b is > 3.5, corresponding to an elongated cloud, then M
CO/M
min < 3. Even if this trend between cloud morphology and mass ratio is not strong, it does suggest that filamentary clouds may be easier to tidally disrupt. Similarly, Figure 9 b also suggests that the most tidally stable clouds with M
CO/M
min > 3 tend to have smaller radii (< 30 pc), whereas larger radii clouds (> 40 pc) tend to have lower M
CO/M
min < 3. Even if the trend between small cloud radii and stability was noted in the shear parameter study, we stress the fact that, regarding the tidal stability, this trend involves a relatively small number of clouds (< 27%) in our sample. On the other hand, Figure 9 c shows that the M
CO/M
min ratio decreases with increasing velocity dispersion, σ. This suggests that, as the velocity dispersion increases, the GMCs become more susceptible to disruption by tides. However, if GMCs follow a size-linewidth relation, then similar trends of r and σ with M
CO/M
min should be expected. It is not clear from the correlation plots alone as to which is fundamental (i.e. from these plots, we cannot distinguish whether large clouds tend to be closer to the tidal stability limit due to their size or their internal motions).
$M_{\text{min}}$
of each cloud with its intrinsic properties such as major-to-minor axes ratio, radius, and value of the peak CO brightness temperature in Figure 9. Regarding the link between morphology and level of tidal stability, it may be worth noting in Figure 9 a that if a/b is > 3.5, corresponding to an elongated cloud, then M
CO/M
min < 3. Even if this trend between cloud morphology and mass ratio is not strong, it does suggest that filamentary clouds may be easier to tidally disrupt. Similarly, Figure 9 b also suggests that the most tidally stable clouds with M
CO/M
min > 3 tend to have smaller radii (< 30 pc), whereas larger radii clouds (> 40 pc) tend to have lower M
CO/M
min < 3. Even if the trend between small cloud radii and stability was noted in the shear parameter study, we stress the fact that, regarding the tidal stability, this trend involves a relatively small number of clouds (< 27%) in our sample. On the other hand, Figure 9 c shows that the M
CO/M
min ratio decreases with increasing velocity dispersion, σ. This suggests that, as the velocity dispersion increases, the GMCs become more susceptible to disruption by tides. However, if GMCs follow a size-linewidth relation, then similar trends of r and σ with M
CO/M
min should be expected. It is not clear from the correlation plots alone as to which is fundamental (i.e. from these plots, we cannot distinguish whether large clouds tend to be closer to the tidal stability limit due to their size or their internal motions).

Figure 9. Relationship between the ratio M CO/Mmin and (a) the major-to-minor cloud axes ratio a/b, (b) the cloud radius r, and (c) the velocity dispersion σ. The blue triangles are the gravitationally bound clouds (α vir < 1) and the red dots are the unbound clouds (α vir > 1).
Finally, we check if the tidal interaction between the LMC and the GMCs affects the star formation activity. To test this hypothesis, we investigate whether clouds with lower M CO/M min ratio (and hence more sensitive to tidal disruption) are the least active in terms of star formation. Figure 10 shows the 24 μm flux density versus the mass ratio for each cloud, and shows no correlation. Hence, there appears to be no relationship between a cloud's tidal stability and its star formation activity as determined by the 24 μm flux density.

Figure 10. Relationship between the ratio of the observed cloud mass to minimal mass, M CO/M min, and the 24 μm flux density used as a star formation tracer for our selected sample of 224 GMCs. The blue triangles are the gravitational bound clouds (α vir < 1) and the red dots are the unbound clouds (α vir > 1).
5 DISCUSSION
Galactic disk simulations run by Dobbs & Pringle (Reference Dobbs and Pringle2013) demonstrate that shear is a dominant mechanism for cloud disruption (stellar feedback and the general unbound state of GMCs also contribute), and that the influence of shear on GMCs is evident in their morphology, which become more elongated as the cloud is sheared and stretched. We examined whether there is evidence for this effect in the LMC by plotting the shear parameter versus the major-to-minor axis ratio for the clouds (Figure 4d), but found no strong trends. We did, however, find that GMCs with larger radii have higher shear parameters. Indeed, larger GMCs have larger line widths (for which the velocity dispersion σ is a proxy), which naturally causes the shear parameter to increase (since the velocity dispersion appears in the numerator of the shear parameter, see equation (6)). Overall, the discrepancy between our results and the predictions of Dobbs & Pringle (Reference Dobbs and Pringle2013) tends to support the idea that different physical processes are responsible for cloud disruption in different galactic environments and, as a corollary, that GMCs may have characteristic lifetimes that also vary with environments. We note, however, that Dib et al. (Reference Dib, Helou, Moore, Urquhart and Dariush2012) also found that shear plays only a minor role in the evolution and star formation activity of molecular clouds in the Milky Way [which should be more akin to the system simulated by Dobbs & Pringle (Reference Dobbs and Pringle2013) than the LMC].
Yang et al. (Reference Yang, Gruendl, Chu, Mac Low and Fukui2007) derived a multicomponent Toomre criterion for the LMC, finding that 85% of their massive YSO candidates lie in gravitationally unstable regions, implying that star formation occurs predominantly in these regions. They conclude that large-scale gravitational instability is the ultimate driver of star formation. Our finding that shear and galactic tides do not exert a strong influence on the star-forming activity within GMCs is not necessarily in contradiction to this, since large-scale gravitational instability may regulate the formation of GMCs, even if star formation on cloud-scales is independent of large-scale dynamical effects once a GMC has been assembled. We further note that Hunter et al. (Reference Hunter, Elmegreen and Baker1998) used the Toomre criterion and the shear parameter to study the gravitational state of GMCs in 15 irregular galaxies and suggested that the Toomre criterion was overestimating the instability. Using A to quantify the gas kinematics instead of the traditional epicyclic frequency κ for the Toomre criterion may produce a difference in the instability threshold, especially for rising rotation curves and low shear environments like the LMC. As a result, the estimated shear parameter Sg can be significantly lower than the Toomre parameter Qg . Hunter et al. (Reference Hunter, Elmegreen and Baker1998) concluded that even if the shear model was better able to reproduce the observations than the Toomre model, both models fail to probe star formation activity, suggesting that other processes are important in irregular galaxies.
Consider now the stability of GMCs against galactic tidal forces, an idea first introduced by Stark & Blitz (Reference Stark and Blitz1978), which assesses the balance between cloud's self-gravity, internal (thermal + turbulent) pressure, and the large-scale galactic tide. They found that the Milky Way's GMCs are only three times more massive than the tidal disruption limit, suggesting that tidal forces can have an influence on GMC morphology. In our study of the LMC, we indeed found that ~70% of our sample have M CO/Mmin < 3, and found a weak trend for highly elongated clouds to have a lower mass ratio. However, the weakness of this trend forces us to remain cautious with regards to the link between tidal effects and cloud's morphology.
Blitz (Reference Blitz1985) studied a GMC sample in M31. Since tidal acceleration values and average masses of that sample are comparable to those of Stark & Blitz (Reference Stark and Blitz1978), Blitz concluded that GMCs in M31 may also have their mass, size, and morphology tidally limited. In our study of the LMC using the shear and tidal effects, we also noticed a tendency for clouds with larger radii (>35 pc) to be more susceptible to tidal disruption. Indeed, larger GMCs are spatially more extended and thus are likely closer to filling their Roche lobes, which causes them to be more sensitive to tidal effects. Since ~90% of our clouds have a radius below that limit, one might suggest that there are not many clouds above that size because of stronger tidal effect.
Rosolowsky & Blitz (Reference Rosolowsky and Blitz2005) evaluated the tidal stability of GMCs in M64, and found significant shear in the inner part of the galaxy (R < 400 pc), where clouds are marginally stable against tides. The shear parameter evaluation of the inner region of the dwarf galaxies NGC 2915 and NGC 1705 performed by Elson et al. (Reference Elson, de Blok and Kraan-Korteweg2012) shows a clear relation between instability and absence of star formation activity in that zone. A general result is that shear and tidal instability seem to play a more significant role in regulating GMC evolution and star formation in the inner regions of galactic disks. Recently, Colombo et al. (Reference Colombo, Schinnerer and Hughes2013) have shown that the GMC mass spectrum is strongly truncated in the nuclear bar region of M51 (at R < 1 kpc), and propose that this truncation is evidence for shear limiting the growth of high-mass GMCs in this zone. In the LMC, by contrast, Wong et al. (Reference Wong2011) found no evidence for a truncation in the GMC mass spectrum—though we note that the characteristic mass of GMCs in the LMC is already much lower than in M51—and our analysis in this paper indicates no systematic radial variation in the shear parameter or tidal stability of LMC clouds. In M33, the existence of a truncation in the GMC mass spectrum for R < 2.1kpc is still debated [cf. Rosolowsky et al. (Reference Rosolowsky, Keto, Matsushita and Willner2007) and Gratier et al. (Reference Gratier2012)]. M33's rotation curve at these radii has a similar shape to that of the LMC, although the characteristic surface densities of gas and stars are somewhat greater. Taken together, these results again point to the importance of the galactic environment on GMC evolution. A more detailed study of the connection between the shape of the GMC mass spectrum and the dynamical environments within galactic disks is clearly merited, and a topic that will benefit from ALMA's ability to survey the molecular gas in nearby galaxies across a range of Hubble types at cloud scale resolution.
While shear and tidal forces may be important for the formation of GMCs in the LMC, we conclude from our investigations that once a GMC is formed, both shear and tidal effects have a very little impact on GMC's stability. We find that both the shear parameter and the tidal acceleration maintain an almost constant mean value across the LMC. Moreover, GMCs potentially tidally unstable do not have lower star formation activity than the average, neither do GMCs subject to higher shear parameter value. Since we remark that clouds with large radii seem more affected by both tidal and shear effects, we suspect that either these effects may be noticeable only on larger scales than a typical resolved GMC, or tides may have limited the GMC sizes. Furthermore, tidally unstable clouds have lower virial parameter (with high velocity dispersions) than tidally stable clouds, suggesting that internal physical processes of the clouds may be key to their stability state.
Dib et al. (Reference Dib, Helou, Moore, Urquhart and Dariush2012) evaluated the shear for a large sample of resolved GMCs in the Milky Way and found similar conclusions for almost all the molecular clouds: there is no evidence that shear is playing a significant role in instability or in star formation activity, and moreover the shear parameter of the clouds does not depend on their position in the Galaxy. These conclusions may be extended beyond the case of the LMC and the Milky Way in future studies.
5.1 The effect of X CO
The value of the CO-to-H2 conversion factor X CO is supposed to be an inverse function of the metallicity (Narayanan et al. Reference Narayanan, Krumholz, Ostriker and Hernquist2012), but remains poorly constrained. In this work, we used X CO = 3.0 × 1020 cm−2 (K km s−1)−1 derived by Leroy et al. (Reference Leroy, Walter, Brinks, Bigiel, de Blok, Madore and Thornley2008) for the LMC. Many studies (Rosolowsky & Leroy Reference Rosolowsky and Leroy2006; Wong et al. Reference Wong2011) adopt the well established value for the Milky Way of 2.0 × 1020 cm−2 (K km s−1)−1, however, since the metallicity of the LMC is slightly lower than the Milky Way's, the LMC's X CO is likely higher by a factor of two, which corresponds to X CO = 4.0 × 1020 cm−2 (K km s−1)−1 taken by Hughes et al. (Reference Hughes2010) when they derived their GMC catalogue. Thus the proposed value of Leroy et al. (Reference Leroy, Walter, Brinks, Bigiel, de Blok, Madore and Thornley2008) seems to be a good compromise for our study.
To assess the impact of the conversion factor on our results, we performed the tidal stability study using three different values of X CO. Adopting an X CO = 2 × 1020 cm−2(K km s−1)−1 we find that ~20% of the GMCs are tidally unstable, whereas an X CO = 4 × 1020 cm−2(K km s−1)−1 resulted in no unstable clouds. A summary is presented in Table 2. Nevertheless, regardless of the choice of X CO, tidal instability leading to disruption remains marginal through our GMCs sample. A better handle on the value X CO in the LMC is important, but is beyond the scope of this work.
Table 2. Percentage of tidally unstable clouds using various X CO factors and rotation curves.
5.2 Impact of rotation curve
The results presented in Section 4 used the rotation curve of Feitzinger (Reference Feitzinger and Evans1979). In Appendix (Figures A1 and A2) we present results using different rotation curves. We plot the distribution of the shear parameter for the three rotation curves used in this study in Figure A1. The rotation curve of Feitzinger (Reference Feitzinger and Evans1979) results in shear parameter values from 0.03 to 0.48, with a peak at Sg ~ 0.12. Using the rotation curve from Wong et al. (Reference Wong2009), the distribution ranges between 0.02–0.35 and peaks at 0.08, while the rotation curve from Alves & Nelson (Reference Alves and Nelson2000) results in Sg values between 0.02–0.5 and peaks at 0.12. Globally, the range and peak in the shear parameter for our cloud sample are similar regardless of which rotation curve is chosen, and our conclusions regarding cloud properties and stability remain unchanged.
Regarding the tidal acceleration, Figure A2 presents the minimal mass M min of the GMCs plotted against the cloud mass derived with X CO= 3.0 × 1020 cm−2 (K km s−1)−1 using the rotation curve of Feitzinger (Reference Feitzinger and Evans1979), Wong et al. (Reference Wong2009), and Alves & Nelson (Reference Alves and Nelson2000). These plots represent the tidal state of the GMCs: if they are below the 1-to-1 line, their mass is greater than the minimal mass and they are tidally stable. Figure A2 also shows that the GMCs in the LMC are globally tidally stable irrespective of the rotation curve used. Table 2 summarises the limited impact of both rotation curve and X CO on our results using the tidal acceleration as instability factor.
6 CONCLUSIONS
We have studied the stability of a sample of more than 200 resolved GMCs located in the Large Magellanic Cloud using the MAGMA 12CO (J=1-0) survey (Wong et al. Reference Wong2011). We examined the gravitational stability of the GMCs against galactic rotational shear and their tidal stability by evaluating the shear parameter following the method of Dib et al. (Reference Dib, Helou, Moore, Urquhart and Dariush2012), and the tidal effect of the LMC using the method of Stark & Blitz (Reference Stark and Blitz1978). We report the following results and conclusions:
-
1. Galactic shear does not seem to be important regarding the stability of our GMC sample in the LMC. The distribution of the shear parameter Sg peaks around 0.12, which is far from the domain where shear causes cloud disruption (Sg >1). This result holds regardless of which rotation curve we use to calculate the Oort constant value A.
-
2. The GMCs in the LMC seem to be globally tidally stable. The distribution of the ratio between their actual mass and the minimum mass required for tidal stability, M CO/M min, peaks around 2. This result holds regardless of the X CO value we use when calculating M CO or which rotation curve we use for calculating the tidal acceleration T. This result is consistent with the absence of truncation at the upper end of the cloud mass distribution.
-
3. Both the shear parameter Sg and ratio M CO/M min show no systematic variation with distance from the centre of the galaxy.
-
4. No correlation was found between the 24 μm flux density (chosen as a star formation tracer) and stability against shear or tidal disruption. It appears that once the GMCs are formed, their star formation efficiency does not depend on the shear parameter or galactic tidal effects.
-
5. We find no obvious correlation between cloud properties such as galactic position, mass, axis ratio and peak CO brightness temperature, and the GMC's stability against galactic scale dynamical effects. Nevertheless, a weak tendency for clouds with high velocity dispersion to be tidally unstable was found.
-
6. A weak trend was found in which GMCs with larger radii (r > 40 pc) are less resistant against both shear and tidal instability.
The fact that similar conclusions were found using three different rotation curves covering a broad range of tidal acceleration and shear parameter values strengthens our conclusions. Our study, based on the work of Stark & Blitz (Reference Stark and Blitz1978) and Dib et al. (Reference Dib, Helou, Moore, Urquhart and Dariush2012) and applied to the GMC catalogue of Wong et al. (Reference Wong2011), does seem to exclude galactic tides and shear as playing a key role in GMCs instability and star formation processes in the LMC. This result supports the conclusions of Dib et al. (Reference Dib, Helou, Moore, Urquhart and Dariush2012). Thus, shear and tidal effects may be important on large scales in the more diffuse ISM (so therefore could be important for GMC formation), but that once the GMCs form, they achieve a dynamical configuration that is no longer susceptible to modifications by shear or tides. Analysing the GMCs at smaller scales is necessary to understand the evolution of the ISM and star formation processes inside GMCs.
Finally, we must note the limitations of our approach. The formula for the growth of a density perturbation against shear involves surface density Σ and velocity dispersion σ, but it is not clear that we should be using the observed values for these quantities, since what we are observing may already be the result of gravitational amplification. In fact, equation (4) with three different Σ's suggests that these analytic estimates are only a first step. Similarly, it is not obvious we should use observed values of velocity dispersion σ, mass M, and cloud radius r in equation (10) to evaluate the Roche criterion, since those observed values may be obtained under galactic tidal influence.
Moreover, it must be noted that we have not included the effects of magnetic fields in GMCs, which may help to temporally stabilise the GMC by confinement (Shu, Adams, & Lizano Reference Shu, Adams and Lizano1987). We also did not consider the internal cloud motion. The GMCs from the catalogue of Hughes et al. (Reference Hughes2010) clearly have a velocity gradient, with the velocity dispersion varying by up to a factor of three from the cloud centre to the cloud edge. A more elaborate investigation of this phenomenon has been made by Ballesteros-Paredes, Vázquez-Semadeni, & Scalo (Reference Ballesteros-Paredes, Vázquez-Semadeni and Scalo1999) by studying the velocity and density structure inside molecular clouds. The LMC GMCs may in fact be very inhomogeneous: they are likely composed of many sub-structures which can be gravitationally unstable and enhance star formation, as suggested by Rodríguez (Reference Rodríguez, Lidman and Alloin2005).
ACKNOWLEDGEMENTS
This work was partially supported by a Swinburne Faculty of ICT Research Grant Scheme. We thank the anonymous referee for helping improving the quality of the paper. AH thanks Sharon Meidt for useful discussions, and acknowledges funding from the Deutsche Forschungsgemeinschaft (DFG) via grant SCHI 536/5-1 and SCHI 536/7-1 as part of the priority program SPP 1573 ‘ISM-SPP: Physics of the Interstellar Medium’.
A The effect of rotation curve

Figure A1. Distribution of the shear parameter Sg for our selected sample of 260 resolved GMCs using the rotation curve of (a) Feitzinger (Reference Feitzinger and Evans1979), (b) Wong et al. (Reference Wong2009), and (c) Alves & Nelson (Reference Alves and Nelson2000).

Figure A2. Observed cloud mass, M
CO, calculated using X
CO = 3.0 × 1020 cm−2 (K km s−1)−1 versus minimal mass, $M_{\text{min}}$
, required for tidal stability using the rotation curve from: (a) Feitzinger (Reference Feitzinger and Evans1979), (b) Wong et al. (Reference Wong2009), and (c) Alves & Nelson (Reference Alves and Nelson2000). The black 1-to-1 line is the locus of tidal balance.
$M_{\text{min}}$
, required for tidal stability using the rotation curve from: (a) Feitzinger (Reference Feitzinger and Evans1979), (b) Wong et al. (Reference Wong2009), and (c) Alves & Nelson (Reference Alves and Nelson2000). The black 1-to-1 line is the locus of tidal balance.


